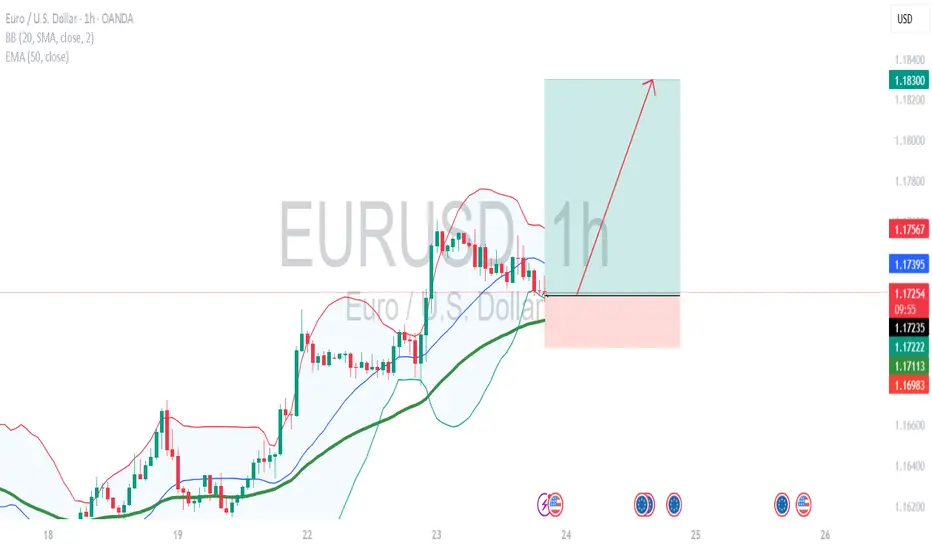
EURUSD bullish trend continuationDaily candle closed with strong bullish.
a healthy pullback observed earlier today during Asian & Europe session.
I'm expecting a bullish movement in US session.
i'm buying at current market price.
calculate your own risk & reward.
Good Luck
USDEUR trade ideas
EURUSD After breakdown it get demand zone at 1.15700 buyers area📊EURUSD 1H Forecast
EURUSD is showing bullish momentum from the demand zone at 1.15700 — a clear buyers' area
Market is pushing up with strength, targeting key resistance levels ahead
📌 Target Zones:
1.16700 – Resistance Level
1.16900 – FVG (Fair Value Gap)
1.17200 – Supply Zone
1.17600 – Bearish Order Block (Watch for reaction)
🕒 Outlook:
Buyers are active from 1.15700, and we expect price to continue climbing toward the FVG and supply zones.
Caution near 1.17600 OB — may trigger profit-taking or reversal
👋Regards From Expert Team


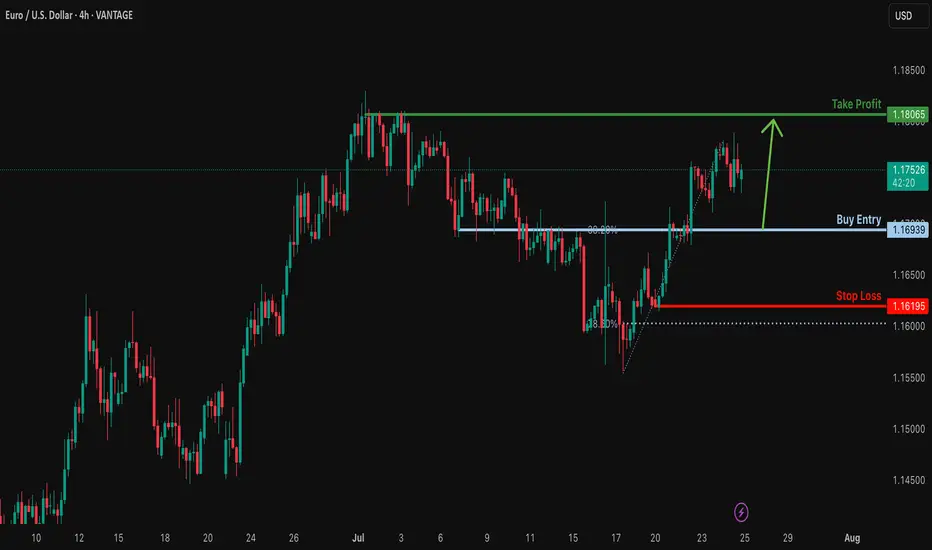
Bullish bounce off overlap support?EUR/USD is falling towards the support level, which is an overlap support that aligns with the 38.2% Fibonacci retracement and could bounce from this level to our take profit.
Entry: 1.1693
Why we like it:
There is an overlap support that lines up with the 38.2% Fibonacci retracement.
Stop loss: 1.1619
Why we like it:
There is a pullback support that is slightly above the 78.6% Fibonacci retracement.
Take profit: 1.1806
Why we like it:
There is a swing high resistance.
Enjoying your TradingView experience? Review us!
Please be advised that the information presented on TradingView is provided to Vantage (‘Vantage Global Limited’, ‘we’) by a third-party provider (‘Everest Fortune Group’). Please be reminded that you are solely responsible for the trading decisions on your account. There is a very high degree of risk involved in trading. Any information and/or content is intended entirely for research, educational and informational purposes only and does not constitute investment or consultation advice or investment strategy. The information is not tailored to the investment needs of any specific person and therefore does not involve a consideration of any of the investment objectives, financial situation or needs of any viewer that may receive it. Kindly also note that past performance is not a reliable indicator of future results. Actual results may differ materially from those anticipated in forward-looking or past performance statements. We assume no liability as to the accuracy or completeness of any of the information and/or content provided herein and the Company cannot be held responsible for any omission, mistake nor for any loss or damage including without limitation to any loss of profit which may arise from reliance on any information supplied by Everest Fortune Group.
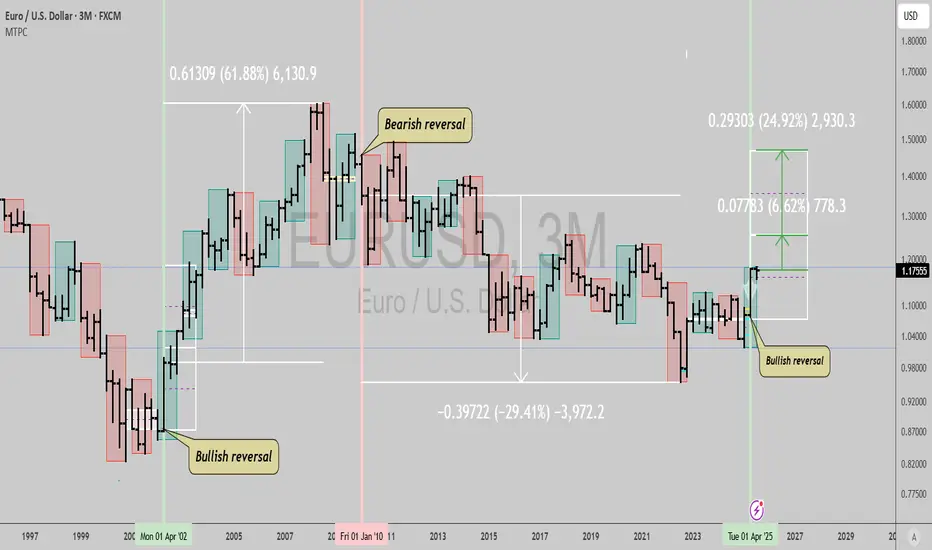
$EURUSD: Massive signal not seen since 2002...GM gents, wanted to bring your attention to the Euro here. This type of signal hasn't happened since 2002, which makes it a very big deal and a very real risk if you're in Europe and holding USD exposure.
We could see a 7% to 25% rally in the coming 2 years from this spot, with pretty high probability, and maybe even a series of similar signals in the same direction for longer like from 2002 to 2010 when the quarterly trend turned bearish decisively.
It's wise to find some way to generate enough returns to cover this currency risk, if you're invested in US stocks, crypto (stables mostly denominated in USD), etc.
Best of luck!
Cheers,
Ivan Labrie.
EUR/USD Recovery in Play — Eyes on ResistanceHi Everyone,
Since our last update, EUR/USD briefly dipped below the 1.16000 level but quickly reclaimed the key 1.16450 zone — a level that continues to serve as an important structural pivot.
Price has since stabilised above this support and is now moving back toward the highlighted resistance area around 1.17450. A sustained push toward 1.18000 in the coming sessions would further reinforce the presence of renewed buying interest.
Our broader outlook remains unchanged: we continue to anticipate the pair building momentum for another move higher. A decisive break above 1.18350 could open the path toward the 1.19290 area and ultimately the 1.20000 handle.
We’ll be watching closely to see whether this recovery gains traction and if buyers can sustain momentum through resistance. The longer-term view remains bullish, as long as price continues to hold above the key support zone.
We’ll continue to provide updates throughout the week as the structure develops and share how we’re managing our active positions.
Thanks again for all the likes, boosts, comments, and follows — we really appreciate the support!
All the best for the rest of the week.
Trade safe.
BluetonaFX

EURUSDI’m seeing similar price action in both GBPUSD and EURUSD. The question is, will they both follow through?


EURUSD Massive Long! BUY!
My dear friends,
Please, find my technical outlook for EURUSD below:
The price is coiling around a solid key level - 1.1627
Bias - Bullish
Technical Indicators: Pivot Points Low anticipates a potential price reversal.
Super trend shows a clear buy, giving a perfect indicators' convergence.
Goal - 1.1710
Safe Stop Loss - 1.1577
About Used Indicators:
The pivot point itself is simply the average of the high, low and closing prices from the previous trading day.
Disclosure: I am part of Trade Nation's Influencer program and receive a monthly fee for using their TradingView charts in my analysis.
———————————
WISH YOU ALL LUCK
SELL EURUSD for bullish trend reversal SELL EURUSD for bullish trend reversal
STOP LOSS : 1.1808
Trade trade is based on false breakout and divergence.....
First what is false breakout, A false breakout in Forex occurs when the price breaks through a key level (like support or resistance) but quickly reverses and returns to its original range, often trapping traders who were expecting a continuation of the breakout. It's essentially a false signal, indicating a potential trend reversal or continuation, but the price doesn't follow through....
Secondly what is divergence ,In forex trading, divergence occurs when the price of a currency pair moves in one direction, while a technical indicator (like an oscillator) moves in the opposite direction. This mismatch can signal a potential trend reversal or weakening trend. There are two main types: bullish and bearish divergence.
On this trade we are taking it because we saw regular bearish divergence
Regular Bearish Divergence
In case of Regular Bearish Divergence:
* The Indicator shows Lower Highs
* Actual Market Price shows Higher Highs
We can see a strong divergence on the RSI already and There is a strong trend reversal on the daily time frame chart.....
The daily time frame is showing strength of trend reversal from this level resistance so we are looking for the trend reversal and correction push from here .....

Euro Surges as Dollar Falters Amid Political TensionsThe EUR/USD pair is experiencing a strong rally, breaking above the 1.1760 level — its highest point in two weeks as of Tuesday. This sharp move not only signals the Euro’s recovery strength but also highlights the impact of heavy selling pressure on the US dollar.
The driving force? Ongoing trade tensions, coupled with rising uncertainty surrounding the escalating feud between President Trump and Fed Chair Jerome Powell, are shaking investor confidence in the stability of US monetary policy.
As a result, the dollar is losing its safe-haven appeal, paving the way for EUR/USD to climb higher. If this bullish momentum holds, the next key target for the pair could be around 1.1800.

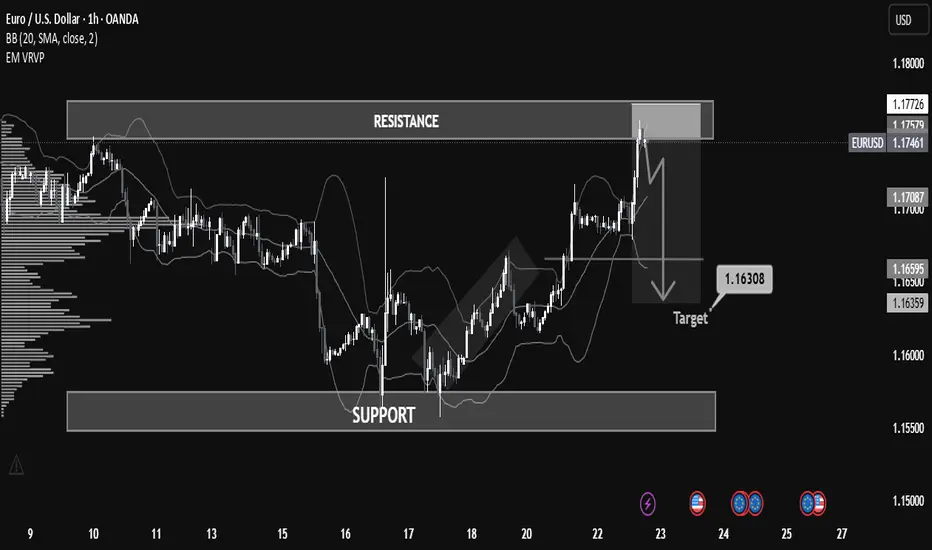
Why EUR/USD Dropped: A Step-by-Step Breakdown for Learners📉 Overview:
The EUR/USD has recently approached a key resistance zone near 1.17726, showing signs of a potential rejection after a bullish rally. The price is currently hovering around 1.17468, forming a short-term bearish setup that could lead to a retracement or reversal.
⸻
⚙ Key Technical Zones:
• 🔼 Resistance: 1.17500 – 1.17726
Price was strongly rejected after testing this area. This level has historically acted as a supply zone.
• 🔽 Support: 1.15500 – 1.16000
This is a historically significant demand zone, where price previously consolidated and reversed.
• 🎯 Target Zone: 1.16308
Marked as a potential take-profit level based on prior price structure and volume profile imbalance.
⸻
🧠 Indicators & Tools:
• Bollinger Bands: Price touched the upper band in overbought conditions, suggesting a possible mean reversion.
• Volume Profile (VRVP): Indicates declining volume near resistance, pointing to weak buyer momentum.
• Price Action: Bearish engulfing candle and strong rejection wick at resistance, confirming selling pressure.
⸻
🧭 Market Bias:
📌 Short-Term Bearish
A short opportunity is forming based on the rejection from resistance and overextension of price.
⸻
🧩 Possible Scenario:
1. Breakdown below 1.17061 (mid-level support) could trigger acceleration to the downside.
2. 1.16500 and 1.16308 are ideal short targets before reevaluation for continuation or bounce.
⸻
🛑 Risk Management Tips:
• Consider SL above 1.17800 (previous high).
• Monitor for confirmation before entry (e.g., bearish candle close below 1.17000).
• Adjust size and risk-reward ratio appropriately.
PROFIT TAKING ON EURUSD BUT UPTREND REMAINS INTACT Looking at the daily timeframe of EURUSD we can see that price action didn't take out liquidity at the Blue rectangle zone which was the all time high for EURUSD.
Going forward,I can anticipate signs of profit taking or hedging by market players or institutions but on general basis the uptrend of EURUSD is still intact.
So I will be anticipating a pullback to the desired zones which I indicated with a red rectangle and later we look for buying opportunities.
Targets are:1.15900,1.14900

Will the Euro collapse on US Tariffs? Traders eye 1.15The EURUSD is under pressure today, dropping nearly half a percent. This follows the new US–EU trade deal that introduces a 15 percent baseline import tariff on most goods. That means Americans buying European products must now pay 15 percent more.
Naturally, markets are adjusting. When one side of a trade deal takes the hit, its currency often weakens. In this case, the euro is sliding as the cost of EU exports rises. If the euro were to fall by the full 15 percent in response, we could see EURUSD drop to parity again. That would balance the new cost for American buyers, making European goods just as affordable as before.
Still, the technical outlook remains neutral. The trend on EURUSD remains bullish until a break below 1.15 occurs. If that happens, it could open the door to 1.12 or even 1.10. Until then, traders watching the chart may stay cautious.
One reason why the EURUSD might gain is that President Trump continues to pressure the Federal Reserve to cut interest rates. If the Fed caves while inflation is still rising, the US could face the same issues that have plagued countries like Turkey, where political pressure has undermined monetary stability and triggered runaway inflation.
In that case, the euro might strengthen, pushing EURUSD back toward 1.20 or higher.
Is this the peak for EURUSD or just a pause before the next leg higher? The next few weeks will reveal the answer.
This content is not directed to residents of the EU or UK. Any opinions, news, research, analyses, prices or other information contained on this website is provided as general market commentary and does not constitute investment advice. ThinkMarkets will not accept liability for any loss or damage including, without limitation, to any loss of profit which may arise directly or indirectly from use of or reliance on such information.

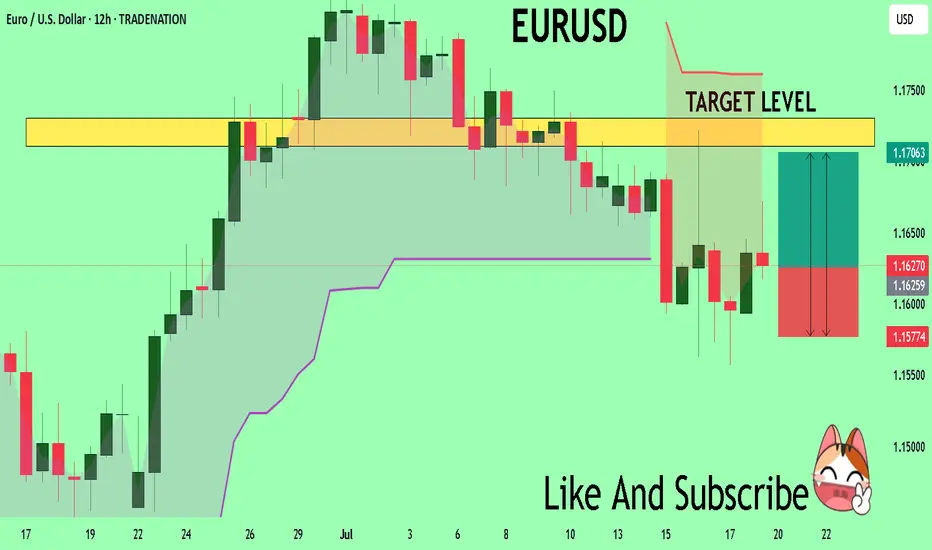
Euro Drops Hard — Is a 100-Pips Slide Toward 1.1500 Next?Euro’s current situation doesn’t look great — we’re clearly seeing strong selling pressure across the board.
Price has now reached the block zones near 1.1600, and I want to break down what this area means to me.
The lower pivot of the 1.1600 zone was created after the 50% level of the previous bullish leg was consumed — which is typical in many bullish trends. Based on that, we expected a move toward 1.1800 to break the structure and continue the uptrend.
However, the recent bullish move lacked strength, which became quite clear during the last upward leg. And now, after that weak rally, we’re witnessing a sharp and aggressive selloff.
This reaction weakens the 1.1600 block in my eyes — and I’m now watching 1.1500 as the more probable target. It’s a major price level and also aligns with a bank-level midline zone.
In my view, it’s still too early to buy. I’d want to see price range and confirm before looking for longs.
That said, this area could be a good place to partially exit short positions and lock in some profits.
🔁 This analysis will be updated whenever necessary.
Disclaimer: This is not financial advice. Just my personal opinion!!!

EURUSD A Fall Expected! SELL!
My dear friends,
Please, find my technical outlook for EURUSD below:
The instrument tests an important psychological level 1.1751
Bias - Bearish
Technical Indicators: Supper Trend gives a precise Bearish signal, while Pivot Point HL predicts price changes and potential reversals in the market.
Target - 1.1708
About Used Indicators:
Super-trend indicator is more useful in trending markets where there are clear uptrends and downtrends in price.
Disclosure: I am part of Trade Nation's Influencer program and receive a monthly fee for using their TradingView charts in my analysis.
———————————
WISH YOU ALL LUCK

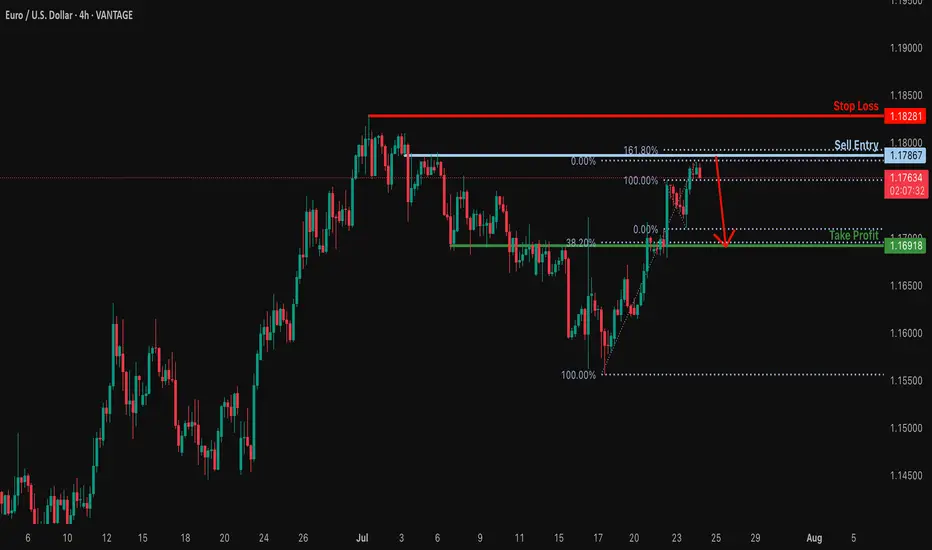
Bearish reversal off 161.8% Fibonacci resistance?EUR/USD is rising towards the resistance level which is a pullback resitance that lines up with the 161.8% Fibonacci rretracement and could drop from this level to our take profit.
Entry: 1.1786
Why we like it:
There is a pullback resistance level that lines up with the 161.8% Fibonacci extension.
Stop loss: 1.1828
Why we like it:
There is a swing high resistance.
Take profit: 1.1691
Why we like it:
There is an overlap support that aligns with the 38.2% Fibonacci retracement.
Enjoying your TradingView experience? Review us!
Please be advised that the information presented on TradingView is provided to Vantage (‘Vantage Global Limited’, ‘we’) by a third-party provider (‘Everest Fortune Group’). Please be reminded that you are solely responsible for the trading decisions on your account. There is a very high degree of risk involved in trading. Any information and/or content is intended entirely for research, educational and informational purposes only and does not constitute investment or consultation advice or investment strategy. The information is not tailored to the investment needs of any specific person and therefore does not involve a consideration of any of the investment objectives, financial situation or needs of any viewer that may receive it. Kindly also note that past performance is not a reliable indicator of future results. Actual results may differ materially from those anticipated in forward-looking or past performance statements. We assume no liability as to the accuracy or completeness of any of the information and/or content provided herein and the Company cannot be held responsible for any omission, mistake nor for any loss or damage including without limitation to any loss of profit which may arise from reliance on any information supplied by Everest Fortune Group.
EUR/USD Robbery Blueprint Bear Strike Activated!💣🎯Operation Fiber Down: EUR/USD Robbery Blueprint (Day Trade Edition) 💰🔫
🚨 Thieves, Hustlers & Chart Bandits Assemble! 🚨
🌍 Hi! Hola! Ola! Bonjour! Hallo! Marhaba! 🌍
Welcome back to another Thief Trading Operation, where the money never sleeps—and neither do we. Let’s break into the vault of EUR/USD “The Fiber” with surgical precision. 🧠💼🕶️
🧨 THE MASTER ROBBERY PLAN: EUR/USD SHORT STRIKE 🔍💸
💀 Market Bias: Bearish – Trend Reversal + Supply Trap Setup
🎯 Target: 1.15800
🛑 Stop-Loss: Near Swing High (around 1.17400 – 3H chart view)
🕓 Timeframe Focus: 15m / 30m / 3H
🧭 ENTRY ZONE:
👣 Plan your entry from recent high retests—that’s where the big money bulls get trapped.
🎯 Use Sell Limit Orders (DCA style / Layered Limit Orders) like a true thief setting up tripwires.
💼 RISK STRATEGY:
💡 SL should match your lot size and order count—not one-size-fits-all!
📌 Place above key structure or swing level (e.g. 1.17400) based on timeframe.
🔍 BEHIND THE SCENES – THE WHY:
The EUR/USD "Fiber" pair is showing all the classic signs of a trend shift and bear raid setup, including:
📰 Fundamentals weakening the Euro
💣 COT Report reveals institutional exits
🍂 Seasonal Bias points to downward trend
📉 Intermarket Pressure from bond yields & USD strength
📊 Sentiment turning overly bullish = trap zone
⛽ Storage & Inventory imbalances adding fuel
📌 Reminder: Before any robbery, study the layout—Macro, Fundamentals, Sentiment, and Intermarket are your blueprint.
🚨 HEIST ALERT – PROTECT THE LOOT:
🕰️ High-Impact News Events? Tighten up!
💼 Don’t take fresh entries during releases.
🔐 Use Trailing SLs to lock in profits.
🎯 Exit with grace before the sirens start.
⚡🔥JOIN THE CREW, BOOST THE LOOT🔥⚡
💥 Smash the Boost Button 💥 if you're vibing with the Thief Trading Movement.
We ain’t just trading—we’re executing strategic robberies on the market’s weaknesses.
🧠💪 Every like = more power to the crew. Every comment = a new map to a vault.
We rob, retreat, and repeat. Let’s make money with skill, not luck. 🕶️💰🚁
⚠️ LEGAL COVER (For the Lawyers 😏):
This plan is not investment advice, just an organized heist blueprint by chart robbers.
Always manage your own risk and update your plan as the market evolves.
🕶️ Stay ready for the next master plan... Until then, keep your charts clean and your stops tight. 🕶️💣📉
– Thief Trader Out 🐱👤🚀

Sell eurusdBearish wave expected now
Daily support trend already breaks
Still monthly overbought pair
Strong bearish correction expected

Quick short on the pull back of EURUSDPrice touched a supply zone and formed a break of structure on the 1 hour. I may have missed the entry, but i placed a sell limit with a TP to the imbalance below.

EURUSD – Recovery losing steam, correction risk is risingAfter rebounding from the trendline support, EURUSD is now approaching the key resistance area around 1.17500 — a zone that has historically triggered multiple rejections. However, with French and German PMI figures coming in below expectations and the ECB holding rates steady without providing any fresh policy guidance, the euro lacks the momentum for a sustained move higher.
On the H4 chart, price action is showing signs of exhaustion as it tests resistance. If buyers fail to break through convincingly, a pullback toward the 1.16800 support zone — or even deeper toward 1.16400 — becomes increasingly likely.
Preferred strategy: Watch for bearish rejection patterns near 1.17500. If confirmed, this could be a favorable opportunity to initiate short positions in anticipation of a correction.

EURUSD: the ECB weekThe focus of the previous week was on US inflation figures. Posted data showed relatively stable figures for June, as inflation was standing at 0,3% for the month and 2,7% on a yearly basis. Both figures were in line with market expectations. Core inflation remained elevated and reached 0,2% for June and 2,9% y/y. At the same time, core inflation was by 0,1pp lower from market forecasts. The Producers Price Index in June was standing at 0%, same as core PPI. Compared to the year before, PPI was increased by 2,3%, while core PPI was higher by 2,6%. Retail sales in June were higher by 0,6%, and were better from market estimates of 0,1%. Building permits preliminary for June reached 1,397M and housing starts were standing at 1,321M in line with market expectations. The University of Michigan Consumer Sentiment preliminary for June was at the level of 61,8 in line with forecasts. Five year inflation expectations cooled a bit to 3,6%, from previous 4%. This year inflation expectations also eased to 4,4% from previous 5%.
The Industrial Production in the Euro Zone in May was higher by 1,7% for the month, bringing the indicator to the level of 3,7% on a yearly basis. Both figures were much higher from market forecasts of 0,9% for the month and 2,4% for the year. The ZEW Economic Sentiment Index in July for Germany reached the level of 52,7 a bit higher from forecasted. The final CPI in the Euro Zone in June was 2,3% y/y and core CPI at 2,3%, without change from the previous estimates.
For the second week in a row markets favored the US Dollar, which strengthened to the level of 1,1570 against euro. The currency pair ended the week at the level of 1,1626. The RSI continues to move around the level of 50 and is still not ready for a move toward the oversold market side. The MA50 continues to diverge from MA200, without an indication of a potential change in course in a near term period.
With a move toward the 1,1560, the eurusd tested the short term support line. At this level, the currency pair peaked in April this year. Charts are pointing to a potential for the short term reversal in the coming period. In this sense, levels modestly above the 1,17 resistance could be shortly tested. On the opposite side, 1,1560 might be tested for one more time at the start of the week, before the move toward upside. It should be considered that the ECB meeting will be held in a week ahead, where ECB members will draw the interest rate decision. A pause in rate cuts is overwhelmingly expected by market participants.
Important news to watch during the week ahead are:
EUR: GfK Consumer Confidence in august in Germany, HCOB manufacturing PMI flash for July for both Germany and Euro Zone, ECB meeting and interest rate decision will be held on Thursday, July 24th, Ifo Business Climate in July in Germany,
USD: Existing Home Sales in June, Durable Goods Orders in June.

EURUSD_1D_SellEurodollar Analysis Medium-term Time Elliott Wave Analysis Style The market can enter a downtrend due to the completion of five ascending waves, which will be in the form of three ABC waves Important and main resistance number 1.1666 Target 1.0800
