EURUSD Bearish Breakout !
HI,Traders !
#EURUSD was trading along
The rising support line but
Now we are seeing a bearish
Breakout so we are bearish
Biased and we will be expecting
A further bearish move down !
Comment and subscribe to help us grow !
USDEUR trade ideas

EUR/USD (1H) – Price Compression Near Decision Zone Still ValidStill Valid cross check with my Previose Idea
🔍 Market Insight:
The pair is hovering just above a fresh bullish OB zone, after forming a Market Structure Shift (MSS) and showing signs of bearish exhaustion. The chart outlines two clean scenarios – a potential reversal into premium OB or a deeper sweep toward the SSL below.
🧠 Smart Money Concepts Applied:
🔄 MSS + Trendline Liquidity (TL)
🧱 Order Blocks (OB) marked at high accuracy
⚡ Liquidity sweep potential toward SSL
🟨 Breaker Block acting as retest trap zone
📍 Key Price Zones:
🔴 Premium OB (Supply): 1.1752 – 1.1788
🔵 Demand OB (Buy Zone): 1.1731 – 1.1713
🟨 Breaker Block: ~1.1685 – 1.1700
🟦 Major Buy POI / SSL Trap Zone: 1.1612
🔵 Day High / Day Low: 1.1788 / 1.1733
📈 Scenario A – Bullish Reversal (Purple Path):
Price taps OB @ 1.1713 → reversal expected
First target: 1.1744 Bearish Bias Zone
Second target: 1.1788 OB
✅ Confirmation needed via bullish engulfing or BOS on LTF
📉 Scenario B – Liquidity Grab + Deeper Drop (Orange Path):
If OB fails, price may dive into the Breaker Block
Rejection from there can lead to the SSL sweep @ 1.1612
⚠️ This would trap breakout buyers & sweep below liquidity before bullish re-alignment
🎯 Trade Idea (Example – Scenario A):
Buy Limit: 1.1715
SL: 1.1695
TP1: 1.1744
TP2: 1.1785
Risk-Reward: ~1:3+
✅ Suggested TradingView Caption:
EUR/USD (1H) – Waiting for Liquidity Play
Price is consolidating near OB support with potential reversal to the premium zone. Two clean scenarios: a bullish break toward 1.1788 OB, or a liquidity sweep through the breaker block and into 1.1612 SSL.
RSI cooling off, MACD showing divergence. Staying patient for confirmation.
📘 Educational idea – not financial advice.

EUR/USD neutral: Proceed with cautionHello traders
My short was short lived and not too damaging.
This powerful EUR/USD bounce is not unusual but perhaps a little bit of a head scratcher.
No economic data of note.
Maybe some positioning before the ECB rate decision?
I don't know what time this morning Senator Mike Lee(R) of Utah decided it was a good idea to repost a clearly fake resignation letter from Chairman Jerome Powell on X, so perhaps that was a factor.
Once again, Scott Bessent calmed the markets by stating that he does not see any reason for Chair Powell to resign.
The technical picture is clear. The pair has broken and closed above a long term downtrend line/channel but is at the upper boundary of the short term channel.
I have noticed several ideas and minds looking for a decline to 1.1450. The intersection of the up and downtrend lines identifies that as a possible level to go long.
However, I take it one day at a time and I am generally hesitant to make long term predictions, so use your own best judgment.
The current economic environment is rife with uncertainty, so keep the risk small. To diversify,
I have been looking for potential growth stocks to dip my toes back into the stock market.
JOBY or ACHR anyone?
Best of luck

EURUSD ~ Real Time Elliott Wave UpdatesThis is an update of a chart I had previously posted. Here, we can see that Wave 1(Red) has already completed and a pullback occurred soon after, marked as Wave 2(Red) or Wave A(Blue). This has two markings because on one hand it could be a Zigzag formation or it could be the first wave of a Flat correction. All other analysis remains the same as I had previously posted. Sentiment still remains a sell.
@fabrx900


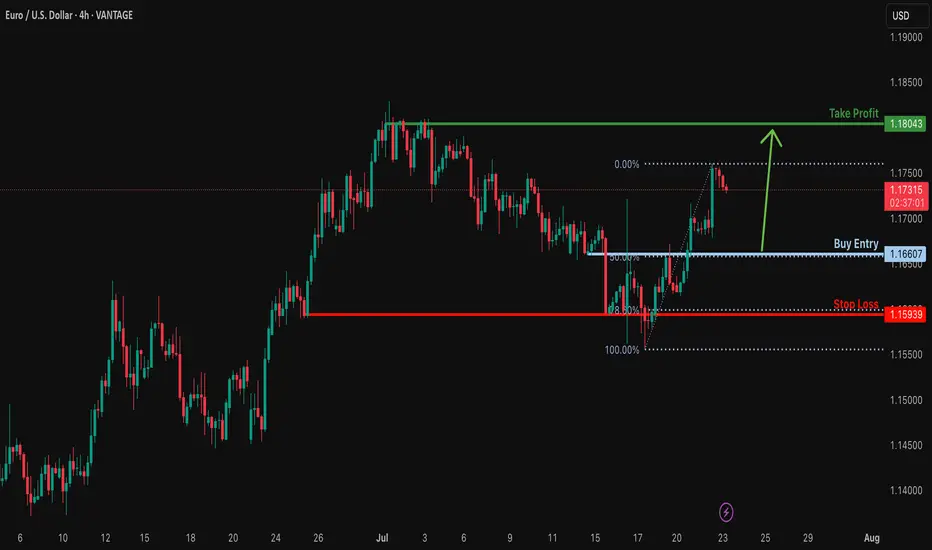
Bullish bounce?EUR/USD is falling towards the support level which is a pullback support that aligns with the 50% Fibonacci retracement and could bounce to from this level to our take profit.
Entry: 1.1660
Why we like it:
There is a pullback support that lines up with the 50% Fibonacci retracement.
Stop loss: 1.1593
Why we like it:
There is a multi swing low support that is slightly below the 78.6% Fibonacci retracement.
Take profit: 1.1813
Why we like it:
There is a swing high resistance.
Enjoying your TradingView experience? Review us!
Please be advised that the information presented on TradingView is provided to Vantage (‘Vantage Global Limited’, ‘we’) by a third-party provider (‘Everest Fortune Group’). Please be reminded that you are solely responsible for the trading decisions on your account. There is a very high degree of risk involved in trading. Any information and/or content is intended entirely for research, educational and informational purposes only and does not constitute investment or consultation advice or investment strategy. The information is not tailored to the investment needs of any specific person and therefore does not involve a consideration of any of the investment objectives, financial situation or needs of any viewer that may receive it. Kindly also note that past performance is not a reliable indicator of future results. Actual results may differ materially from those anticipated in forward-looking or past performance statements. We assume no liability as to the accuracy or completeness of any of the information and/or content provided herein and the Company cannot be held responsible for any omission, mistake nor for any loss or damage including without limitation to any loss of profit which may arise from reliance on any information supplied by Everest Fortune Group.
EURUSD: Bullish Continuation is Expected! Here is Why:
Remember that we can not, and should not impose our will on the market but rather listen to its whims and make profit by following it. And thus shall be done today on the EURUSD pair which is likely to be pushed up by the bulls so we will buy!
Disclosure: I am part of Trade Nation's Influencer program and receive a monthly fee for using their TradingView charts in my analysis.
❤️ Please, support our work with like & comment! ❤️

EUR/USD – Smart Money Playbook | 1H Analysis🔹 Current Price: 1.1735
🔹 Session Range: Day High 1.1760 | Day Low 1.1679
📊 Market Structure:
Clean bullish structure after breaking the previous range high.
Liquidity grab above Buy Side Liquidity (BSL) and forming a bear flag near premium zone.
🔍 Smart Money Concept Flow:
✅ Premium OB tapped → Distribution in progress
✅ Bear Flag forming → Potential break to downside
🔹 Re-accumulation zone aligned with 1H Order Block (OB)
🎯 If price retraces to 1.1680–1.1700 OB zone and holds → Bullish continuation likely
📈 Trade Idea:
Wait for pullback into 1H Bullish OB zone
Confirm entry via bullish reaction / iMS / FVG
Target: Sweep of Day High + Mitigation of upper OB (1.1780 zone)
⚠️ Risk Note:
This idea is based on smart money concepts (liquidity, structure, and OB logic). Always use proper risk management and confirmation before entries.

EURUSD likely to have pullbackEURUSD formed a 2 long Big bearish candles, now it is at the support level. It will pullback to fib 0.5 and then further declines from trendline resistance.

Smart Money Concepts (SMC) Strengths of the analysis:
1. Break of Structure (Choch + Bos)
A break of Structure (Bos) is clearly identified after s Choch, indicating the star of a new bearish structure.
2. OB 1H and FVG as an entry zone:
the price returns to a block order (OB-1H) within the resistance zone, which is an excellent institucional area to look for a short entry. Furthermore, the presence of a FVG on the 1H provides additional confluence.
3.Projection toward the last LL (Lower Low):
It is very accurate to project the bearish continuation toward the support zone, which coincides with the last LL, an area with a high probability of being mitigated.....

Bullish bounce off pullback support?The Fiber (EUR/USD) is falling towards the pivot, which is a pullback support and could bounce to the 1st resistance.
Pivot: 1.1537
1st Support: 1.1456
1st Resistance: 1.1655
Risk Warning:
Trading Forex and CFDs carries a high level of risk to your capital and you should only trade with money you can afford to lose. Trading Forex and CFDs may not be suitable for all investors, so please ensure that you fully understand the risks involved and seek independent advice if necessary.
Disclaimer:
The above opinions given constitute general market commentary, and do not constitute the opinion or advice of IC Markets or any form of personal or investment advice.
Any opinions, news, research, analyses, prices, other information, or links to third-party sites contained on this website are provided on an "as-is" basis, are intended only to be informative, is not an advice nor a recommendation, nor research, or a record of our trading prices, or an offer of, or solicitation for a transaction in any financial instrument and thus should not be treated as such. The information provided does not involve any specific investment objectives, financial situation and needs of any specific person who may receive it. Please be aware, that past performance is not a reliable indicator of future performance and/or results. Past Performance or Forward-looking scenarios based upon the reasonable beliefs of the third-party provider are not a guarantee of future performance. Actual results may differ materially from those anticipated in forward-looking or past performance statements. IC Markets makes no representation or warranty and assumes no liability as to the accuracy or completeness of the information provided, nor any loss arising from any investment based on a recommendation, forecast or any information supplied by any third-party.

EURUSD Massive Bullish Breakout!
HI,Traders !
#EURUSD is trading in a strong
Uptrend and the price just
Made a massive bullish
Breakout of the falling
Resistance line and the
Breakout is confirmed
So after a potential pullback
We will be expecting a
Further bullish continuation !
Comment and subscribe to help us grow !

EUR USD buy setupHello traders!
This is a possible reversal scenario. Today, we had a pump following Trump’s EU deal, which gave the market a bullish push.
However, just like every mountain climb requires a descent, I’m considering this setup as a potential correction.
⚠️ Important: Keep in mind that this trade goes against the trend! So, it's crucial to wait for a confirmed price close above the marked line before taking action.
If the setup offers a favorable risk-to-reward ratio, you may consider an instant execution. If not, you can place a buy limit order instead.
Also, keep an eye on the upcoming JOLTS Job Openings data—it could shift the market sentiment significantly.
Disclaimer: This is just an idea and not a trading signal. It’s shared for educational and backtesting purposes only. Please do your own analysis before making any trading decisions.

EURUSD –Bearish Pressure Below 1.1780 |Channel Structure HoldingEURUSD | UPDATE
The price is currently respecting the descending channel, failing to close above the pivot zone (1.1780 – 1.1750) and rejecting from the upper boundary of the structure.
Bias: Bearish While Below 1.1780
As long as price remains under the pivot zone and inside the descending channel, the bearish pressure is likely to persist. A potential correction may retest 1.1750 – 1.1730 levels before continuation.
Next Targets:
1.1700 – Minor support
1.1684 – Short-term level
1.1627 – Mid-target
1.1557 – Main support zone and channel bottom
Invalidation:
Clear breakout and H4 close above 1.1780 would invalidate the short bias and open a path toward 1.1820 and possibly 1.1882.
Structure: Bearish inside descending channel

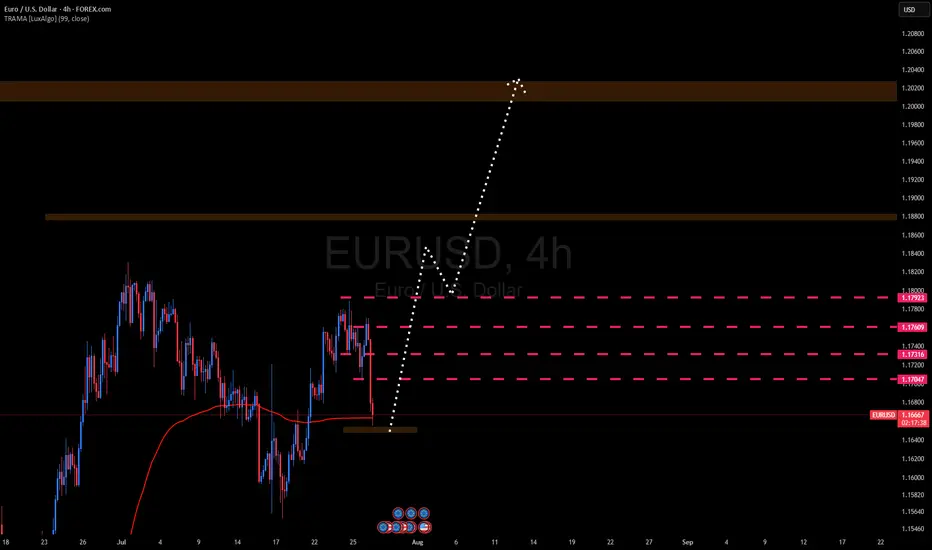
EURUSD BULLISH TREND 28-15 JUL-2025EUR/USD is expected to enter a bullish phase, with an upward move likely to start from the 1.16557–1.16486 range. The pair is projected to rise throughout the week, potentially reaching the 1.20051–1.20200 levels. As long as it continues toward that zone, the trend remains bullish
EURUSD: NEW WEEK TECHNICAL BIAS (MARKET OPEN)REVIEW SUMMARY
▪︎ On the Higher Timeframes (HTFs), the Buy-Side Bias Environment (BBE) remains intact, with no confirmed breach of the ongoing Ascend Sequence.
▪︎ However, the 4H chart reveals a developing Descend Sequence within a steep, channel-like structure, recently triggering a Rejection Block (Activated).
▪︎ If this Rejection Zone holds, I expect a potential Trend Shift that resumes the broader Ascend Sequence.
▪︎ Otherwise, a decline into the discount region near 1.16523 may unfold before any significant rally toward the primary Target Zone.
▪︎ Invalidation occurs with a structural breakdown to and below 1.15571, which opens the door toward the pending ARBs lower.
📌 This is not trade advice. Just technical observations and market perspective. Validate independently before acting.
#IntelEdgeProtocol

EURUSD wait for confirmationdaily shows a strong bullish setup reacting off a OB and an imbalance confluence while 4h shows a potential inversion that needs to occur, even on the confirmation timeframe of the Daily timeframe which for me will be 45 minutes there is no setup to be taken right now.

EURUSD BUY SETUPFOLLOW THE PRICE WILL GO UP
BECAUSE WE HAVE PATTERN ON 5 M
WE have strong candle on frame 4h

EURUSD 60/15 Pullback LongOverall strong up trend. Now under consolidate phase, then pullback, looking for long.
Possible buy zones are marked, monitor when reaching buy zones.

eur usd shortHi guys i fund this trade for the next hours, the price make a double top with divergence and the double top its confirmed, so lets go to get some money good luck

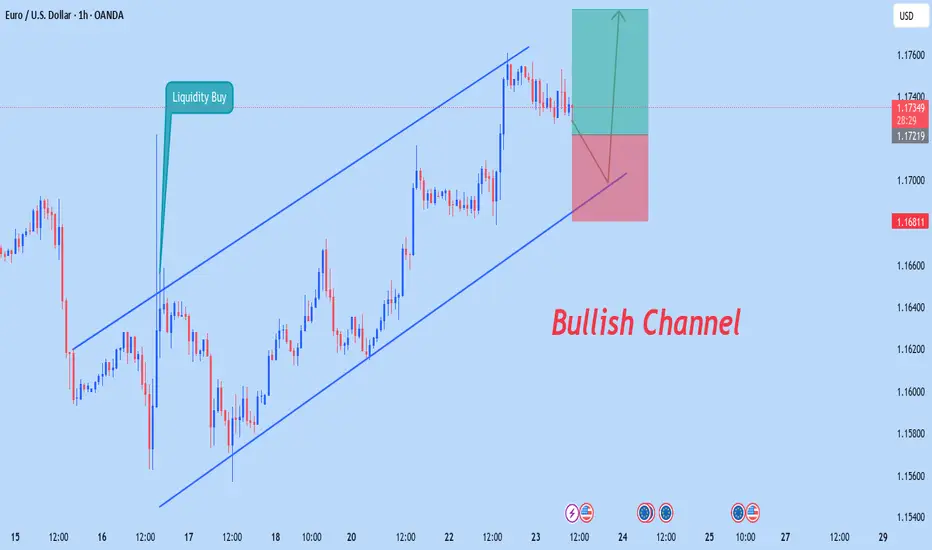
Eurusd Bullish StructureEurusd sjowing bullih channel lets try buy now @ 1.17346 with 200 pips target please follow money management use proper risk management always trade smarter not like a gambler stay grouped stay safe happy trading
EUR/USD Slips Again – Just a Pullback or More to Come?Hey everyone! Great to have you back for another market chat today.
As of writing, EUR/USD remains under significant bearish pressure, currently trading near 1.154 — marking a rather gloomy start to the new trading week. The euro is clearly struggling to attract buying interest as traders reassess the ECB’s stance and digest the newly announced EU–US trade agreement. Meanwhile, the U.S. dollar is gaining momentum, flipping the trend unexpectedly.
From a technical perspective, EUR/USD is showing clear weakness. The pair has broken below both its rising wedge and previous uptrend line, with candles closing firmly lower — a strong sign that the bears are in control.
In my personal view, I expect EUR/USD to continue sliding toward the next two support zones, although a minor pullback could occur first as part of a typical correction.
But what do you think? Is this just a dip… or the start of something bigger for EUR/USD? Let me know your take in the comments!
