eur usd shortHi guys i fund this trade for the next hours, the price make a double top with divergence and the double top its confirmed, so lets go to get some money good luck
USDEUR trade ideas

Why I Think EURUSD Will Sell This Week...Technical AnalysisHey Rich Friends,
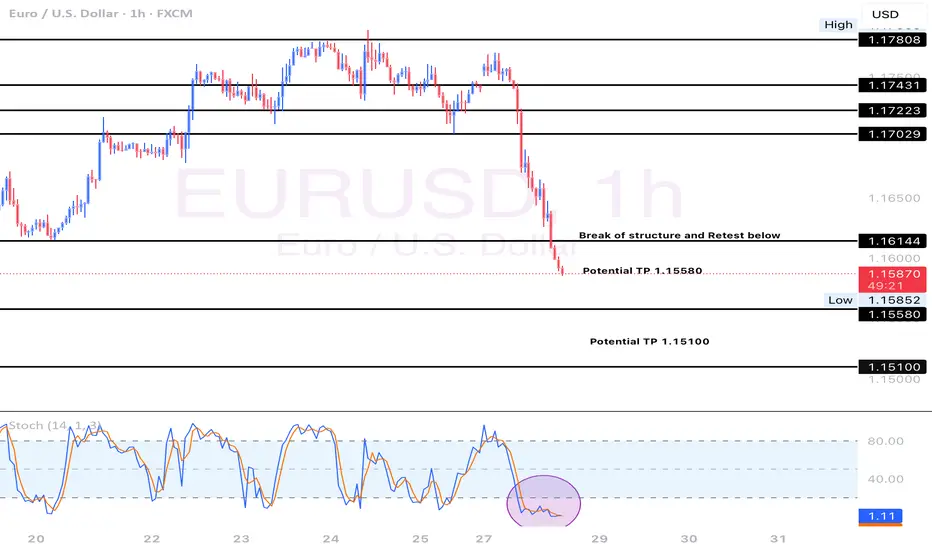
Happy Monday. I think EURUSD will continue to sell this week. This is only my technical analysis so please check the news and cross reference any indicators you have on your own chart. Here is what I am looking at:
- There has been a break of structure to the downside on H4 signaling that price may continue to drop lower.
- After the break of structure, price opened lower and continued to sell.
- Momentum has been picking up for the sellers over the last 12 hours.
- The stochastic is oversold. The slow line (orange) is above the fast line (blue) and one or both lines are below 20.
These are all strong bearish confirmations for me so I will be selling. I took market execution order but I also have sell stops and TPs at previous lows. My SL will be a previous high.
Only take trades that make sense to you, but I hope the market is in our favor this week. Let me know what you think about this idea below.
Peace and Profits,
Cha
Eurousd techinical analysis.Eurousd techinical analysis next move posibale at h1 time frame not finchinal advice.

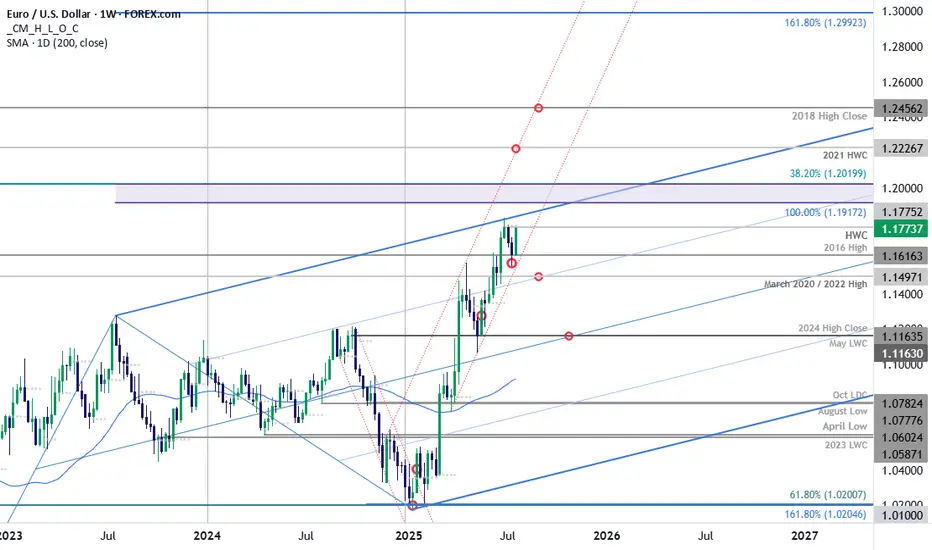
EUR/USD Surges into Resistance Ahead of ECBEuro is poised to snap a two-week losing streak with EUR/USD up more than 1.2% since the Sunday open. The advance takes price back into weekly resistance ahead of tomorrow’s European Central Bank rate decision and the focus now shifts to the weekly close for guidance.
Euro plunged more than 2.3% off the June high with price briefly registering an intraweek low at 1.1557 before rebounding. The rally takes EUR/USD into resistance at the objective high-week close (HWC) / high-close at 1.1775- looking for a reaction off this mark with a weekly close above needed to keep the immediate advance viable into the close of the month.
Initial weekly support remains with the 2016 swing high at 1.1616 with the medium-term outlook still constructive while above the March trendline (red). Ultimately, a break below the 2020 / 2022 highs at 1.1497 would be needed to suggest a more significant high is in place / a larger correction is underway with subsequent support seen at the 2024 high close / May low-week close (LWC) at 1.1164.
A breach / close above this pivot zone exposes the upper parallel (blue), currently near 1.1840s, with the next major technical consideration eyed at 1.1917-1.2020- a region defined by the 100% extension of the 2022 advance and the 38.2% retracement of the 2008 decline (area of interest for possible top-side exhaustion / price inflection IF reached). Subsequent resistance objectives eyed at the 2021 HWC at 1.2227 and the 2018 high-close at 1.2456.
Bottom line: Euro rebounded just ahead of the March uptrend with the rally now testing the yearly high-close ahead of the ECB- watch the Friday close with respect to 1.1775. From a trading standpoint, a good zone to reduce portions of long-exposure / raise protective stops- losses would need to be limited to this week’s low IF price is heading higher on this stretch with a close above the upper parallel still needed to fuel the next major leg of the advance.
-MB
A TEST OF THE PREVIOUS BROKEN STRUCTURE From the daily time frame, we can see that EURUSD has broken a structure which was acting as previous resistance turned support, which is indicated with a blue rectangle.
I'm anticipating the broken support to turn to resistance when the price action retraces from somewhere at the demand zone which is indicated with a red rectangle.
So let's have in back of our mind that price will need to retrace from the low to retest the broken structure and turn into resistance and then after continue to the downside.
......................,.................,......................
Please share your thoughts,what do you think,will EURUSD move downwards or will it be buy the dip and continue with its uptrend.


EUR/USD Robbery Blueprint Bear Strike Activated!💣🎯Operation Fiber Down: EUR/USD Robbery Blueprint (Day Trade Edition) 💰🔫
🚨 Thieves, Hustlers & Chart Bandits Assemble! 🚨
🌍 Hi! Hola! Ola! Bonjour! Hallo! Marhaba! 🌍
Welcome back to another Thief Trading Operation, where the money never sleeps—and neither do we. Let’s break into the vault of EUR/USD “The Fiber” with surgical precision. 🧠💼🕶️
🧨 THE MASTER ROBBERY PLAN: EUR/USD SHORT STRIKE 🔍💸
💀 Market Bias: Bearish – Trend Reversal + Supply Trap Setup
🎯 Target: 1.14600
🛑 Stop-Loss: Near Swing High (around 1.16700 – 4H chart view)
🕓 Timeframe Focus: 15m / 30m / 3H
🧭 ENTRY ZONE:
👣 Plan your entry from recent high retests—that’s where the big money bulls get trapped.
🎯 Use Sell Limit Orders (DCA style / Layered Limit Orders) like a true thief setting up tripwires.
💼 RISK STRATEGY:
💡 SL should match your lot size and order count—not one-size-fits-all!
📌 Place above key structure or swing level (e.g. 1.16700) based on timeframe.
🔍 BEHIND THE SCENES – THE WHY:
The EUR/USD "Fiber" pair is showing all the classic signs of a trend shift and bear raid setup, including:
📰 Fundamentals weakening the Euro
💣 COT Report reveals institutional exits
🍂 Seasonal Bias points to downward trend
📉 Intermarket Pressure from bond yields & USD strength
📊 Sentiment turning overly bullish = trap zone
⛽ Storage & Inventory imbalances adding fuel
📌 Reminder: Before any robbery, study the layout—Macro, Fundamentals, Sentiment, and Intermarket are your blueprint.
🚨 HEIST ALERT – PROTECT THE LOOT:
🕰️ High-Impact News Events? Tighten up!
💼 Don’t take fresh entries during releases.
🔐 Use Trailing SLs to lock in profits.
🎯 Exit with grace before the sirens start.
⚡🔥JOIN THE CREW, BOOST THE LOOT🔥⚡
💥 Smash the Boost Button 💥 if you're vibing with the Thief Trading Movement.
We ain’t just trading—we’re executing strategic robberies on the market’s weaknesses.
🧠💪 Every like = more power to the crew. Every comment = a new map to a vault.
We rob, retreat, and repeat. Let’s make money with skill, not luck. 🕶️💰🚁
⚠️ LEGAL COVER (For the Lawyers 😏):
This plan is not investment advice, just an organized heist blueprint by chart robbers.
Always manage your own risk and update your plan as the market evolves.
🕶️ Stay ready for the next master plan... Until then, keep your charts clean and your stops tight. 🕶️💣📉
– Thief Trader Out 🐱👤🚀

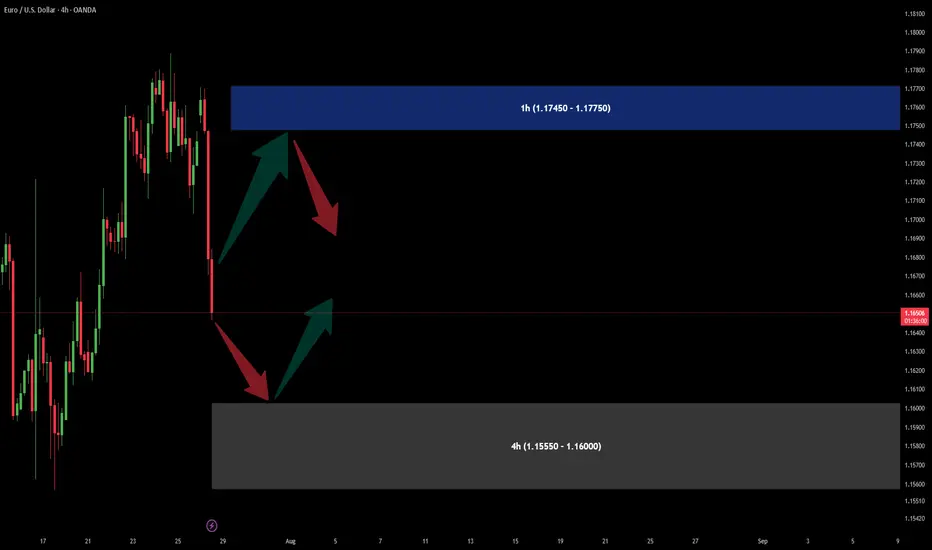
A Sell & A Buy OFFER for EURUSDThere is a Demand area in 4h time frame near (1.15550 - 1.16000) and a good support area in (1.17450 - 1.17750) zone.
S/L would be under (over in sell) zones which I have specified.
EURUSD End July BearsEURUSD will short this week and continue selling into AUGUST. A double top pattern on the daily chart confirms this trade. We sell from Wednesday.

EURUSD | 4H Chart | New York Session Sellers in Play 📉 EURUSD | 4H Chart | New York Session Sellers in Play 🇺🇸
🟥 Red Zone Rejection – clarity
As the New York session unfolds, sellers are stepping in at a premium supply zone — classic reaction near 1.1763–1.1812.
🔻 Current Structure:
Rising wedge formation tapped into prior supply zone
Price kissed the upper wedge and reacted — sellers triggering from the red zone
NY session = high liquidity = aggressive positioning by institutions
🎯 Potential Bearish Targets:
1️⃣ 1.1712 – Minor structure support
2️⃣ 1.1670 – Trendline + liquidity sweep
3️⃣ 1.1582 – Major bullish invalidation (optional swing target)
🧠 Smart Money Note:
This is where liquidity is grabbed before reversal
Risk-to-reward favors downside short-term as long as price stays below 1.1812
📌 Bias: Tactical Short
🎯 Reaction + Rejection = Execution
🎩

EURUSD : What the D saysWhile Buyer may have taken control, it would not be wise to BUY now, as it is too late.
Price is also at the D and resistance @ 1.1790 - Going by the D, a Sell now is possible with SL @ 1.1790/5
We should know very soon if/when the Seller tries to do something.
Good luck.

Educational EUR/USD Chart Breakdown – Price Action at Key LevelsEducational EUR/USD Chart Breakdown – Price Action at Key Levels
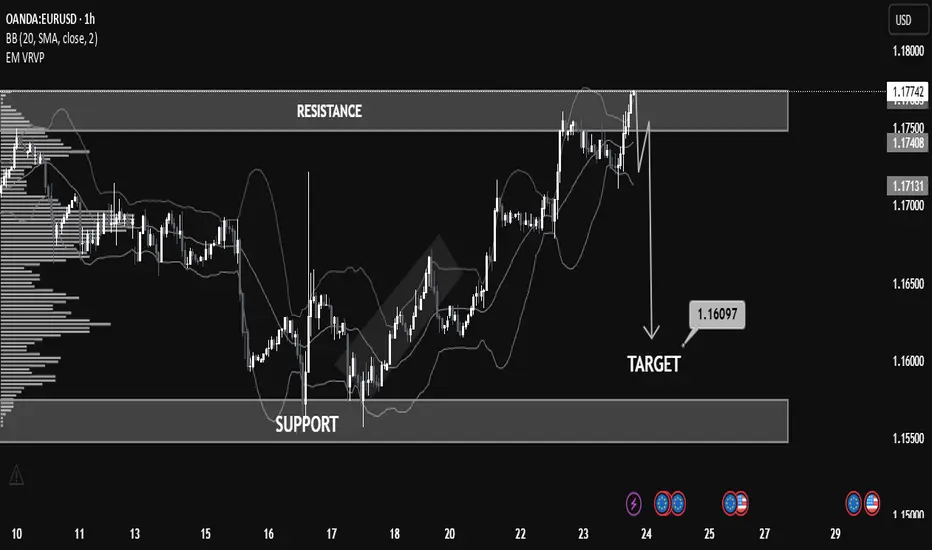
This EUR/USD (1-hour) chart provides a great example of how support and resistance zones, combined with price action and indicators like Bollinger Bands, can help anticipate market moves.
🔹 Resistance Zone Tested:
The pair recently approached the 1.17500–1.17800 resistance zone. This level had previously acted as a supply zone, and price once again showed rejection here, indicating selling pressure.
🔹 Bollinger Band Overextension:
Notice how the price extended beyond the upper Bollinger Band—this often signals that the market is overbought in the short term, leading to a potential reversal or correction.
🔹 Bearish Reaction & Target:
After rejection from resistance, the chart outlines a bearish move with a target at 1.16097. This level lies just above the next strong support zone (1.15500–1.16100), offering a realistic area for price to stabilize if the downtrend continues.
🔹 What to Learn:
Support & Resistance: Prices often react at key zones; previous resistance can turn into support and vice versa.
Confluence Tools: Use indicators like Bollinger Bands with price structure to increase confidence.
Target Planning: Identify likely reaction zones for risk management and profit-taking.
📚 Summary
This setup is a clean example of trading within a range and using technical confluence to plan entries and exits. If price breaks below 1.17130 with strong momentum, the probability increases for the market to reach the 1.16097 target.
EURUSD – DAILY FORECAST Q3 | W31 | D30 | Y25📊 EURUSD – DAILY FORECAST
Q3 | W31 | D30 | Y25
Daily Forecast 🔍📅
Here’s a short diagnosis of the current chart setup 🧠📈
Higher time frame order blocks have been identified — these are our patient points of interest 🎯🧭.
It’s crucial to wait for a confirmed break of structure 🧱✅ before forming a directional bias.
This keeps us disciplined and aligned with what price action is truly telling us.
📈 Risk Management Protocols
🔑 Core principles:
Max 1% risk per trade
Only execute at pre-identified levels
Use alerts, not emotion
Stick to your RR plan — minimum 1:2
🧠 You’re not paid for how many trades you take, you’re paid for how well you manage risk.
🧠 Weekly FRGNT Insight
"Trade what the market gives, not what your ego wants."
Stay mechanical. Stay focused. Let the probabilities work.
FX:EURUSD

Bullish reversal off pullback support?The Fiber (EUR/USD) has bounced off the pivot, which is a pullback support, and could rise to the 1st resistance, which is a pullback resistance.
Pivot: 1.1537
1st Support: 1.1456
1st Resistance: 1.1659
Risk Warning:
Trading Forex and CFDs carries a high level of risk to your capital and you should only trade with money you can afford to lose. Trading Forex and CFDs may not be suitable for all investors, so please ensure that you fully understand the risks involved and seek independent advice if necessary.
Disclaimer:
The above opinions given constitute general market commentary, and do not constitute the opinion or advice of IC Markets or any form of personal or investment advice.
Any opinions, news, research, analyses, prices, other information, or links to third-party sites contained on this website are provided on an "as-is" basis, are intended only to be informative, is not an advice nor a recommendation, nor research, or a record of our trading prices, or an offer of, or solicitation for a transaction in any financial instrument and thus should not be treated as such. The information provided does not involve any specific investment objectives, financial situation and needs of any specific person who may receive it. Please be aware, that past performance is not a reliable indicator of future performance and/or results. Past Performance or Forward-looking scenarios based upon the reasonable beliefs of the third-party provider are not a guarantee of future performance. Actual results may differ materially from those anticipated in forward-looking or past performance statements. IC Markets makes no representation or warranty and assumes no liability as to the accuracy or completeness of the information provided, nor any loss arising from any investment based on a recommendation, forecast or any information supplied by any third-party.


long position sighted on EURUSDEUR/USD – Price Approaching Key Demand Zone | 4H SMC Analysis
Pair: EUR/USD
Timeframe: 4H (4Hour)
Bias: Bullish Reversal Watch at Demand
Strategy: Smart Money Concepts (SMC)
Status: Monitoring price action at demand for possible long setup.
Market Structure Overview
The EUR/USD pair recently showed a bearish shift in structure after failing to hold the bullish trend that began mid-June.
* Initial bullish structure is visible with a clear Break of Structure (BOS) to the upside.
* The rally created a Fair Value Gap (FVG) and left behind a well-defined Demand Zone.
* After the BOS, price retraced and respected the demand before making new highs.
* Eventually, price failed to make a new high and started forming lower highs and lower lows, shifting momentum bearish.
Current Price Action
* Price has aggressively dropped from the previous supply area (highlighted in red) and is now approaching a key demand zone around 1.1485–1.1447.
* This zone coincides with:
* A previous FVG fill area.
* The base of the last strong impulsive move up.
* Consolidation and accumulation structure before the bullish breakout.
Key Zones
* Demand Zone: 1.1485 – 1.1447
* This zone represents an institutional buying area.
* Looking for potential bullish reaction from here.
* Supply Zone: Around 1.1818 – 1.1834
* Last zone of distribution before price dropped.
Possible Scenarios
Bullish Reversal
* Price shows rejection candles, internal bullish BOS, or engulfing pattern within demand.
* A long entry could be considered with:
* Stop Loss just below demand zone.
* Targets: Previous highs at 1.1726 and 1.1818.
Bearish Continuation
* If price breaks and closes below the demand, it invalidates the bullish idea.
* Expect continued bearish pressure toward 1.1400 or lower.
* Look for a potential retest of broken demand as new supply.
SMC Concepts in Use
* BOS (Break of Structure): Used to identify market shifts.
* FVG (Fair Value Gap): Spotting inefficiencies to anticipate retracements.
* Demand Zone: Watching for institutional buying and smart money footprints.
Trade Plan Summary
| Element | Value |
| Entry | Upon bullish confirmation in demand |
| Stop Loss | Below 1.1447 (zone invalidation) |
| Target 1 | 1.17265 |
| Target 2 | 1.18182 |
| Invalidated if | Price closes below demand zone |
Conclusion
We’re at a make or break level for EUR/USD. Price is testing a major demand zone with confluence from structure, FVG, and past bullish movement. Watching for reaction before taking action. Risk managed entries only.

EURUSD Breakdown Bearish Trend Continues or Demand Zone Reversal🔍 Chart Breakdown: EUR/USD (30-min TF)
Trend Overview:
Previous Trend: Bullish channel structure (highlighted in blue).
Current Momentum: Strong bearish breakdown following a clear range phase.
The chart shifted from consolidation → breakdown → aggressive bearish continuation.
🧱 Key Technical Highlights:
1. Bearish Breakout:
Price broke below the ascending trendline and exited the ranging box, confirming a bearish shift.
Multiple Breakdown Retests (highlighted with red arrows) confirming structure failures and validating resistance zones.
2. Range Zone (Distribution Phase):
Price moved sideways within the green rectangle (“RANGE”), indicating accumulation/distribution before the selloff.
The breakdown from this range confirmed bearish momentum.
3. Demand Zone Test (Now in Play):
Price is approaching/hovering around a demand zone (green box) marked as a critical support.
Buyers may react here, offering two key scenarios:
Bounce back to retest resistance around 1.1600 (highlighted).
Breakdown below demand, leading to further decline toward next major support zones (1.15354 and 1.15040).
4. Price Reaction Zones:
🔴 Resistance zones are clearly marked where breakdown retests occurred.
🟢 Demand zone with bounce-or-break logic provides directional bias.
🧭 Potential Scenarios (Marked on Chart):
✅ Bullish Case:
If demand zone holds, expect:
A corrective rally toward 1.1600–1.1620.
Watch for rejection signals here (could be ideal for re-entering shorts).
❌ Bearish Case:
If breakdown below green demand zone occurs, targets:
1.1535 (local structure support)
1.1504 (next confluence level; possible long-term bounce area)
📈 Indicators:
Ichimoku Cloud: Price is well below the cloud, confirming bearish control.
Structure: Lower highs & lower lows = confirmed bearish trend.

EURUSD H1 I Bullish Bounce Off Based on the H4 chart analysis, we can see that the price is testing our buy entry at 1.15782, which is a swing low support.
Our take profit will be at 1.1629, which is a pullback resistance level.
The stop loss will be placed at 1.1547, below the swing low support.
High Risk Investment Warning
Trading Forex/CFDs on margin carries a high level of risk and may not be suitable for all investors. Leverage can work against you.
Stratos Markets Limited (tradu.com ):
CFDs are complex instruments and come with a high risk of losing money rapidly due to leverage. 65% of retail investor accounts lose money when trading CFDs with this provider. You should consider whether you understand how CFDs work and whether you can afford to take the high risk of losing your money.
Stratos Europe Ltd (tradu.com ):
CFDs are complex instruments and come with a high risk of losing money rapidly due to leverage. 66% of retail investor accounts lose money when trading CFDs with this provider. You should consider whether you understand how CFDs work and whether you can afford to take the high risk of losing your money.
Stratos Global LLC (tradu.com ):
Losses can exceed deposits.
Please be advised that the information presented on TradingView is provided to Tradu (‘Company’, ‘we’) by a third-party provider (‘TFA Global Pte Ltd’). Please be reminded that you are solely responsible for the trading decisions on your account. There is a very high degree of risk involved in trading. Any information and/or content is intended entirely for research, educational and informational purposes only and does not constitute investment or consultation advice or investment strategy. The information is not tailored to the investment needs of any specific person and therefore does not involve a consideration of any of the investment objectives, financial situation or needs of any viewer that may receive it. Kindly also note that past performance is not a reliable indicator of future results. Actual results may differ materially from those anticipated in forward-looking or past performance statements. We assume no liability as to the accuracy or completeness of any of the information and/or content provided herein and the Company cannot be held responsible for any omission, mistake nor for any loss or damage including without limitation to any loss of profit which may arise from reliance on any information supplied by TFA Global Pte Ltd.
The speaker(s) is neither an employee, agent nor representative of Tradu and is therefore acting independently. The opinions given are their own, constitute general market commentary, and do not constitute the opinion or advice of Tradu or any form of personal or investment advice. Tradu neither endorses nor guarantees offerings of third-party speakers, nor is Tradu responsible for the content, veracity or opinions of third-party speakers, presenters or participants.

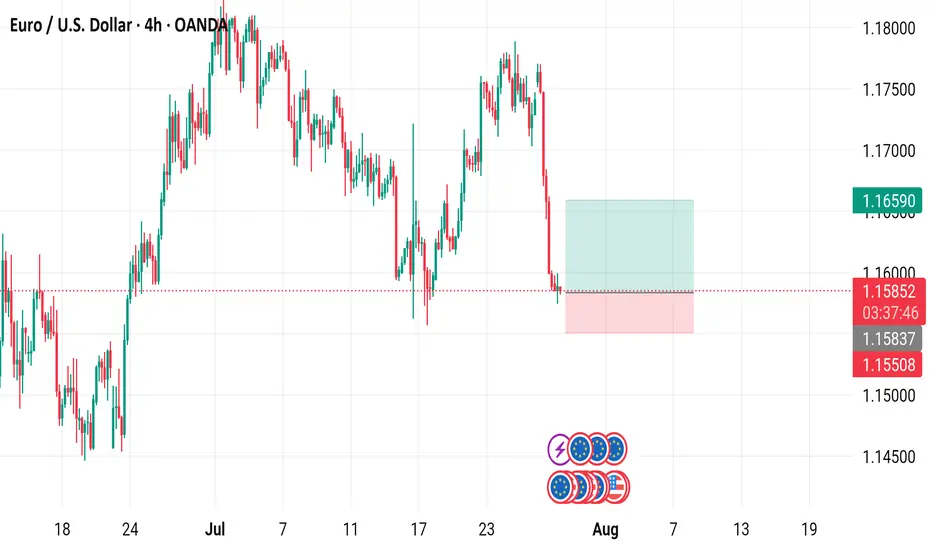
EUR/USD 4-Hour Chart Analysis4-hour performance of the Euro/U.S. Dollar (EUR/USD) currency pair, showing a recent decline from a high of 1.15853 to 1.15845, with a -0.04% change. Key levels include a "Buy" signal at 1.5 and a "Sell" signal at 1.15838. The chart highlights a significant drop with a shaded support zone around 1.16590 to 1.15845, indicating potential trading opportunities or resistance levels as of July 29, 2025.
Bullish EURUSD Reversal / Long Opportunity (4H Chart)Support Zone (~1.1650–1.1610)
The price has tapped into a clear demand zone, which was respected previously during a strong bullish impulse.
Current candle shows signs of exhaustion in bearish momentum, hinting at a potential reversal.
Market Structure:
Despite the recent retracement, higher lows remain intact when viewed in a broader context.
The price may be completing a corrective wave within an overall bullish market structure.
Liquidity & Trap Mechanics:
The wick sweep toward 1.1610 likely triggered sell-side liquidity, setting the stage for a buy-side reversal.
This area is often where institutions accumulate long positions under the guise of bearish continuation.

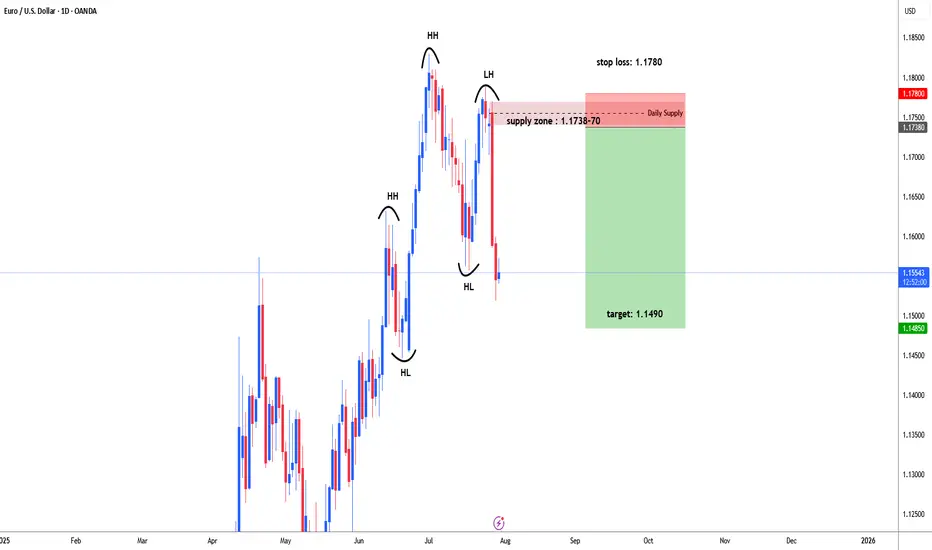
EURUSD possible bearish for 1.1490#EURUSD failed to form higher high and higher low to continue bullish trend. eurusd made a high on 1st July 1.1830, then price started retrace downside. 7th July daily bearish engulfing candle formed , early indication for selling. 23rd July price moved up side to test supply zone. Price did not break high of bearish engulfing candle and fall back. Price started heavily fall and broke recent supply level 1.1557 and form Lower High that is indication for trend reversal.
1.1738-70 ideal level for selling which is daily supply zone. stop loss above 1.1770 i.e. 1780-1.1800. target: 1.1490 and even may expect further down.
EURUSD | H4 Bullish bounce offBased on the H4 chart analysis, the price is reacting off the support level, which is a pullback support, and could rise higher.
Buy entry is at 1.1535, which is a pullback support.
Stop loss is at 1.1453, which is an overlap support that is underneath the 138.2% Fibonacci extension.
Take profit is at 1.1616, which is a pullback resistance that aligns with the 38.2% Fibonacci retracement.
High Risk Investment Warning
Trading Forex/CFDs on margin carries a high level of risk and may not be suitable for all investors. Leverage can work against you.
Stratos Markets Limited (tradu.com ):
CFDs are complex instruments and come with a high risk of losing money rapidly due to leverage. 65% of retail investor accounts lose money when trading CFDs with this provider. You should consider whether you understand how CFDs work and whether you can afford to take the high risk of losing your money.
Stratos Europe Ltd (tradu.com ):
CFDs are complex instruments and come with a high risk of losing money rapidly due to leverage. 66% of retail investor accounts lose money when trading CFDs with this provider. You should consider whether you understand how CFDs work and whether you can afford to take the high risk of losing your money.
Stratos Global LLC (tradu.com ):
Losses can exceed deposits.
Please be advised that the information presented on TradingView is provided to Tradu (‘Company’, ‘we’) by a third-party provider (‘TFA Global Pte Ltd’). Please be reminded that you are solely responsible for the trading decisions on your account. There is a very high degree of risk involved in trading. Any information and/or content is intended entirely for research, educational and informational purposes only and does not constitute investment or consultation advice or investment strategy. The information is not tailored to the investment needs of any specific person and therefore does not involve a consideration of any of the investment objectives, financial situation or needs of any viewer that may receive it. Kindly also note that past performance is not a reliable indicator of future results. Actual results may differ materially from those anticipated in forward-looking or past performance statements. We assume no liability as to the accuracy or completeness of any of the information and/or content provided herein and the Company cannot be held responsible for any omission, mistake nor for any loss or damage including without limitation to any loss of profit which may arise from reliance on any information supplied by TFA Global Pte Ltd.
The speaker(s) is neither an employee, agent nor representative of Tradu and is therefore acting independently. The opinions given are their own, constitute general market commentary, and do not constitute the opinion or advice of Tradu or any form of personal or investment advice. Tradu neither endorses nor guarantees offerings of third-party speakers, nor is Tradu responsible for the content, veracity or opinions of third-party speakers, presenters or participants.

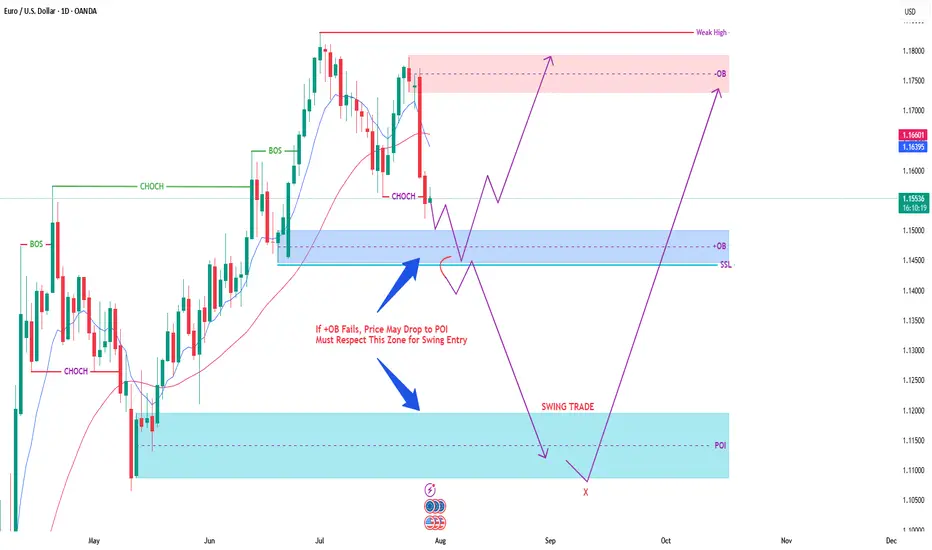
EUR/USD – High Timeframe Swing Setup Daily Chart AnalysisSmart Money structure is in play with a clear CHoCH and liquidity shifts. We’re tracking a potential swing trade setup based on key OB and POI levels:
🔹 CHoCH & BOS Confirmed: Market has shifted into possible bearish retracement
🔹 Price is approaching a Mid OB Zone – if respected, bullish continuation likely
🔹 If OB fails, next target is deep POI zone for a major liquidity grab and swing reversal
📌 Scenarios:
1️⃣ Respect Mid OB → Quick bullish continuation to 1.17500+
2️⃣ Failure at OB → Deeper fall toward 1.11500 POI zone before massive reversal
🧠 POI Zone = Key for Swing Entries
📍 SSL below OB adds confluence for liquidity sweep
🎯 Targets:
• Short-Term: 1.16500–1.17500
• Long-Term: 1.18500+
📉 Invalidation: Clean break below POI (1.1100 area)