EUR/USD (Euro / U.S. Dollar) 2-hour chart analysis.EUR/USD (Euro / U.S. Dollar) 2-hour chart analysis, here's the breakdown:
---
📈 Chart Setup Observations:
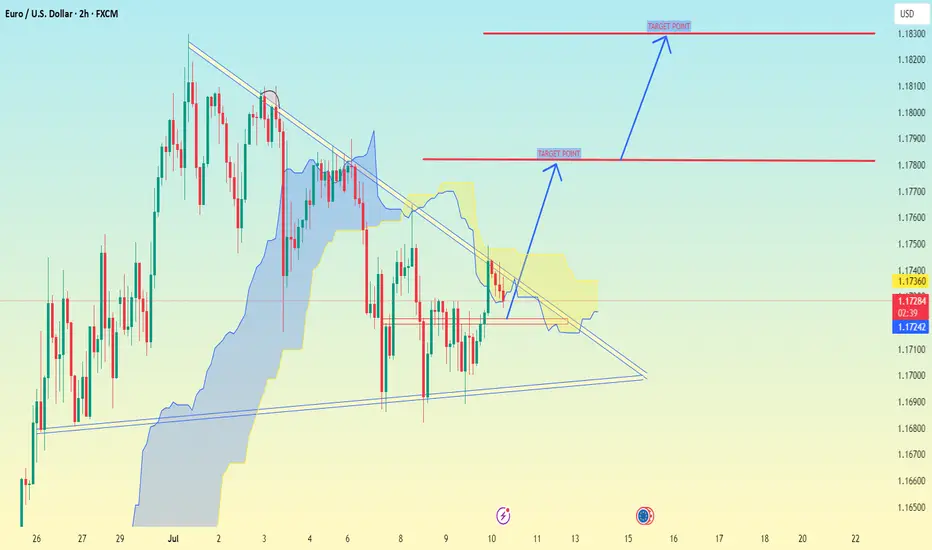
The pair is showing a bullish breakout from a descending triangle or falling wedge pattern.
Price is above the Ichimoku Cloud, suggesting a potential shift to bullish momentum.
There are two clearly marked target points on your chart.
---
🎯 Target Levels:
1. Target Point 1 (TP1): Approximately 1.78000
2. Target Point 2 (TP2): Approximately 1.18300
---
🔰 Support Zone / Potential Stop-Loss:
Around 1.17200, where recent consolidation and trendline support can be seen.
---
✅ Summary:
If the bullish breakout holds and momentum continues, the pair could reach:
TP1: ~1.78000 (short-term target)
TP2: ~1.18300 (medium-term target)
USDEUR trade ideas
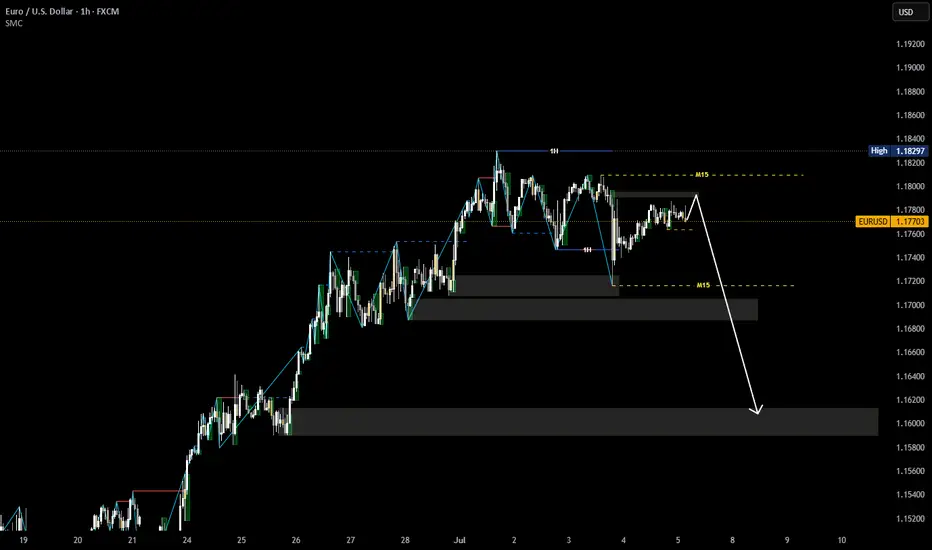
EURUSD OUTLOOK 15 - 18 JULYCore CPI m/m came in light which gave a mixed signal at first but CPI y/y was higher than expected which eventually moved EU lower.
The last two analysis that I posted were more longer term focused so this time I will be giving a more short term outlook.
Currently the dollar is stronger based on the recent news that has been coming out and because of that I am still looking to short this pair keeping in mind that it is only the internal structure that is bearish and the swing structure is still bullish

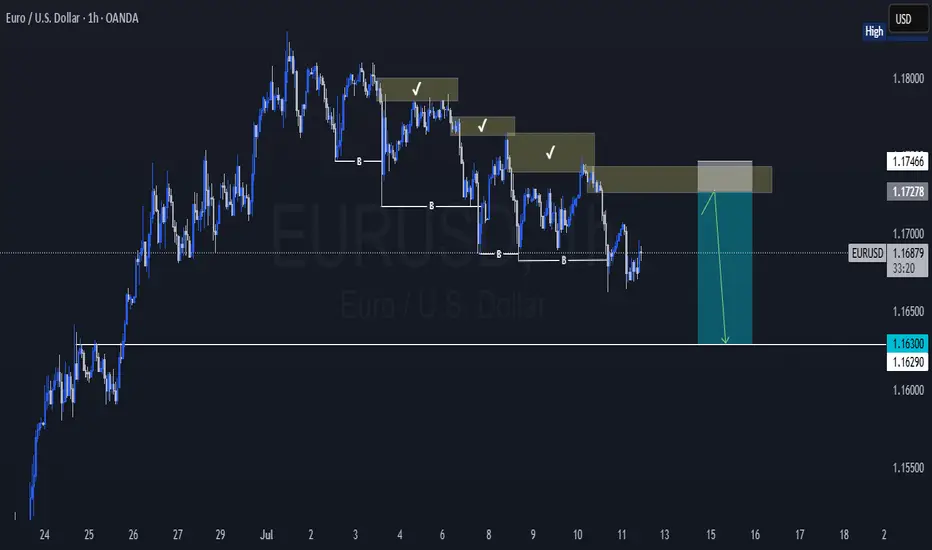
EURUSD COT and Liquidity AnalysisHey what up traders welcome to the COT data and Liquidity report. It's always good to go with those who move the market here is what I see in their cards. I share my COT - order flow views every weekend.
🎯 Non Commercials added significant longs which creates a strong support, we will most likely see higher prices over time.
📍Please be aware that institutions report data to the SEC on Tuesdays and data are reported on Fridays - so again we as retail traders have disadvantage, but there is possibility to read between the lines. Remember in the report is what they want you to see, that's why mostly price reverse on Wednesday after the report so their cards are hidden as long as possible. However if the trend is running you can read it and use for your advantage.
💊 Tip
if the level has confluence with the high volume on COT it can be strong support / Resistance.
👍 Hit like if you find this analysis helpful, and don't hesitate to comment with your opinions, charts or any questions.
Analysis done on the Tradenation Charts
Disclosure: I am part of Trade Nation's Influencer program and receive a monthly fee for using their TradingView charts in my analysis.
"Adapt what is useful, reject what is useless, and add what is specifically your own."
— David Perk aka Dave FX Hunter ⚔️

EURusd long position 14/07/2025English : According to our analysis, we anticipate a bullish scenario.
Morocan Darija : kanchofo d'apres l'analyse dyalna antsanaw tlooo3
ATENTION : I only share my ideas, not signals

EURUSD Short ProjectDescription:
1. Price Drivers: smart money distribution
2. Current Trend: down
3. Momentum: confirmed bearish
Action: Waiting for entry on the intraday timeframe (Entry will be published further)
*Disclaimer: I will not accept liability for any loss or damage, including without limitation to any loss of profit, which may arise directly or indirectly from use of or reliance on such information.

EURUSD structure analysis on M15 and H1- 4H swing is bullish, currently is pullback
- 1H, M15 swing is bearish, current is pullback.
- We can look for selling opportunities according to the wave configuration of H1 and M15 timeframes
EURUSD Bearish IdeaAs you can see, EURUSD is in a small retracement of its uptrend, and in this retracement, it is constantly mitigating the supply zones. Therefore, in this current idea, we will wait for the price to reach the supply zone, if it gives confirmation, execute the sell order, and our target is the HTF demand zone.
eur/usd 07.07The information and publications are not meant to be, and do not constitute, financial, investment, trading, or other types of advice or recommendations.
Have a nice evening ahead.

EURUSD Bullish Continuation OutlookFX:EURUSD has been trading in a bullish trend. Currently price is retesting the previous resistance level, as well as 0.618 fib. Hidden bullish divergence can be observed on the chart, in addition to regular bullish divergence on lower timeframes (1 & 4 hour).
I am expecting bullish continuation from here to complete the price projections!

EURusd short position 16/07/2025English : According to our analysis, we anticipate a bearish scenario.
Morocan Darija : kanchofo d'apres l'analyse dyalna antsanaw hboot
ATENTION : I only share my ideas, not signals

EUR/USD long: Save the dateHello traders
I have entered into a long position at 1.1665.
The charts show a base being built right around that level.
DXY is ticking down but US 10Y yield is steady.
Bitcoin at an all time high is in my opinion not a sign of risk on but rather USD liquidation in favor of BTC.
Gold has just broken above the last daily high.
There are rumors making the rounds that FOMC Powell is considering resigning which will be negative for the USD. Keep in mind, Jerome Powell is the spokesperson for the FOMC, not the only voting member.
7/30/2025
FOMC rate decision
7/31/2025
The Federal Appeals Court starts hearing arguments for the use of IEEPA to impose sweeping tariffs that was declared unlawful by the Court of International Trade located in Manhattan, NY.
August 2025
More threatened tariffs may start.
Things are heating up.
Best of luck.

EURUSD Bearish Sentiments Below LowEURUSD looks bearish at H1 for a bias of 1.15377. It's an unusual price action; the overall trend in a higher time frame is bullish, but the 1.1700 had strong bearish pressure.
The current momentum is bearish below 1.16625, making that level a key area zone.
Happy Trading,
K.

EUR USD longcan be a short term possibility and maybe not let see , today market is so unstructured from yesterday news lets experience ...
Please note: This is for educational purposes only and not a trading signal. These ideas are shared purely for back testing and to exchange views. The goal is to inspire ideas and encourage discussion. If you notice anything wrong, feel free to share your thoughts. In the end, to learn is to share !

Bearish Momentum Builds Below Broken Support
Hello everybody!
Price is in a strong bearish trend and has broken a support area, which we now expect to act as resistance.
The break of the upward trendline adds a second confirmation to take a short position.
The target is around 1.14990.
The stop loss is placed beyond the downward trendline and will be trailed along with it.
If the downward trendline is broken, the short position will be invalidated.

EURUSD Short re entry, 14 JulyHTF Downtrend with Clean LTF Setup
Bias remains bearish with HTF downtrend, W imbalance resting above, and 4H 50EMA close to our zone.
📉 Confluence:
Textbook LTF structure, expecting LH → LL
DXY reacting from 15m POI + Asia low to fill
15m Extreme OB + 5m OB as entry zone
Clean 1m BOS confirming sellers stepping in → add another 50%
🎯 Entry: 50% tap of 5m OB after 1m BOS
🛡️ SL: Above LH structure
📌 TP: At least 1:3 RR down to Asia low
⚠️ Minor risk with W imbalance above, but strong trend and confirmations to support the trade.
3 hours ago
Trade active
We got an 1mBOS from the 15m POI
Got 2 entry points now : The one from the 5m OB marked out on the photo and one at the lower 5m that created the break. Will see what happens

EURUSD Short, 14 JulyHTF Downtrend with Clean LTF Setup
Bias remains bearish with HTF downtrend, W imbalance resting above, and 4H 50EMA close to our zone.
📉 Confluence:
Textbook LTF structure, expecting LH → LL
DXY reacting from 15m POI + Asia low to fill
15m Extreme OB + 5m OB as entry zone
Clean 1m BOS confirming sellers stepping in → add another 50%
🎯 Entry: 50% tap of 5m OB after 1m BOS
🛡️ SL: Above LH structure
📌 TP: At least 1:3 RR down to Asia low
⚠️ Minor risk with W imbalance above, but strong trend and confirmations to support the trade.

EURUSD Will Go Lower! Sell!
Here is our detailed technical review for EURUSD.
Time Frame: 4h
Current Trend: Bearish
Sentiment: Overbought (based on 7-period RSI)
Forecast: Bearish
The market is approaching a significant resistance area 1.168.
Due to the fact that we see a positive bearish reaction from the underlined area, I strongly believe that sellers will manage to push the price all the way down to 1.159 level.
P.S
Please, note that an oversold/overbought condition can last for a long time, and therefore being oversold/overbought doesn't mean a price rally will come soon, or at all.
Disclosure: I am part of Trade Nation's Influencer program and receive a monthly fee for using their TradingView charts in my analysis.
Like and subscribe and comment my ideas if you enjoy them!

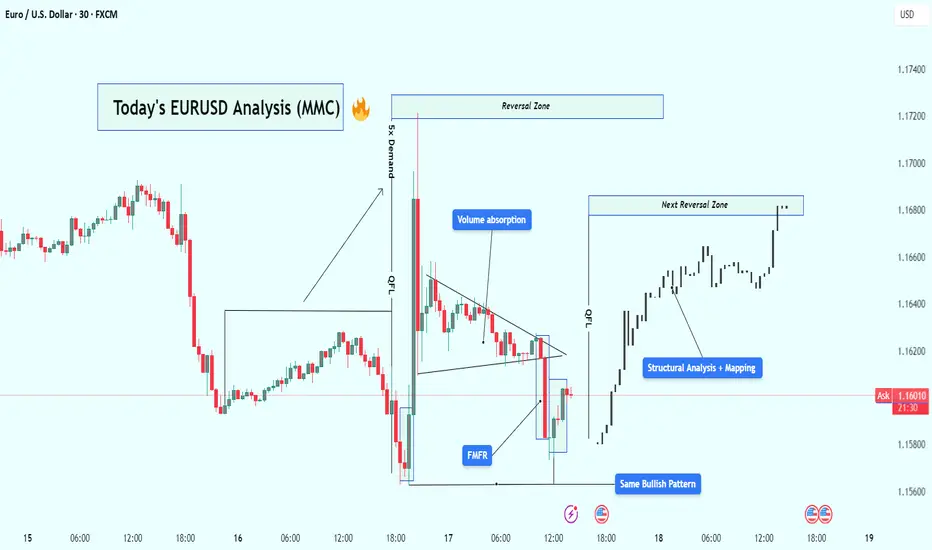
EUR/USD Analysis : Bullish Reversal – Volume Absorption & Target🧠 Market Overview:
EUR/USD has followed a flawless Market Maker Cycle, moving from manipulation to expansion. The chart shows institutional behavior through liquidity grabs, volume absorption, and structural breaks, confirming that big players are in full control.
The current price action signals bullish strength targeting the next high-probability reversal zone, but let’s break this down from the very beginning.
🔍 Key Chart Phases and Insights:
1️⃣ Massive Bearish Impulse – Liquidity Sweep Phase
At first glance, the chart shows an aggressive drop — a strong bearish leg that looks like market weakness.
❗ But in reality, this is the liquidity sweep phase. Here’s what likely happened:
Price ran below key lows
Hit stop losses of early buyers
Created “fake” bearish sentiment
Built sell-side liquidity for institutions to buy from
🔑 This isn’t weakness — it’s a setup.
2️⃣ FMFR (Final Move for Reversal) + Instant Reaction
At the end of that drop, the market printed a sharp bullish engulfing candle from the lows — this is known as the Final Move for Reversal (FMFR).
This marks:
The end of the accumulation phase
Entry of smart money into the market
The beginning of a new bullish cycle
The size and speed of this move indicate high-volume orders were filled — classic sign of institutional presence.
3️⃣ 5x Demand Push – Start of Expansion Phase
After the FMFR, price explodes upward with 5 consecutive bullish candles. This is your expansion phase — the market is moving fast, breaking structure, and flipping direction.
Key takeaways from this leg:
Strong displacement confirms a new trend
High momentum candles reflect institutional interest
Price breaks above previous structure levels
📈 This is no longer random — it’s planned and executed by bigger players.
4️⃣ Volume Absorption in Tight Wedge – Smart Money Re-Accumulation
After the breakout, price doesn’t just continue flying — instead, it compresses in a tight triangle. This is a key phase called volume absorption or re-accumulation.
What’s happening here:
Institutions are absorbing retail orders
Low volume = no resistance = easier breakout
Price is “charging” before the next move
🔋 Think of this like coiling a spring — it’s getting ready to pop again.
5️⃣ Bullish Pattern Repeats – MMC Confirmed
Interestingly, we now see the same bullish pattern forming again on the right side of the chart, similar to the first FMFR.
This is powerful because:
Pattern repetition means consistent order flow
Smart money is using the same blueprint
It gives us confidence to follow the trend
⚠️ When the same bullish setup happens twice — it’s not by chance.
6️⃣ Structural Mapping – Road to Reversal Zone
On the far right, we’ve entered clean bullish structure, making higher highs and higher lows.
We are now targeting:
The next Reversal Zone near 1.16800
This zone could act as resistance or another trap
A strong reaction from this zone can trigger either profit-taking or short-term reversal
Price is currently in the "continuation" part of MMC, heading toward premium levels.
📈 Trading Plan Based on This Setup:
✅ Primary Bullish Plan:
Price respects current structure
Breaks minor highs with strong volume
Entry on retracement to broken structure
Target: 1.16800 reversal zone
⚠️ Alternate Bearish Setup (If Price Rejects Reversal Zone):
Sharp rejection from reversal zone
Break of structure (BOS) on lower timeframe
Entry on lower high retest
Target: Liquidity areas below 1.16200
🧵 Conclusion:
This EUR/USD chart is a blueprint of institutional market flow. From the liquidity sweep, to volume absorption, to repeating bullish patterns, we’re seeing a textbook Market Maker Cycle (MMC) play out.
Here’s what makes this chart powerful:
✔️ Volume confirms structure
✔️ Reversal zones are clearly defined
✔️ Same bullish pattern = smart money roadmap
✔️ Trade setups are clean with defined risk
✅ This is the kind of setup you wait days for — don’t rush, follow structure, and execute with confirmation.
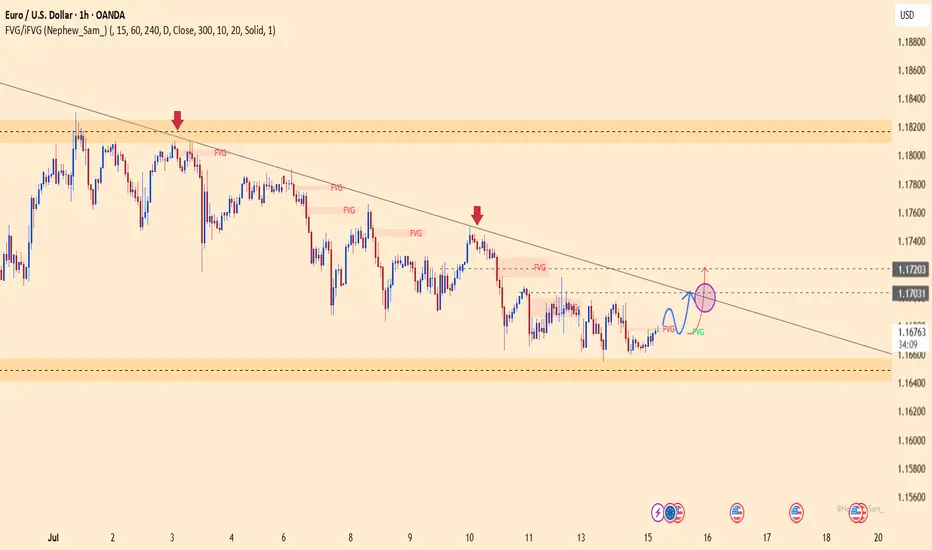
EURUSD – Bullish Momentum ReturnsEURUSD is gradually breaking free from downward pressure as it breaches the short-term accumulation structure, aiming for the resistance zone around 1.1720. On the chart, a clear bullish trend is emerging, supported by FVG signals reinforcing the recovery.
On the news front, expectations are rising that the European Central Bank will maintain a tighter policy stance for longer, as core inflation in the Eurozone remains elevated. Meanwhile, the USD is under corrective pressure following last week’s lower-than-expected U.S. CPI data. Upcoming statements from ECB and Fed officials today will be key in determining the next move for this currency pair.
Unless a surprise arises from the U.S. side, EURUSD is likely to sustain its short-term upward momentum and test the next technical resistance area.
EUR_USD BEARISH BREAKOUT|SHORT|
✅EUR_USD was trading along
The rising support line but
Now we are seeing a strong bearish
Breakout and the breakout is
Confirmed so we are bearish
Biased and we will be expecting
A further bearish move down
After the potential pullback
SHORT🔥
✅Like and subscribe to never miss a new idea!✅
Disclosure: I am part of Trade Nation's Influencer program and receive a monthly fee for using their TradingView charts in my analysis.

Buy EURUSDRisky scalp trade on EURUSD. Price is clearly declining but we will go against the run of play here as I anticipate a quick liquidity grab before sells continue.

EURUSD BUY TRADEOpportunity to Buy EURUSD now
Entry: 1.16800
Stoploss: 1.16500
Takeprofit: 1.17800
Comment your opinion
For Account management. Contact me on X @shajudeakinoba1

EURUSD NEW HIGHS?The 1h timeframe reminds me of this book, LIQUIDITY AND MANIPULATION.
"The markets need to generate liquidity in order to move, so if liquidity isn´t
already there, it will be created. So when new traders come in to forex and
learn about it for the first time, what they usually do is gonna be retail based
trading.
So support and resistance, chart patterns which are extremely popular in the
industry, and things of that nature.
So what some brokers do is they offer free education for their clients once we
start trading. Now this education will usually be retail methods support and
resistance. "
Thanks for this idea.
here is the chart relative to this, see the price above it will clear?
I have more on this kind of idea.
This is not a financial advice.
Follow for more .
trade it or see it.
Goodluck
