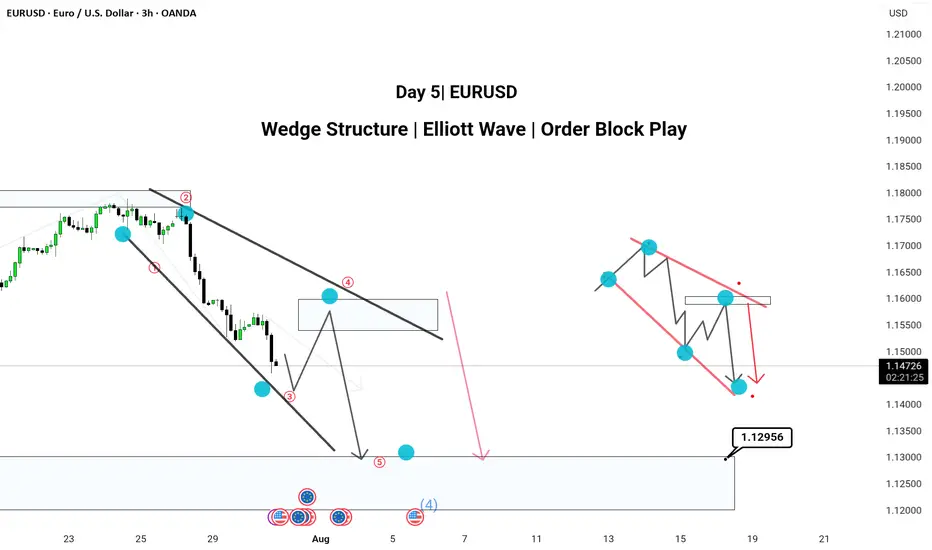
Pattern: Wedge Structure | Elliott Wave | Order Block PlayHere’s a powerful and professional description you can use when publishing this chart on TradingView:
---
🔻 Day 4 | EUR/USD Analysis 🔻
Chart Type: 3H Timeframe
---
📌 Chart Breakdown:
EUR/USD is respecting a textbook XABCD wedge pattern with clean Elliott Wave structure forming inside.
We’ve marked 5 key waves (1–5) completing within a falling wedge, aligning with a 50–60% retracement (Golden Zone) between point A and D.
🧠 Most traders miss the Golden Zone, but it’s often the clearest sign of upcoming trend continuation. Here, that continuation is bearish.
---
✅ 3H Confluence Factors:
Wedge forming within a larger downtrend
Multiple Break of Structures (BOS) confirming bearish momentum
Price targeting 1.12956 zone (mapped order block)
Elliott Wave fractals confirmed within structure
Hidden supply zone respected at Wave 4
---
📉 Expecting:
Retracement to supply → drop toward demand zone near 1.12956
---
📎 Strategy Insight:
SMC + Elliott Wave + Multi-timeframe path tool mapping gives us high confluence to expect continuation into the demand area.
💬 Comment below your views —
Do you also trade Wedges with Elliott Wave confirmation?
#EURUSD #WedgePattern #ElliottWave #SmartMoneyConcepts #OrderBlock #TechnicalAnalysis #TradingView #ForexIndia
---
USDEUX trade ideas
EUR USD long As the EUR treaty yesterday gave strength to the USD and "made America great again," today we’re seeing a correction. This setup is based on a value gap—if price breaks through this gap, there's a strong chance it will reach the next zone quickly. A buy setup could be effective in this scenario.
Disclaimer: This analysis is for educational purposes only and does not constitute financial advice. Always do your own research before making any trading decisions.

EURUSD - STRONGEST DECLINE FOR THE LAST COUPLE OF MONTHSEURUSD - STRONGEST DECLINE FOR THE LAST COUPLE OF MONTHS
EURUSD has lost 1.32% yesterday on the U.S. - E.U. trade deal. Experts suggest that the relief felt by the United States and the European Union upon reaching a trade agreement has been overshadowed by worries about the potential economic harm caused by a 15% tariff on EU imports. The dollar has recently experienced a positive trend, and this trend could continue if U.S. economic data, including Friday's employment figures, indicates a strong economy. The investors who had previously made substantial bets on the euro's appreciation are now reversing their positions, causing the euro to weaken.
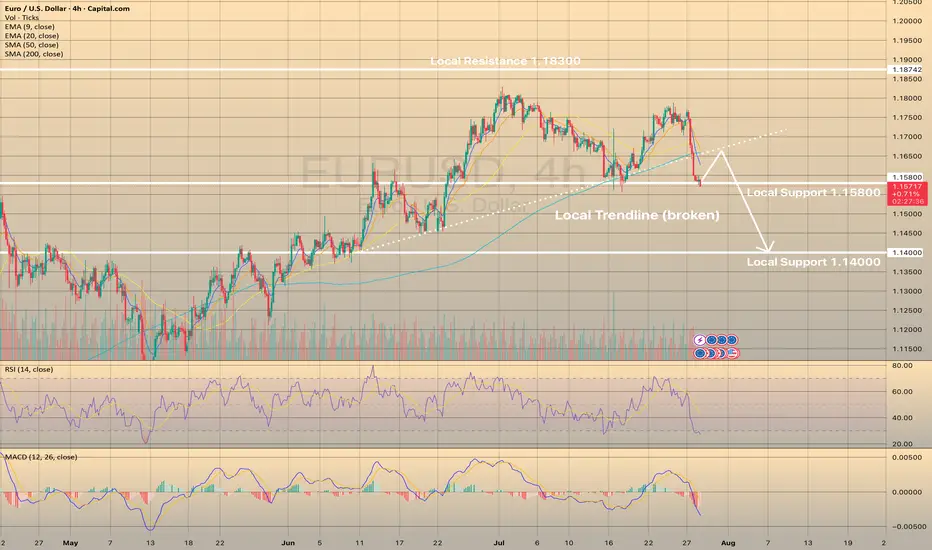
Technically, the asset broke down the local trendline and is currently trying to rebound from the local support level of 1.15800. RSI tells us that the asset is oversold, so the most possible outcome here is the EURUSD to rebound from current level, retest former trendline and continues downwards movement.
EUR/USD: Follow the yellow brick roadHello traders
I have utilized MTF(Multiple Time Frame) analysis for this idea in addition to the current fundamental environment.
The previous weekly levels can often be a good starting point for where this widely traded pair may head next.
On these charts, price has failed ahead of the weekly close of 1.1775. So far.
Fundamentally, the details of the USA/Euro Zone trade deal or framework for a deal, are not very clear yet. Which industries will be hit the hardest in Europe? Fine French wines, Stinky Swiss cheese, Monster M cars from BMW? Take your pick. In my mind, as a consumer, both the USA and the Old Country have significant strengths in different arenas.
As American consumers, we are now going to be forced to some degree to become price conscious one way or the other. Or maybe not. I'll still be sipping California, French or New Zealand wines.
As for the economy:
These "deals" DJT has made so far with Japan and the Euro Zone, once again, smacks of a strong arm policy, more than a reasonable and fair agreement. Time will be the deciding factor. As we have seen over time, trade agreements mean nothing. The WTO is a toothless institution.
The IEEPA ruling heads for the Federal Appeals Court this week and no doubt all the way to the Supreme Court.
However, based on the available information, I am observing the charts by looking back at how the markets react at the Sunday open. It tends to retest weekly OCHL levels first.
As for the USA/EURO zone deal, if it plays out according to news reports, it seems to be logical that a lot of Euros will have to be converted to USD.
But feel free to correct me.
Therefore, until Wednesday and the FOMC presser, I am short EUR/USD.
Best of luck.

Excitement or Euro sell-off?Today is Monday. After the market opened, the dollar suddenly surged while the euro dropped — even though there was no scheduled news on Forex Factory. Personally, I searched everywhere but couldn't find any fundamental reason behind this move. We’ll have to wait and see whether this trend continues or reverses.

EUR/USD Analysis: Potential Reversal at Key Support📉 Day 3 of 100: EUR/USD Breaks Structure!
Today’s market gave us a lesson! 📚
✅ SL Hit due to news
✅ 61% order block broken
✅ NY session may go bullish after Asia+London trap
.
Are you seeing the pattern unfold?
👇 Comment “Wave Watcher 🌊” if you use Elliott Wave!
Day 3/100 - EUR/USD Breakdown! | Forex Analysis | Elliott Wave | Order Block Strategy
In today’s update: 📌 SL hit due to major fundamental shift
📌 Break of 61% order block; heading to 78% zone
📌 Similar pattern in Tokyo/London sessions—bullish setup possible for NY session
.
💬 Drop a comment if you're also using Elliott Wave price action!
👍 Like | 🔁 Share | 🔔 Subscribe for more daily updates!
🚀 Join the 100-Day EUR/USD Challenge — Let’s decode the market together!
#forex #eurusd #elliottwave #orderblock #forextrader #forexeducation #smartmoneyconcepts #priceaction #forexchallenge #newyorksession #technicalanalysis #forexstrategy
---

EURUSD - trade - market structureDXY - trade - market structure , easy setup, clean setup , good probability, if this happen is a big win, use risk and trade managment
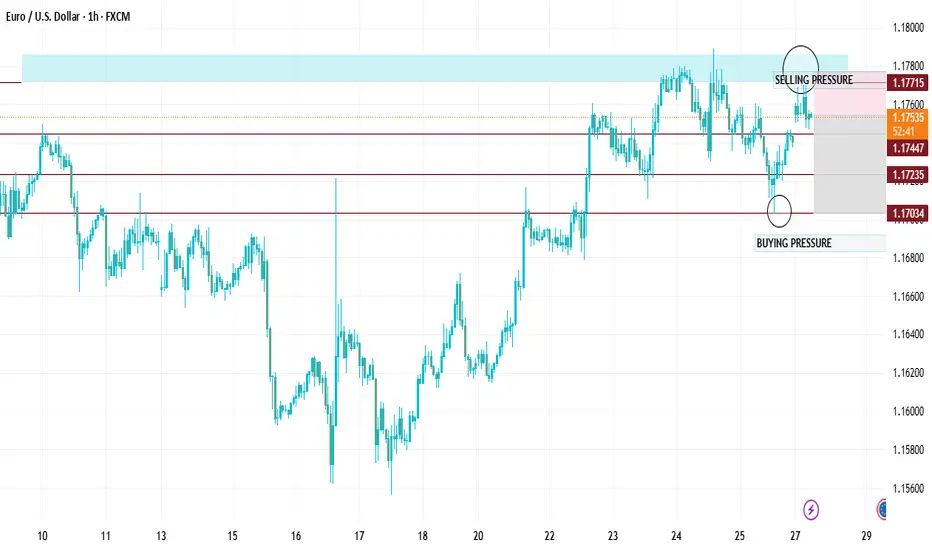
$EURUSDTrade Idea: EUR/USD – Short Position Opportunity We are $EURUSDTrade Idea: EUR/USD – Short Position Opportunity
We are currently observing a EUR/USD selling opportunity.
📌 Entry Zone: 1.17539
This level presents a favorable point to initiate a short (sell) position, based on current market structure and momentum indicators.
🎯 Target 1: 1.17300
🎯 Target 2: 1.17200
🎯 Target 3: 1.17150
These targets are based on key support levels and recent price action. The pair is showing signs of downward pressure, which may push the price toward these levels.
🛑 Stop Loss: 1.17920
This stop loss is placed just above recent resistance to protect against unexpected reversals or volatility spikes.

EURUSD Trade Plan 03/08/2025Dear Trader,
The price was propelled upwards from the 1.14 range on Friday. I expect the price to rise in a corrective wave towards the 1.16500-1.17000 area. From there, after confirming a rejection, I will enter a sell position with a target at 1.14 and then 1.11
Regards,
Alireza!

EURUSD Buy Setup – Eyes onStillness before the move. I’ve got my eye on 1.14769 as a potential long entry. It’s not random. The level aligns with past structure and feels like the kind of spot where demand might quietly step in again.
Buy Limit: 1.14769
Why here?
– Price has memory — this level has held before
– It’s tucked inside a potential demand zone
– If I see reaccumulation or bullish intent down there, I’m in
No chasing candles. No emotional FOMO. This is one of those "let price come to you or leave it alone" situations.
Chart’s attached — structure speaks if you listen close enough.
What’s your take? Got a similar zone? Drop it below.

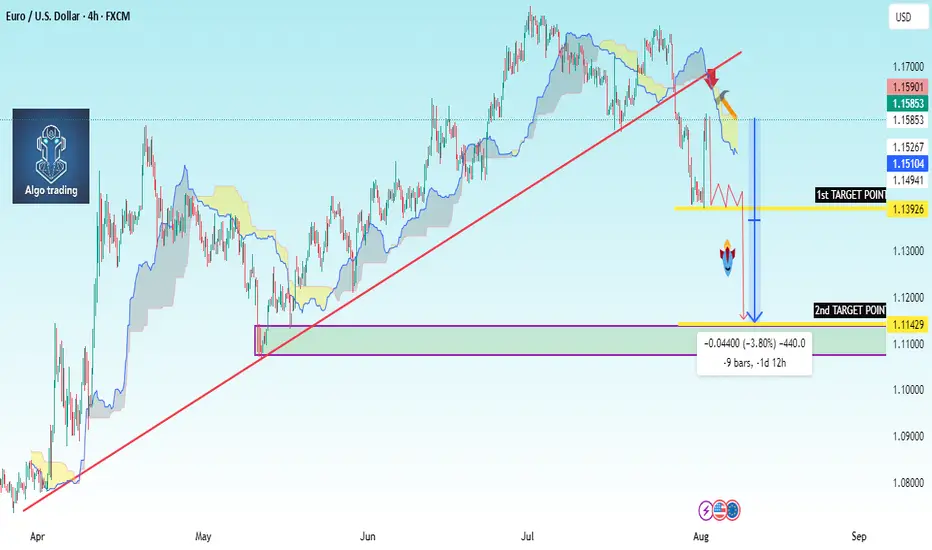
EUR/USD Chart Summary (Bearish Setup):Trendline Break: A long-term bullish trendline has been broken.
Price below Ichimoku Cloud: Indicates bearish momentum.
Bearish Retest: Price pulled back to retest the broken trendline and is now forming a bearish continuation pattern.
Double Target Zones Identified:
1st Target Point: ~1.1329
2nd Target Point: ~1.1144
---
🟠 Suggested Trade Setup:
🔹 Entry (Sell):
Around 1.1585 (where price is hovering now; or on a small pullback).
🔻 Take Profit (TP):
🎯 TP1: 1.1329 (short-term target)
🎯 TP2: 1.1144 (main target if bearish momentum continues)
🛑 Stop Loss (SL):
Place above the recent swing high or cloud resistance — around 1.1670
---
📊 Risk-Reward:
TP1 = ~250 pips
TP2 = ~440 pips
SL = ~85 pips
This gives you a favorable risk-reward (1:3+ to TP
EURUSD – Smart Money Short Setup During NFP Friday | ICT Concept
EURUSD is trading inside a well-defined bearish structure after multiple internal liquidity sweeps during the London and Asia sessions.
As we enter the New York Killzone, price has returned to a bearish OB near the NY Midnight Open, with clear signs of exhaustion.
The pair failed to break above the Thursday OB zone, and the 15M chart shows consecutive MSS and BOS patterns, indicating supply is in control.
🧠 Trade Idea (Execution Plan):
Sell Limit: 1.14183
SL: 1.14422
TP1: 1.13877
TP2: 1.13608
TP3: 1.13351
📌 Confluence:
Bearish OB
NY Midnight Open rejection
MSS on LTF
RSI/Williams %R Overbought
📉 Structure: Bearish
🕒 Session: New York (NFP Volatility Expected)
💡 Context: USD is likely to strengthen after deep retracement into DXY OB, targeting 100.5–100.7
If price invalidates 1.14422 with bullish displacement, setup becomes void.
Patience is key during high-impact news – let Smart Money show their hand.

EUR/USD Analysis:🔹 Performance Overview:
The short-term trend is bearish after breaking the recent low. A temporary price correction is likely before the downtrend continues.
1️⃣ Holding above 1.151 USD may lead to a correction toward 1.160 USD.
2️⃣ However, a break and close below 1.145 USD could push the price down to retest 1.140 USD, followed by 1.135 USD.
⚠️ Disclaimer:
This analysis is not financial advice. It is recommended to monitor the markets and carefully analyze the data before making any investment decisions.

The euro extends sharp losses following the US-EU tariff deal
The euro weakened sharply against the dollar amid views that the US-EU tariff deal favors the US. European leaders voiced mixed reactions. Germany’s Chancellor Merz welcomed the agreement as a safeguard against economic damage, while Hungary’s PM Orbán criticized it as a one-sided win for the US. Meanwhile, the IMF raised its eurozone growth forecast from 0.8% to 1.0% in its July outlook, citing the lower-than-expected tariff levels as supportive of the region’s economy.
EURUSD broke below the ascending trendline and briefly tested the support at 1.1520. EMA21 has death-crossed EMA78, indicating the potential extension of bearish momentum.
If EURUSD fails to hold above the support at 1.1520, the price could decline further toward 1.1450. Conversely, if EURUSD breaches above the resistance at 1.1590, the price may gain upward momentum toward 1.1640.

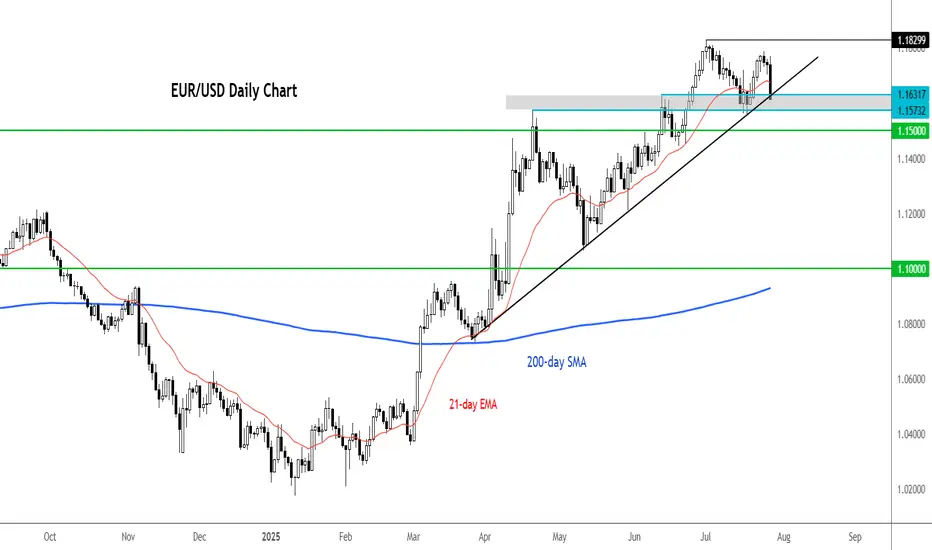
EUR/USD Technical OutlookToday we’re focusing on the euro versus the US dollar, which has recently experienced a sharp sell-off. The move appears directional and is now approaching a key support zone, defined by:
• The April high at 1.1573
• The June low at 1.1556
• The 55-day moving average at 1.1536
A daily close below 1.1536 would be required to confirm further downside momentum.
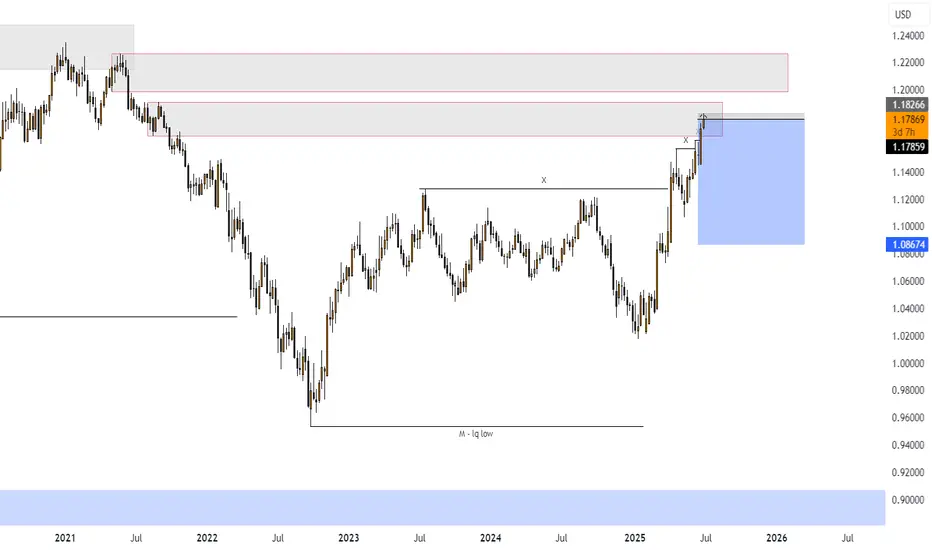
At present, the pair looks technically vulnerable, having reversed from the top of a 3-year rising channel, with weekly RSI indicators suggesting potential exhaustion. Channel resistance stands around 1.1850.
🔽 Should support fail, we could be looking at a measured move toward the 1.1300 area as a minimum downside target.
This is a critical juncture — we’ll be watching closely for confirmation in the coming sessions.
Disclaimer:
The information posted on Trading View is for informative purposes and is not intended to constitute advice in any form, including but not limited to investment, accounting, tax, legal or regulatory advice. The information therefore has no regard to the specific investment objectives, financial situation or particular needs of any specific recipient. Opinions expressed are our current opinions as of the date appearing on Trading View only. All illustrations, forecasts or hypothetical data are for illustrative purposes only. The Society of Technical Analysts Ltd does not make representation that the information provided is appropriate for use in all jurisdictions or by all Investors or other potential Investors. Parties are therefore responsible for compliance with applicable local laws and regulations. The Society of Technical Analysts will not be held liable for any loss or damage resulting directly or indirectly from the use of any information on this site.

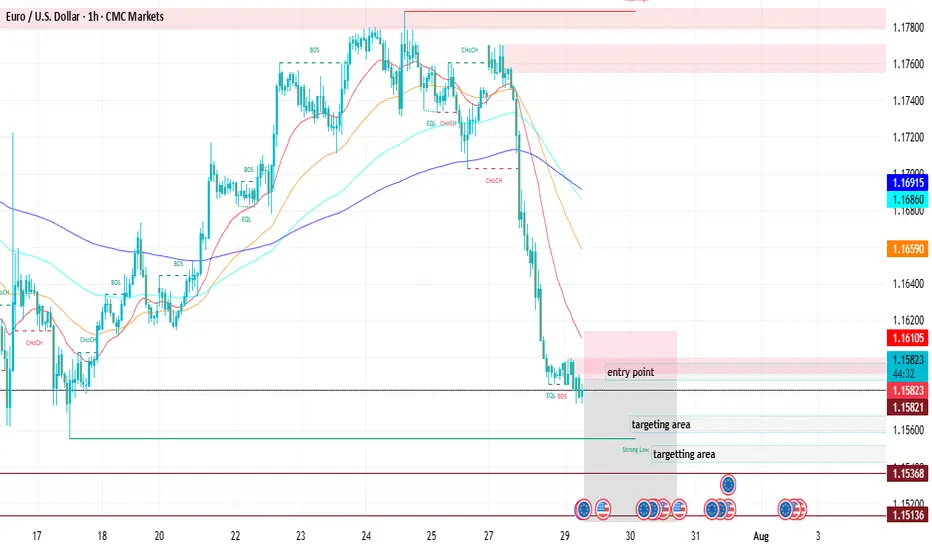
EURUSDTrade Opportunity: EURUSD – Short Position Setup
We have identified a potential selling opportunity on the EURUSD pair, supported by current price structure, momentum shifts, and broader market dynamics. EURUSD is currently facing strong resistance near the 1.15850–1.15900 zone, which has rejected price multiple times in the recent past.
The pair appears to be forming a lower high on the 1H and 4H charts, indicating weakening bullish momentum and the potential start of a downward move.
Entering the trade at 1.15862 allows us to capitalize on early signs of bearish reversal before a possible larger drop unfolds.
The first target at 1.15610 captures a minor support level and could be reached swiftly if bearish pressure persists.
The second target at 1.15480 aligns with the base of a previous consolidation range, offering additional confirmation of downward structure.
The third target at 1.15320 reaches deeper into the last demand zone and could be hit if bearish sentiment intensifies.
The stop loss at 1.15950 is placed just above the recent swing high to protect the trade while keeping the risk tight and manageable.
Awaiting for bullish signal - EURUSDSo my EURUSD pair was stopped out with a profit. Now, at this price level, it looks like the selling pressure is not finished so I will be waiting.......
As I want to LONG ONLY so I will not be shorting this pair for now.
Let's check back later to see how the price movement is
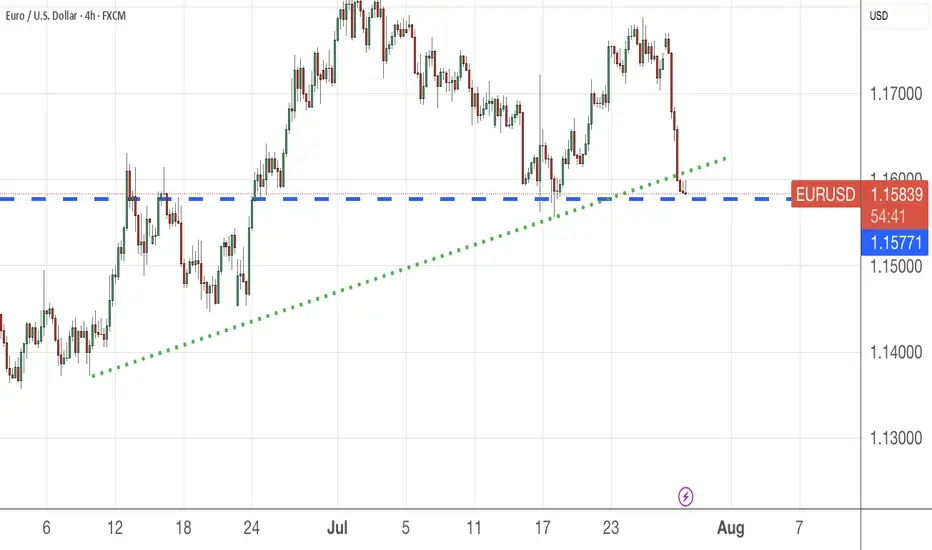
EUR/USD testing bull trend after 1% dropThere are multiple factors weighing on the EUR/USD today. We have seen a broad dollar rally, suggesting that the trade agreements are seen as net positive for the US economy, even it means rising inflation risks. With higher tariffs and Trump’s inflationary fiscal agenda, interest rates in the US are likely to remain elevated for longer.
As far as the euro itself is concerned, the single currency fell all major currencies, which suggests investors were not impressed by the EU’s negotiation tactics. Accepting a 15% tariff on most of its exports to the US while reducing levies on some American products to zero, means the deal will make companies in Europe less competitive. Still, it could have been a far worse situation had we seen a trade war similar to the US-China situation in April. It means that there is now some stability and businesses can get on with things. On balance, though, European leaders will feel that they may have compromised a little too much.
Technically, the EUR/USD is still not in a bearish trend despite today’s sizeable drop. But that could change if the bullish trend line breaks now. If that happens 1.15 could be the next stop. Resistance is now 1.1650 followed by 1.1700.
By Fawad Razaqzada, market analyst with FOREX.com
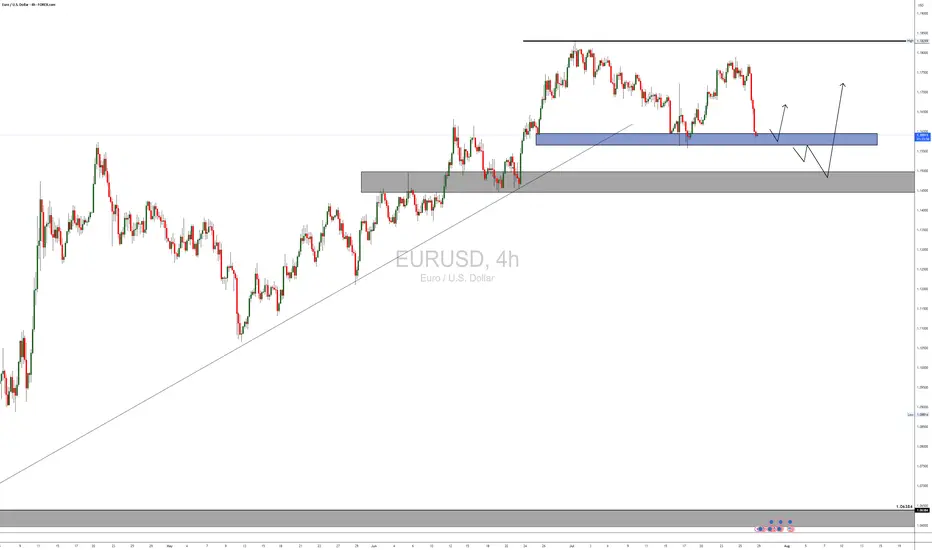
Next Move On EURUSD: A Bullish ContinuationWith this 4H bearish impulsive move, it’s easy to assume a reversal is underway to break the previous daily swing low. However, this appears more like a liquidity grab—fueling the next leg to the upside.
Price has retraced into a key zone that previously performed a strong liquidation. With significant liquidity already swept and clean inducements now resting above, this level becomes crucial.
This zone is the last stand: a break downward may target the daily swing low, while a hold and reaction could propel price toward the swing high.
Fingers crossed 🤞 as we watch price play out.
Have a great trading week, traders.
Catch you in the next one. 🫡

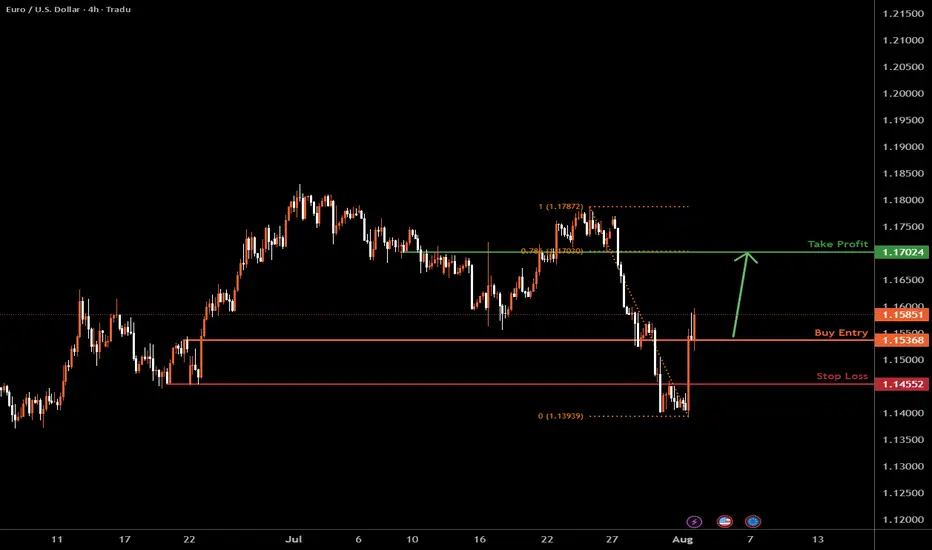
The Fiber H4 | Bullish riseEUR/USD has bounced off the support level, which serves as a pullback support and could potentially rise from this level to our take-profit target.
Buy entry is at 1.1585, which is a pullback support.
Stop loss is at 1.1455, which is a pullback support.
Take profit is at 1.1702, which is a pullback resistance that aligns with the 78.6% Fibonacci retracement.
High Risk Investment Warning
Trading Forex/CFDs on margin carries a high level of risk and may not be suitable for all investors. Leverage can work against you.
Stratos Markets Limited (tradu.com ):
CFDs are complex instruments and come with a high risk of losing money rapidly due to leverage. 65% of retail investor accounts lose money when trading CFDs with this provider. You should consider whether you understand how CFDs work and whether you can afford to take the high risk of losing your money.
Stratos Europe Ltd (tradu.com ):
CFDs are complex instruments and come with a high risk of losing money rapidly due to leverage. 66% of retail investor accounts lose money when trading CFDs with this provider. You should consider whether you understand how CFDs work and whether you can afford to take the high risk of losing your money.
Stratos Global LLC (tradu.com):
Losses can exceed deposits.
Please be advised that the information presented on TradingView is provided to Tradu (‘Company’, ‘we’) by a third-party provider (‘TFA Global Pte Ltd’). Please be reminded that you are solely responsible for the trading decisions on your account. There is a very high degree of risk involved in trading. Any information and/or content is intended entirely for research, educational and informational purposes only and does not constitute investment or consultation advice or investment strategy. The information is not tailored to the investment needs of any specific person and therefore does not involve a consideration of any of the investment objectives, financial situation or needs of any viewer that may receive it. Kindly also note that past performance is not a reliable indicator of future results. Actual results may differ materially from those anticipated in forward-looking or past performance statements. We assume no liability as to the accuracy or completeness of any of the information and/or content provided herein and the Company cannot be held responsible for any omission, mistake nor for any loss or damage including without limitation to any loss of profit which may arise from reliance on any information supplied by TFA Global Pte Ltd.
The speaker(s) is neither an employee, agent nor representative of Tradu and is therefore acting independently. The opinions given are their own, constitute general market commentary, and do not constitute the opinion or advice of Tradu or any form of personal or investment advice. Tradu neither endorses nor guarantees offerings of third-party speakers, nor is Tradu responsible for the content, veracity or opinions of third-party speakers, presenters or participants.
EURUSD : Status @ 1/8Direction: Buy
Signal triggered: 1/8/2025
Stop when:
a) Stop Loss @ 1.1400; or if
b) Buy signal triggered
Action:
Buy the dip (or not at all)
Good luck.
P/S: Price has made a sudden rise, and it would not be wise to buy now. It is better to wait for the sell signal.
The day before the big rise, the signal was hesitant to give a BUY. I think the MARKET is unsure as well. Price can move either way. Missing out is not necessarily a bad idea, as such moves can easily result in huge losses.
