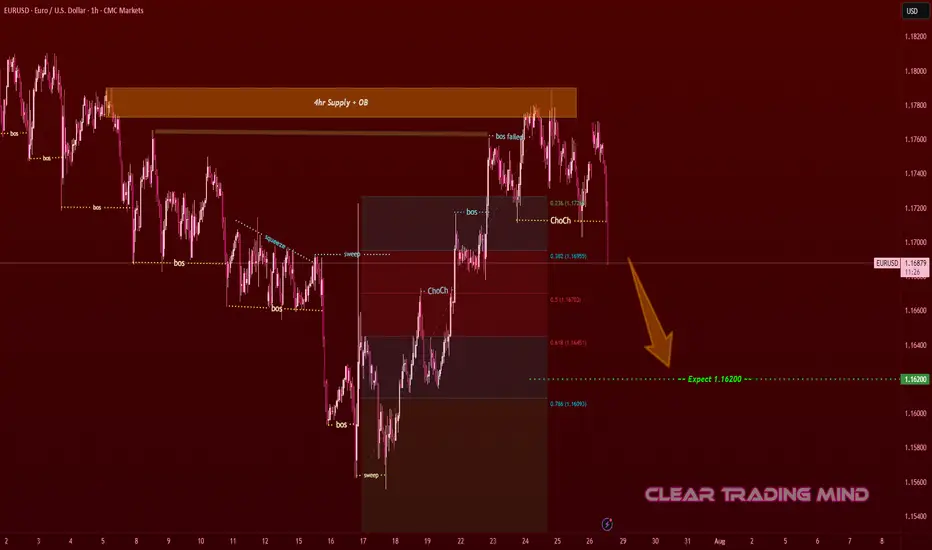
EURUSD Supply Rejection – Bearish Move ExpectedOn the 1-hour chart, EURUSD tapped into the 4hr Supply + OB zone 🟧 and failed to hold above previous structure.
- BoS (Break of Structure) shows weakness at highs
- ChoCh (Change of Character) confirms bearish shift
- Price rejected from 0.236 Fib level (1.17400) and is moving lower
Plan:
- Expecting price to move toward 1.16200 (≈ 120 pips from current level) 🎯
- Bearish momentum remains valid as long as price stays below supply zone
- Confirmation candles & retests strengthen short bias
Reasoning:
- Supply zone rejection + failed breakout
- Clear structure shift (ChoCh) toward lower lows
- Fib retracement confluence (0.5 – 0.618 zone) aligning with sell pressure
(Not financial advice – only a personal observation)
USDEUX trade ideas
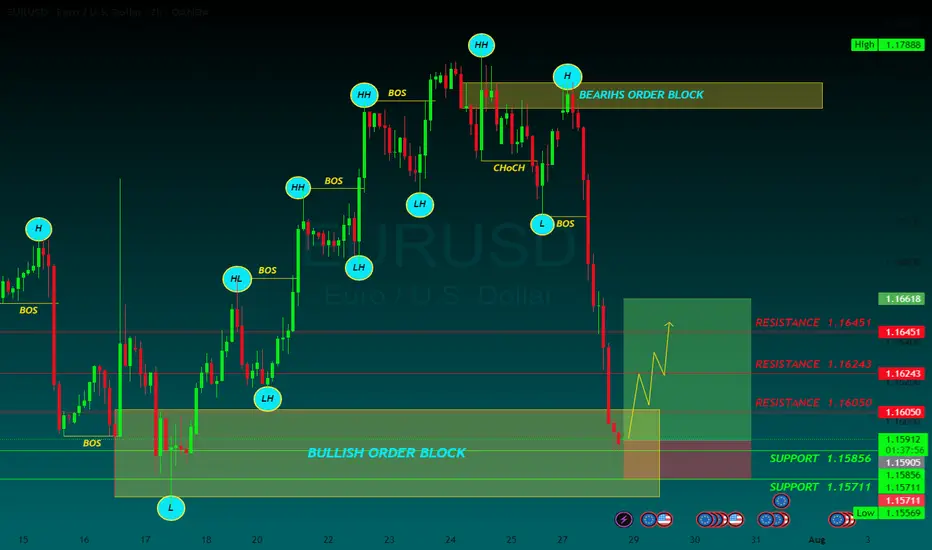
EURUSD BUYThe US Dollar (USD) gapped lower at the weekly opening amid optimism fueling demand for high-yielding assets, following news that the United States (US) and the European Union (EU) reached a trade deal.
The US and the EU agreed a 15% tariff on most European goods entering the US, much higher than the average 4.8% exporters face these days. No rates will apply to EU exports in important sectors, including aircraft parts, some chemicals, semiconductor equipment and some agricultural products.
The EU response to the headline was uneven. European Central Bank (ECB) policymaker Peter Kazimir said on Monday that the trade deal reduces uncertainty, but it is unclear for now how it impacts inflation. However, the French prime minister, François Bayrou, said the EU has capitulated to Donald Trump’s threats, adding it is a “dark day” for the EU. The trade focus now shifts to the US-China as officials from both countries resume talks in Stockholm.
The EUR/USD pair peaked at 1.1771 during Asian trading hours, but changed course early in Europe, with the USD surging across the FX board, resulting in the pair shedding over 100 pips.
The macroeconomic calendar had nothing relevant to offer at the beginning of the week, but will be flooded with first-tier releases, including US employment-related data ahead of the Nonfarm Payrolls report on Friday, the preliminary estimates of the Q2 Gross Domestic Product (GDP) for the US and the EU, and inflation updates. On top of that, the Federal Reserve (Fed) will announce its decision on monetary policy on Wednesday.
RESISTANCE 1.16050
RESISTANCE 1.16243
RESISTANCE 1.16451
SUPPORT 1.15856
SUPPORT 1.15711
eurusd Short position sell 20 to 30 pips Eur usd short position sell 20 to 30 pips .
If you want to learn this analysis system free free contrect with me .

Xmoon Indicator Tutorial – Part 1 – Strategy🔻🔻🔻+ Persian version below🔻🔻🔻
📘 Xmoon Indicator Tutorial – Part 1
🎯 3Push Divergence RSI Strategy
🔥 The core of the Xmoon indicator
is built upon one of the most powerful strategies in technical analysis:
The advanced 3Push Divergence RSI pattern
🔁 A pattern that typically appears at key market turning points.
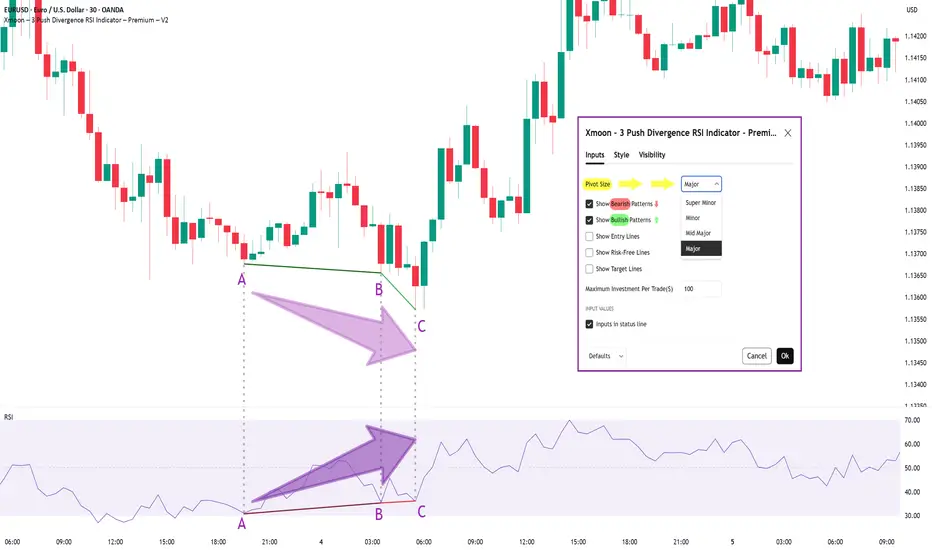
📉 When the price moves in the same direction three consecutive times on pivot points (e.g., making lower lows or higher highs), but the RSI shows the opposite behavior, it indicates a clear divergence !
💡 This divergence can act as a strong signal for a potential trend reversal.
🎯 The Xmoon Indicator is designed to detect this critical moment.
⚙️ Xmoon Indicator Settings Panel
The Xmoon settings panel offers the following options:
🔸 Pattern Type Selection: In the first and second lines, you can specify which type of pattern should be displayed: only bullish patterns or only bearish ones. You can also check both options.
🔸 Pivot Type Selection: From the dropdown menu, you can choose one of four pivot types:
“Super Minor”, “Minor”, “Mid-Major”, and “Major”, ordered from smallest to largest.
📌 Educational Note: The greater the distance (in candle count) between two lows or two highs, the larger the pivot is considered.
A Major Pivot is the largest among them.
✅ Larger Pivot = Higher Accuracy
❗ But naturally = Fewer Signals
📣 If you have any questions or need guidance, feel free to ask us. We’d be happy to help.
🔻🔻🔻بخش فارسی – Persian Section 🔻🔻🔻
📘 آموزش اندیکاتور ایکسمون - قسمت اول
🎯 استراتژی سهپوش واگرایی (3Push Divergence RSI)
🔥 هسته اصلی ایکسمون
بر پایه یکی از قویترین استراتژیهای تحلیل تکنیکال طراحی شده است
الگوی پیشرفته سهپوش واگرایی
🔁 الگویی که معمولاً در نقاط چرخش مهم بازار ظاهر میشود
📉 وقتی قیمت سه بار پشت سر هم روی نقاط پیوت ، در یک جهت حرکت میکند (مثلاً کفهای پایینتر یا سقفهای بالاتر میسازد) ، اما آر-اِس-آی خلاف آن را نشان میدهد، یعنی یک واگرایی آشکار رخ داده است
💡این واگرایی میتواند سیگنالی قوی برای برگشت روند باشد
🎯 اندیکاتور ایکسمون این لحظه را شناسایی میکند
⚙️ پنجره تنظیمات اندیکاتور ایکسمون
در بخش تنظیمات اندیکاتور ایکسمون، امکاناتی در اختیار شما قرار دارند
🔸 انتخاب نوع الگو: در خط اول و دوم میتوانید مشخص کنید چه نوع الگویی نمایش داده شود
فقط الگوهای صعودی یا فقط نزولی. همچنین می توانید تیک هر دو گزینه را بزنید
🔸 انتخاب نوع پیوتها: از پنجره کشویی بالا، می توانید یکی از ۴ نوع پیوت را انتخاب کنید
پیوت ها به ترتیب از کوچک به بزرگ عبارتند از: سوپر مینور ، مینور ، میدماژور و ماژور
📌 نکته آموزشی: هرچه فاصله بین دو کف یا دو سقف بیشتر باشد (یعنی تعداد کندلهای بین آنها زیادتر باشد)، آن پیوت، بزرگتر محسوب میشود
پیوت ماژور از بقیه بزرگ تر است
✅ پیوت بزرگتر = دقت بالاتر
❗ اما طبیعتاً = تعداد سیگنال کمتر
📣 اگر سوالی دارید یا نیاز به راهنمایی دارید، خوشحال میشویم از ما بپرسید
با کمال میل در خدمتتان هستیم
EURUSD--LONG--02_08_25--strong reaction from monthly support around 1.14142
--price will move higher towards 1.17019
--best entry is between 1.15585 and 1.15619

EURUSD – German GDP boosts EUR, but USD still holds the reins Germany’s recently released GDP data exceeded expectations, acting as a catalyst for EURUSD to rebound after a steep decline. However, this upward move remains fragile, as the USD continues to dominate the market—especially with several key U.S. economic reports set to be released later this week.
On the chart, EURUSD has just bounced from the 1.15000 support zone, which has historically served as a strong floor. If the price holds above this level and breaks the downtrend line, the short-term target could move toward the 1.15700 resistance zone.
Still, the path ahead won’t be easy. The market is closely watching upcoming U.S. data, such as the jobs report and the Core PCE index—the Fed’s preferred inflation gauge. If these figures come in strong, the USD could regain strength and put pressure back on EURUSD.

EUR/USD Recovery in Play — Eyes on ResistanceHi Everyone,
Since our last update, EUR/USD briefly dipped below the 1.16000 level but quickly reclaimed the key 1.16450 zone — a level that continues to serve as an important structural pivot.
Price has since stabilised above this support and is now moving back toward the highlighted resistance area around 1.17450. A sustained push toward 1.18000 in the coming sessions would further reinforce the presence of renewed buying interest.
Our broader outlook remains unchanged: we continue to anticipate the pair building momentum for another move higher. A decisive break above 1.18350 could open the path toward the 1.19290 area and ultimately the 1.20000 handle.
We’ll be watching closely to see whether this recovery gains traction and if buyers can sustain momentum through resistance. The longer-term view remains bullish, as long as price continues to hold above the key support zone.
We’ll continue to provide updates throughout the week as the structure develops and share how we’re managing our active positions.
Thanks again for all the likes, boosts, comments, and follows — we really appreciate the support!
All the best for the rest of the week.
Trade safe.
BluetonaFX

100% Guaranteed EURUSD Long time buy Position .Eur Usd long time buy position . Next profit will be 50 to 100 pips .
Take 1st tp 50 pips and wait for next 100 pips
If you have any question fell free ask my any question

EURUSD Analysis : Rejection at Demand – Institutional Buy Setup🔍 Technical Storyline – What the Chart Tells Us:
🔸 1. Previous Bearish Structure – Descending Channel:
Price has been moving within a well-respected bearish channel, signifying structured sell-side liquidity control.
This channel served as a trap zone, where retail sellers were induced while institutions accumulated buy-side positions below the range.
The controlled movement inside the channel ended with a breakout to the upside, signaling a disruption in bearish control.
🔸 2. QFL Zone Formation – Manipulation & Liquidity Grab:
QFL (Quasimodo Failure Level) is evident in two phases here:
The first QFL acts as a reaction point where the market dropped to test demand and rallied aggressively.
The second QFL near the highs shows price swept previous liquidity before dumping, hinting at institutional profit-taking and possible redistribution into discount areas.
🔸 3. Central Reversal Zone (CRZ):
Price reversed sharply from this CRZ, which acted as a major supply level. The CRZ marks the top of the manipulation range.
This was a liquidity sweep targeting trapped long positions that entered too late at the highs.
🔸 4. Demand Revisit + Positive Rejection Pattern (Current Phase):
Price has now reached the MMC-validated demand zone, which previously launched a strong bullish move.
The long lower wick in the latest candle shows buyer absorption, suggesting early signs of a Positive Reversal Pattern.
This area is marked with high probability for bullish continuation, as it aligns with both technical support and smart money logic.
💡 Trading Plan & Market Mindset:
🔸 📈 Bullish Scenario (High-Probability Play):
Wait for bullish confirmation, such as:
Bullish engulfing on 1H/4H
Break of minor intraday structure (e.g., break of internal LH)
Strong volume surge from the zone
Entry zone: Within the demand block – 1.15500 to 1.15750
Stop-loss: Just below the demand zone (1.15250)
Target 1 (TP1): 1.16500 – minor intraday resistance
Target 2 (TP2): 1.17500–1.18000 – retest of QFL high and Central Reversal Zone
🔸 ❌ Bearish Invalidator:
A 4H candle close below 1.15250 would break the demand zone structure.
Invalidation of MMC reversal – move toward deeper liquidity (1.14500–1.14800)
🧠 Trader’s Psychology & Institutional Mindset:
Institutions often induce price spikes to trap both buyers and sellers.
This entire structure reflects classic accumulation → manipulation → distribution → reaccumulation.
The retest of the original demand zone allows institutions to re-enter at discount before pushing price back toward the highs.
“In MMC, patterns are not just shapes – they are footprints of institutional intent.”

EURUSD testing necklineEURUSD has made the move we were waiting for . it went to test our neckline of the double bottom or M pattern , now we just need to wait for confirmation for the longterm sell before we enter

EURUSD Long Setup – Liquidity Sweep + Distribution Opportunity**📍 EURUSD Long Setup – Liquidity Sweep + Distribution Opportunity**
Currently monitoring EURUSD as price consolidates near a potential short-term demand zone. The recent price action suggests that we may observe a **liquidity grab below previous session lows**, possibly during the **London session**, before a directional move.
My focus remains on **how New York session will react** — potentially stepping in as a **distribution phase**, which could initiate the bullish leg toward the upper imbalance zones.
Key confluences:
* Anticipated liquidity below previous session lows (Asia & London).
* Bullish FVG aligned with higher timeframe structure.
* Targets at **1.17219** and extension toward **1.17744**, matching daily imbalance and previous supply area.
Patience is key here. Waiting for **clear confirmation post-sweep**, ideally via a CHoCH or bullish engulfing on the lower timeframe, before executing.
`DO NOT USE THIS AS SIGNAL OR ANY OF A KIND´
Emerson Massawe
COO | FINANCIAL MARKET ANALYST|

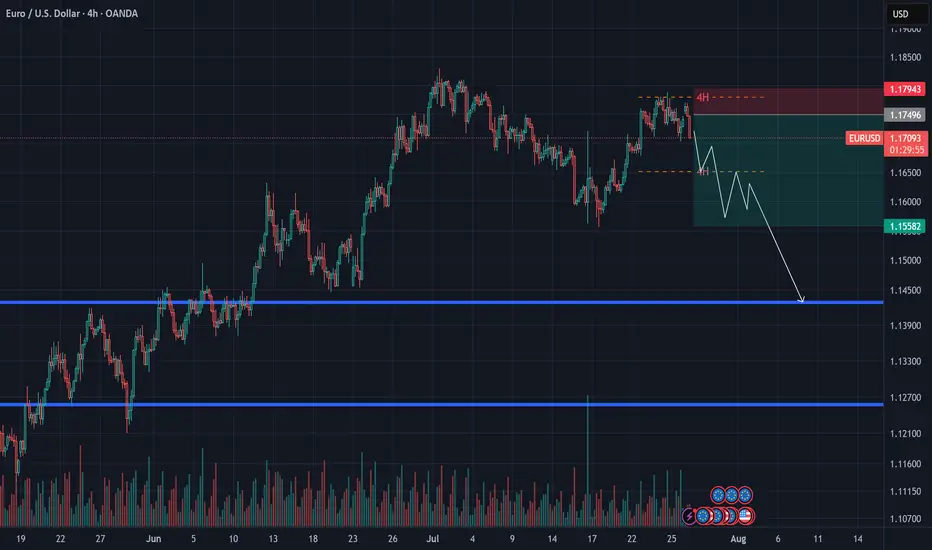
Euro takes a hit as trade deal with the US sparks a market rallyTrading this week kicked off with a trade agreement between the United States and the European Union, which pushed both the US and European indices to open in the green.
However, this development had a negative impact on the euro, which is experiencing a significant decline during today's session, Monday, July 28, 2025. Meanwhile, the US dollar is making a strong comeback, rising by 0.60% ahead of the US session open.
This recent decline has reversed the euro’s upward trend that it had maintained since the beginning of this month. The EUR/USD pair dropped again, hitting a new low below the 1.17110 level, which represents the last lower high of the bullish trend.
What is the likely upcoming scenario?
A price increase for the pair to the 1.17635 level would be considered a corrective move within the ongoing bearish trend. The negative outlook would not change unless the price records a higher high above the 1.17889 level on the 4-hour timeframe.
However, the EUR/USD is heading into an important week filled with key economic data and news, particularly from the US. This includes the US Non-Farm Payrolls set to be released on Friday, August 1, 2025, and the Federal Reserve meeting on Wednesday, July 30, 2025. The later will cover interest rate decisions and upcoming economic projections. The outcomes of these events are expected to have a direct impact on both the US dollar and the EUR/USD pair.

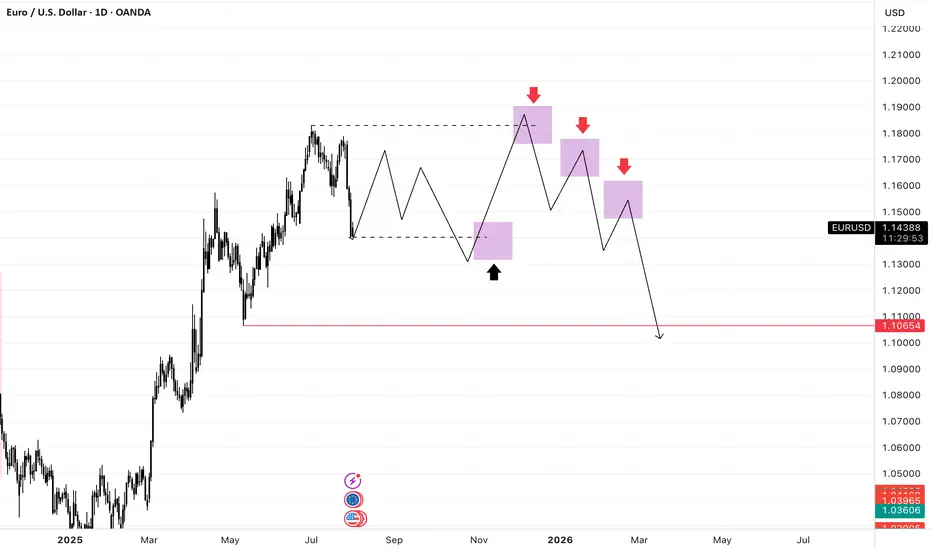
EURUSD Outlook – July 27, 2025This week, the EU is set to release key economic data, including GDP figures.
Given the recent U.S. tariff pressure, there’s a strong chance that these numbers will come in weak — weighing further on the euro.
📉 After bouncing from the 1.15 level, EURUSD entered a corrective move, but even with extended consolidation, it failed to reach the previous high — a sign of growing exhaustion.
📌 Price action suggests a lack of bullish momentum, and candles are reflecting market fatigue.
🔁 I expect the euro to enter a mid-term corrective phase, potentially heading back toward the 1.13 zone.
🎯 A short entry below 1.18 could offer a favorable risk-reward setup.
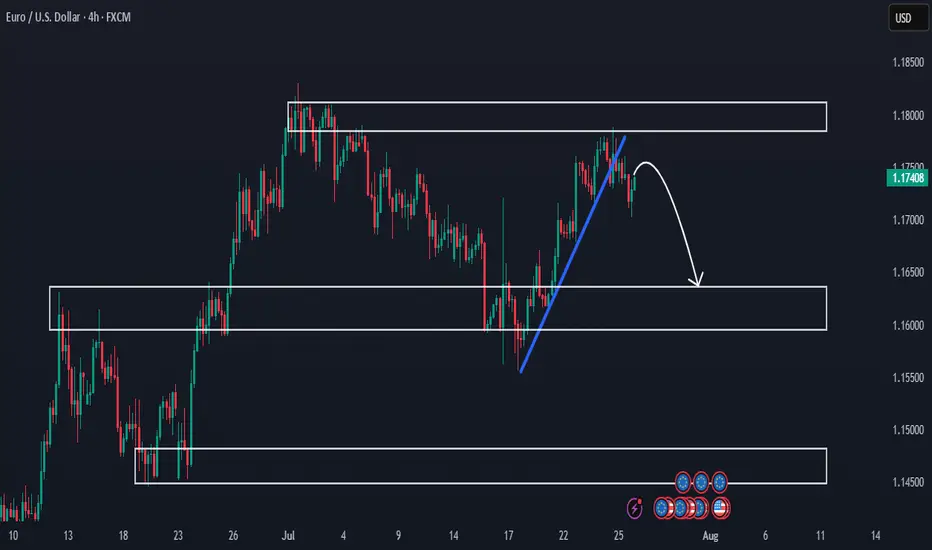
Premarket Analysis - Will Price Head Lower?Hello everybody!
We’re looking at three key areas on the chart.
Price has been rejected from a supply zone.
The clean upward trendline has been broken, and we expect the price to move lower this week.
If the drop continues, we’ll look to sell and aim for the more likely target around 1.16400.
Then we’ll see whether this first demand/support area holds or not.
Have a good trading week ahead!
EURUSD: NEW WEEK TECHNICAL BIAS (MARKET OPEN)CONTEXT
The Monthly and Weekly timeframes still maintain a valid Ascend Sequence, with no confirmed trend breakdown yet.
However, the Daily has signaled a down Trend Shift, which I currently interpret as a correctional move—likely a pause before a continuation toward the primary HTF target zone.
📈 Expecting a rally toward 1.16439 or further into the 1.17031 zone.
📉 From there, a pullback into the 1.15727, 1.3524 and 1.12421 price levels.
This retracement could:
1. Extend toward or beyond the Range Low (RH)
2. OR form a Bid Accumulation Zone (BAZ) for a fresh leg in the HTF bullish narrative.
⚠️ There’s also a slim probability of 1.15727 acting as an early base to launch the rally.
● This projection is based purely on technical structure. No fundamental overlays.
📌 This is a strategic directional bias, not financial advice. Execute only with confirmation and proper risk management.

EURUSD: The Market Is Looking Up! Long!
My dear friends,
Today we will analyse EURUSD together☺️
The price is near a wide key level
and the pair is approaching a significant decision level of 1.14350 Therefore, a strong bullish reaction here could determine the next move up.We will watch for a confirmation candle, and then target the next key level of 1.14588.Recommend Stop-loss is beyond the current level.
❤️Sending you lots of Love and Hugs❤️

Levels im interested on EU | Price Action BreakdownHere's my current view on EURUSD I’m watching a few key zones based on structure, previous liquidity grabs, and confluences lining up this week.
Short-term price expectations
Educational purpose only this is not financial advice.


EUR/USD Robbery Blueprint Bear Strike Activated!💣🎯Operation Fiber Down: EUR/USD Robbery Blueprint (Day Trade Edition) 💰🔫
🚨 Thieves, Hustlers & Chart Bandits Assemble! 🚨
🌍 Hi! Hola! Ola! Bonjour! Hallo! Marhaba! 🌍
Welcome back to another Thief Trading Operation, where the money never sleeps—and neither do we. Let’s break into the vault of EUR/USD “The Fiber” with surgical precision. 🧠💼🕶️
🧨 THE MASTER ROBBERY PLAN: EUR/USD SHORT STRIKE 🔍💸
💀 Market Bias: Bearish – Trend Reversal + Supply Trap Setup
🎯 Target: 1.15800
🛑 Stop-Loss: Near Swing High (around 1.17400 – 3H chart view)
🕓 Timeframe Focus: 15m / 30m / 3H
🧭 ENTRY ZONE:
👣 Plan your entry from recent high retests—that’s where the big money bulls get trapped.
🎯 Use Sell Limit Orders (DCA style / Layered Limit Orders) like a true thief setting up tripwires.
💼 RISK STRATEGY:
💡 SL should match your lot size and order count—not one-size-fits-all!
📌 Place above key structure or swing level (e.g. 1.17400) based on timeframe.
🔍 BEHIND THE SCENES – THE WHY:
The EUR/USD "Fiber" pair is showing all the classic signs of a trend shift and bear raid setup, including:
📰 Fundamentals weakening the Euro
💣 COT Report reveals institutional exits
🍂 Seasonal Bias points to downward trend
📉 Intermarket Pressure from bond yields & USD strength
📊 Sentiment turning overly bullish = trap zone
⛽ Storage & Inventory imbalances adding fuel
📌 Reminder: Before any robbery, study the layout—Macro, Fundamentals, Sentiment, and Intermarket are your blueprint.
🚨 HEIST ALERT – PROTECT THE LOOT:
🕰️ High-Impact News Events? Tighten up!
💼 Don’t take fresh entries during releases.
🔐 Use Trailing SLs to lock in profits.
🎯 Exit with grace before the sirens start.
⚡🔥JOIN THE CREW, BOOST THE LOOT🔥⚡
💥 Smash the Boost Button 💥 if you're vibing with the Thief Trading Movement.
We ain’t just trading—we’re executing strategic robberies on the market’s weaknesses.
🧠💪 Every like = more power to the crew. Every comment = a new map to a vault.
We rob, retreat, and repeat. Let’s make money with skill, not luck. 🕶️💰🚁
⚠️ LEGAL COVER (For the Lawyers 😏):
This plan is not investment advice, just an organized heist blueprint by chart robbers.
Always manage your own risk and update your plan as the market evolves.
🕶️ Stay ready for the next master plan... Until then, keep your charts clean and your stops tight. 🕶️💣📉
– Thief Trader Out 🐱👤🚀

EURUSD First of August The information and publications are not meant to be, and do not constitute, financial, investment, trading, or other types of advice or recommendations.
Have a nice w/e ahead.

Thoughts on EU/USHave some ideas bout this chart. Dont want talk too much& If ur interested in. Just read previous takes in my acc. Feel to cozy, might delete later >/>
EURUSD Sell Explained...+100 pips, 3 TPS, 1 StrategyHey Rich Friends,
Happy Wednesday. I wanted to updated you on the EURUSD sell idea I posted a few days ago:
All of my TPs were hit and I was able to secure more than 100 pips in this trade.
Here is a synopsis of my strategy:
- Draw support and resistance lines on 2-3 time frames
- Wait for a break of structure above or below previous support or resistance to enter
- Check confirmations on the stochastic (buy = if stoch is facing up and the blue line is on top. sell = if stoch is facing down and the orange line is on top)
I will make a full strategy video soon, but that is basically it. I follow the same process over and over again because it works.
If this video was helpful or you have any questions, let me know below in the comments.
Peace and Profits,
Cha

ELLIOTT WAVE EURUSD Daily update
EW Trade Set Up daily
minute ((i)) seems finished
H4 scenario 210725:
the price upward movement from 1.1557 area on 17/07/25 has broken decisively 1.1684-1.1705 area but it had not the
strenght to go further so that the lagging span (green line) could break upward the leading span B (red line).
A decrescent high has been registered at 1.1800 area on 24/07/25.
In this new scenario it looks like that the impulsive movement that started from 1.0180 on 13/01/25
finisced at 1.1834 on 010725 in the minute wave (i). (EWO divergence, break down of the upward (ii)/(iv) channel).
So i have to register that a correction to minute wave ((ii) has started
key levels VP area
1.1800
1.1370 POC
1.0850
note :
monitor the price reaction at any supports level: VP area and LVN
