EURUSD Bear dominating the market30th June Daily candle closed with strong bearish.
we could observed a drop-base-drop candle pattern in a lower time frame.
for today plan:-
i will wait at the "base" area around 1.147*** area for the bearish signal.
calculate your own risk & reward.
Good luck
USDEUX trade ideas

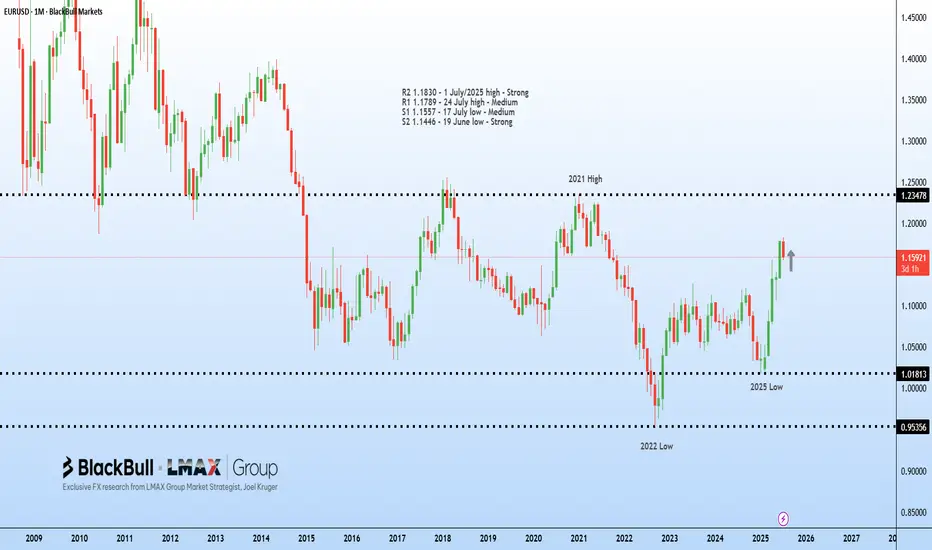
EU faces new tariffs, Euro slides | FX ResearchThe euro surged in early Asian trade following the US–EU trade agreement announced over the weekend, but has since faced consistent selling pressure, eventually triggering stop-loss orders below 1.17, reflecting a classic buy-the-rumour, sell-the-fact market reaction.
The deal imposes 15% tariffs on most EU exports to the US, down from 25% for automobiles, while excluding pharmaceuticals and medical metals, with semiconductors still under review. The EU committed to buying $750 billion in US energy products over three years, investing further in the US, opening markets with zero tariffs, and purchasing significant US military equipment.
The EU trade commissioner noted the deal provides business predictability despite higher tariffs than the previous 4.8% average. German automakers, including Mercedes-Benz, acknowledged some relief but highlighted ongoing costs, while Spain's PM offered lukewarm support.
Meanwhile, South Korea is preparing a trade package focusing on shipbuilding cooperation, and US–China tariff talks resume in Stockholm. The US dollar's trajectory may shift with this week's FOMC updates, Q2 GDP, core PCE, inflation, and non-farm payrolls data. While a light-data Monday features only the Dallas Fed manufacturing survey.
Exclusive FX research from LMAX Group Market Strategist, Joel Kruger
Eurousd techinical analysis.Eurousd techinical analysis next move posibale at h2 time frame.not finchinal advice.

LONG TRADE PLAN (RENKO STRUCTURE)
🧱 LONG TRADE PLAN (RENKO STRUCTURE)
🔹 Entry: 1.1740
🔹 SL: 1.1690 (50 pip risk)
🔹 Style: 100-pip Renko Target Ladder
🔹 Bias: Macro uptrend forming — targeting Fib 100 and above
⸻
🎯 TARGET LADDER + STRATEGIC WHY
TP1 — 1.1800 📈
〰️ Brick 18 confirm — breakout ignition point
+60 pips | R:R 1.2:1
TP2 — 1.1900 💰
〰️ Mid-run exit — early profit-taker zone
+160 pips | R:R 3.2:1
TP3 — 1.2000 🧲
〰️ Full Fib 100 — magnet + reversal hotspot
+260 pips | R:R 5.2:1
TP4 — 1.2100 🚀
〰️ Post-Fib breakout — trap zone for late shorts
+360 pips | R:R 7.2:1
TP5 — 1.2200 🔄
〰️ Minor stall zone — profit lock-in level
+460 pips | R:R 9.2:1
TP6 — 1.2300 🔥
〰️ Thin continuation — extension in motion
+560 pips | R:R 11.2:1
TP7 — 1.2400 ⚠️
〰️ Trend exhaustion zone — monitor Renko structure
+660 pips | R:R 13.2:1
TP8 — 1.2500 🧠
〰️ Round number + gamma cluster — exit partials
+760 pips | R:R 15.2:1
TP9 — 1.2600 🪤
〰️ Liquidity sweep — trap and fade zone
+860 pips | R:R 17.2:1
TP10 — 1.2700 🏁
〰️ Full cycle climax — final high probability exit
+960 pips | R:R 19.2:1
⸻
🧠 Plan:
• Go 50% at 1.1740, scale 50% after 1.1800 confirm
• SL to BE after TP2
• Trail by 1 Renko brick after TP3
• Exit final ladder by TP8–TP10 unless macro reasserts
🔐 Invalidation: Close below 1.1700 = full reset

Important week for EURUSDOn Friday, EURUSD reached a support level and bounced off it.
This week, all eyes are on the Fed's interest rate decision on Wednesday and the U.S. jobs data on Friday.
The trend remains bullish for now, and the upcoming news will likely determine the next move.
Today and tomorrow, the market may stay in a range as traders wait for the key events.
Don't rush into new trades and avoid using large position sizes!

EURUSD has broken & hovering near resistance.EURUSD has broken & hovering near resistance. US dollar has started weaking again due to Tariff war.

Sell EURUSD after BRD the level of 1.15This market is started the down move by forming a very
strong bearish bars
break down the level 1.15
so I opend short with RR=1:2.6
then after a 100 points in profit I added to
this short position another one with RR=1:2

EUR/USD SHORT — FRACTAL RENKO TRAP REVERSAL
🔻 EUR/USD SHORT — FRACTAL RENKO TRAP REVERSAL
Codex Execution | Tier 2 Rejection | Macro Gravity | TP1–TP10 Ladder Active
⸻
📍 TRADE SNAPSHOT
• Entry: 1.1665
• Stop Loss (SL): 1.1800 ✅ (Tier 2 pivot)
• Macro Direction (T1): 📉 Down
• Tier 2 Structure: 🔻 Bearish Flip Confirmed
• Execution Tier: Tier 2 rejection → continuation active
• Risk Size: ✅ Full position (SL = 135 pips)
• Trade State: ⚔️ Armed
• Trail SL: Activated post-TP1 → using Tier 3 pivots
⸻
🎯 TP LADDER MAP (Fixed Tier 2 Grid)
Level Price Status
🥇 TP1 1.1600 ✅ Hit
🥈 TP2 1.1500 ✅ Hit
🥉 TP3 1.1400 ⏳ Pending
🎯 TP4 1.1300 ⏳ Pending
🧨 TP5 1.1200 ⏳ Pending
💎 TP6 1.1100 ⏳ Pending
🔓 TP7 1.1000 ⏳ Pending
🔻 TP8 1.0900 ⏳ Pending
🔻 TP9 1.0800 ⏳ Pending
💀 TP10 1.0700 ⏳ Pending
🧠 TP ladder is mapped to Tier 2 (100 pip) round-number bricks — not floating from entry — per Codex IV structure logic.
⸻
🧠 STRUCTURAL RATIONALE
• Tier 2 Fib trap rejection confirmed @ 1.1665 (within 127.2–161.8% extension)
• Downtrend continuation brick confirmed below trap zone
• Tier 1 macro trend = bearish
• TP1 + TP2 already hit
• Trade now approaching TP3 zone (1.1400)
⸻
⚔️ TRADE MANAGEMENT PLAN
• ✅ SL trailed to breakeven after TP1
• ✅ Partial scale-out at TP1 / TP2
• 🔁 Add-on only allowed if:
• Retest rejection near 1.1500–1.1540
• OR clean body close below 1.1440
• ❌ No re-entry inside 1.1440–1.1500 dead zone
⸻
✅ EXECUTION FILTER STATUS
Condition Status
T1–T2 Alignment ✅
Trap Rejection Confirmed ✅
SL outside structure ✅
TP1–TP2 Reached ✅
Entry Trigger: Brick Close ✅
Macro Compression ❌
Time Cutoff (Pre-3PM EST) ⚠️ Confirmed OK
⸻
#EURUSD #FractalRenko #Tier2Trap #TP1toTP10 #CodexExecution #RenkoTrading #ShortSetup #InstitutionalFilter #TradingViewIdea #TrailLogic #RewardLadder
⸻

EURUSD DOWN SIDE The dollar index (DXY00) on Tuesday rose by +0.22% and posted a 5-week high. The dollar has carryover support from Monday following the EU-US trade deal that is seen as favoring the US. Also, expectations for the Fed to keep interest rates unchanged at the end of Wednesday's 2-day FOMC meeting are supportive of the dollar. The dollar extended its gains after the US Jun advance goods trade deficit unexpectedly shrank, a supportive factor for Q2 GDP, and after July consumer confidence rose more than expected.


EURUSD Sell SetupHello traders!
Price has strong bearish momentum and is expected to move lower.
We're selling here with the target around the higher timeframe demand zone.
Manage your risk and trade safe!

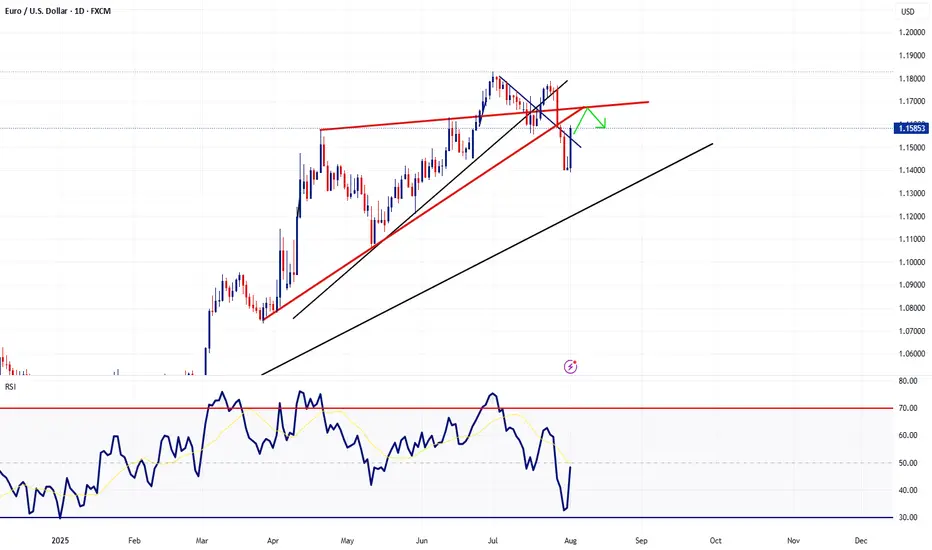
EUR/USD BULLISH BIAS RIGHT NOW| LONG
Hello, Friends!
EUR/USD pair is in the uptrend because previous week’s candle is green, while the price is obviously falling on the 1D timeframe. And after the retest of the support line below I believe we will see a move up towards the target above at 1.179 because the pair is oversold due to its proximity to the lower BB band and a bullish correction is likely.
Disclosure: I am part of Trade Nation's Influencer program and receive a monthly fee for using their TradingView charts in my analysis.
✅LIKE AND COMMENT MY IDEAS✅

EUR/USD ADDED TO THE WATCHLISTPrice has fallen dramatically so we are on watch for a possible reversal (maybe short term) pattern to appear. Momentum is very low and looks prime to go up. We will need a hammer candle, with an engulfing confirmation candle, strong volume and in a best case scenario strong support to come off of. We will keep watching this one.

EURUSDUS reaching trade deal with other countries and this and given to the index rally. We are taking an opportunity in the retracement

EURUSD LOSSES BULLISH MOMENTUM. WHERE TO GO?EURUSD LOSSES BULLISH MOMENTUM. WHERE TO GO?
The asset didn't reach the local resistance of 1.18300 and started to consolidate before reaching this level. RSI shows weakness of the impulse on 4-h chart, as well as MACD is in the red zone. Therefore, we expect the price to slowly decline towards local trendline, where SMA200 is situated.

EURUSD Did Not Like the EU–US DealThe heavily one-sided EU–US deal has put negative pressure on EURUSD. Ahead of a crucial week filled with major events, including GDP data from both the Eurozone and the US, the PCE report, payrolls, and meetings from the FOMC and BOJ, EURUSD has broken a short-term head and shoulders formation. The pattern's target is near 1.1610.
A retest of the broken support is possible and could even extend to 1.1725. However, unless sentiment changes due to some news, this move may offer only a selling opportunity. The downward trend could also continue without pause.
Options market activity suggests that the 1.16 to 1.18 range is viewed as a "safe zone," with large players likely aiming to keep EURUSD within this band for the week. If the head and shoulders target is reached, EURUSD might stabilize and bounce around the 1.16 level.

EURUSD EURUSD is on an exhaustion trend after a long buy, taking a sell correctional move. The market objective yet to be fulfilled, we continue the sells the the objective is fulfilled. Having a valid sell structure that lead to a break of structure, having a structural liquidity making the low a protected low. Looking to take a sell from the supply zone(strong low) and target the weak high

EURUSD: A Bearish Continuation?From my previous analysis, we anticipated a short-term decline on the EURUSD for a Daily bearish pullback. Price respected our zone and made a even stronger sweep before plummeting as forecasted.
Currently, price has returned to mitigate that liquidity sweep. Given the prior impulsive bearish move—which this current bullish correction stems from—we expect another drop, targeting the weak structure below for a potential liquidity grab or continuation.
We'll continue to monitor how price behaves around the current levels, but unless there's a significant shift in momentum, our bearish outlook remains valid. ✅
Follow us for more updates. 🔔
See you on the next one. 🫡

EURUSD - Counter trend idea.-In the monthly (higher timeframes), EURUSD is bullish.
-In the weekly timeframe, the was a momentous price reaction at the 1w BoS, making it a very strong area of liquidity and unlikely to be broken further in the short term period but maybe tested.
In the the daily and timeframe EU is bearish, but it is just a possible higher timeframe retracement, but still we are looking for opportunities in that retracement too.
-Above is our low probability low risk idea. We are only risking 10 Pips.

EURUSD - Scaling into Confluence ZoneTaking a look at EURUSD on the daily timeframe we had quite the rebound in EURUSD last Friday following the NFP report. However price action is now heading towards a cluster of resistance levels which is why I'm implement my scaling in technique using a specially designed and programmed EA that i use for MT5.
== TRADE PLAN ==
Scale-in with short positions and target a 0.5% growth on the account. In other words, once the basket arrives in profit by 0.5% CLOSE ALL.
Trade Safe - Trade Well
EURUSD Current Market Situation Technical Analysis Current Market Situation
The chart displays a Double Top pattern, a strong bearish reversal signal that often indicates the start of a downward move.
The price has already broken the neckline, and it is now approaching a retest of both the neckline and the broken trendline, which serves as a critical resistance area for potential bearish continuation.
Key Zones
Neckline Retest Zone: Around 1.1600, acting as immediate resistance.
Trendline Retest Zone: Between 1.1670 – 1.1700, serving as an additional resistance level to confirm the bearish bias.
Potential Scenarios
✅ Bearish Scenario (Preferred):
If price respects the retest zones and fails to break higher, we may see a decline toward:
Target 1: 1.1500
Target 2: 1.1400
Target 3: 1.1300
⚠ Bullish Scenario (Alternative):
A clear breakout and daily close above 1.1700 would invalidate the bearish outlook and could lead to a bullish reversal.
Conclusion
The market structure currently favors the bears.
Rejection from the neckline or trendline retest zones will provide a strong confirmation for sell positions.
⚠️ Trade at your own risk – We are not responsible for any losses.

6F EUR/USD Trade Plan (15-Minute Chart)Structure & Fibonacci Setup
Swing low at 1.14994 (Aug 1 15:30) → swing high at 1.15935 (Aug 4 09:30).
Draw 0–100% retracement; project extensions beyond 100% for targets (Murphy, 1999).
Entries
First Scale-In:
Sell 1 contract at the 14.6% retracement (~1.15835).
Full Position:
Sell 10 contracts at the Fib 61.8–161.8% extension confluence (~1.17103).
Profit-Taking Levels
TP 1: Fib 78.6% extension at 1.14141
TP 2: Fib 100% extension at 1.12778
TP 3: Fib 161.8% extension (“risk-off” zone) at 1.10559 (Smith, 2023)
Risk Management
Stop-Loss: Above the 200% extension (~1.17857), just beyond the recent swing high (CME Group, 2025).
Position Sizing: Scale in to control risk; initial 1-lot entry limits drawdown if confluence fails.
Rationale
Anticipate Monday risk-off flows to strengthen USD and push EUR/USD lower.
Multi-leg entries align with high-probability Fib confluence zones and macro USD bias (Murphy, 1999; Smith, 2023).
References
CME Group. (2025). Euro FX Futures contract specifications. Retrieved from www.cmegroup.com
Murphy, J. J. (1999). Technical analysis of the financial markets: A comprehensive guide to trading methods and applications. New York Institute of Finance.
Smith, A. (2023). Risk-off and currency correlations. Journal of FX Markets, 5(2), 45–60.

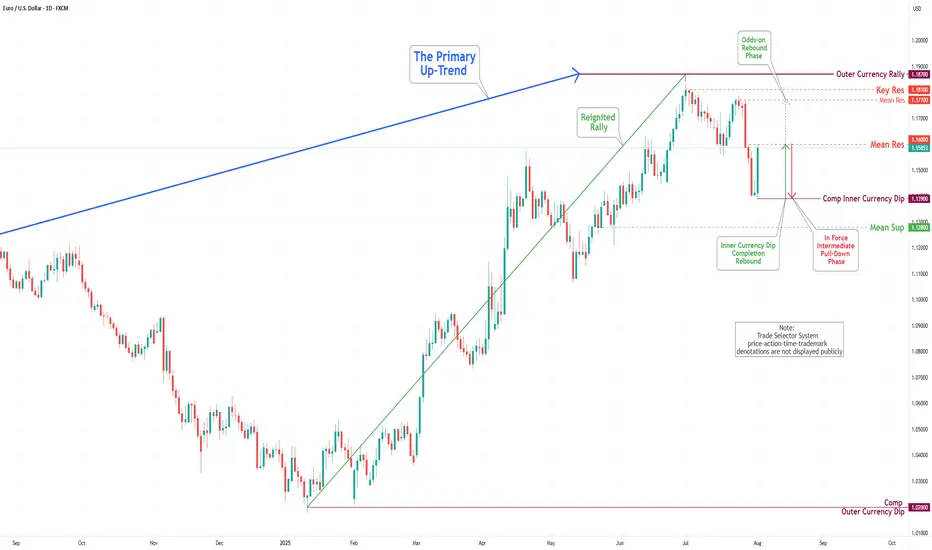
EUR/USD Daily Chart Analysis For Week of August 1, 2025Technical Analysis and Outlook:
In this week's trading session, the Euro experienced a significant drop, reaching the 1.139 level, and completing what is referred to as the Inner Currency Dip. As a result of the completion, the currency reversed direction and made a strong rebound, hitting the Mean Resistance level at 1.160. Recent analyses suggest that the Euro is likely to enter a sustained downward move after retesting the Mean Resistance at 1.160, with the target set to revisit the completed Inner Currency Dip at 1.139. However, it is essential to consider the possibility of continued upward momentum towards the Mean Resistance level of 1.177. Such a movement could trigger a significant rebound and lead to the completion of the Outer Currency Rally at 1.187.