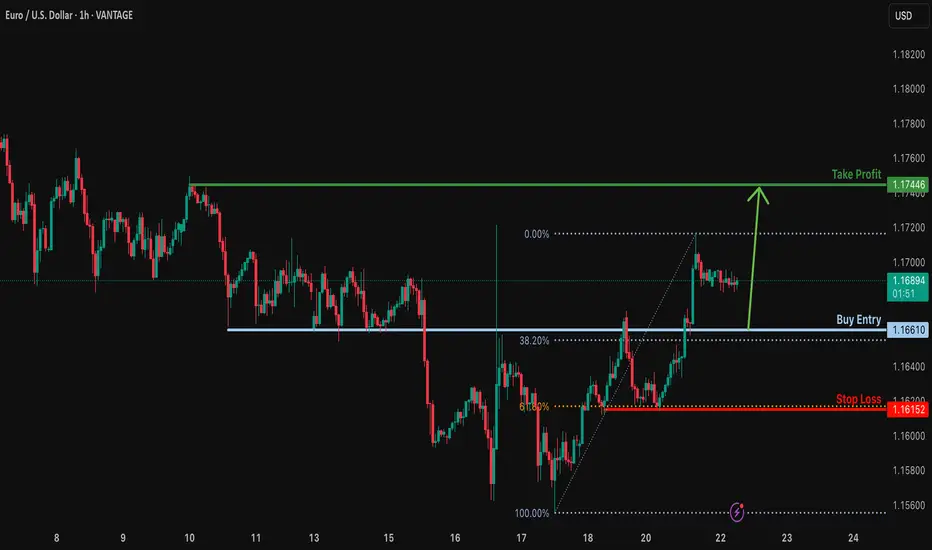
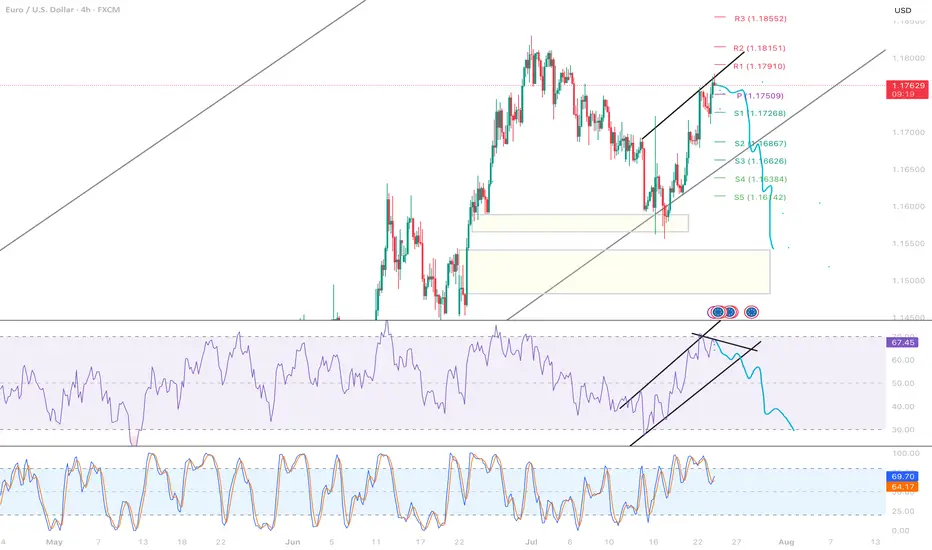
Bullish bounce off overlap support?EUR/USD is falling towards the support level which is an overlap support that aligns with the 38.2% Fibonacci retracement and could bounce from this level to our take profit.
Entry: 1.1661
Why we like it:
There is an overlap support that lines up with the 38.2% Fibonacci retracement.
Stop loss: 1.1615
Why we like it:
There is a pullback support that aligns with the 61.8% Fibonacci retracement.
Take profit: 1.1744
Why we like it:
There is a pullback resistance.
Enjoying your TradingView experience? Review us!
Please be advised that the information presented on TradingView is provided to Vantage (‘Vantage Global Limited’, ‘we’) by a third-party provider (‘Everest Fortune Group’). Please be reminded that you are solely responsible for the trading decisions on your account. There is a very high degree of risk involved in trading. Any information and/or content is intended entirely for research, educational and informational purposes only and does not constitute investment or consultation advice or investment strategy. The information is not tailored to the investment needs of any specific person and therefore does not involve a consideration of any of the investment objectives, financial situation or needs of any viewer that may receive it. Kindly also note that past performance is not a reliable indicator of future results. Actual results may differ materially from those anticipated in forward-looking or past performance statements. We assume no liability as to the accuracy or completeness of any of the information and/or content provided herein and the Company cannot be held responsible for any omission, mistake nor for any loss or damage including without limitation to any loss of profit which may arise from reliance on any information supplied by Everest Fortune Group.
USDEUX trade ideas

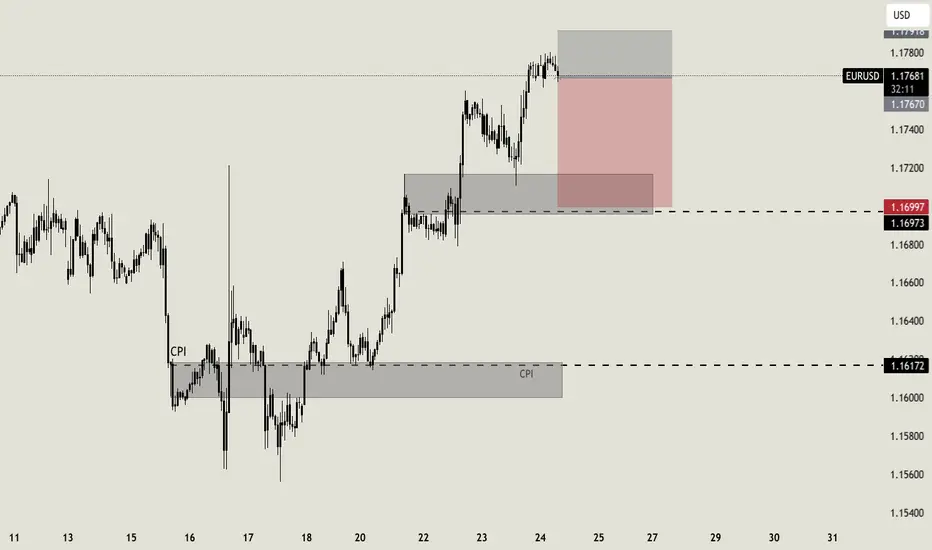
EURUSD : Status @ 25/7Direction: Sell
Signal triggered: 25/7/2025
Stop when:
a) Stop Loss @ 1.1790; or if
b) Buy signal triggered
Action:
Sell the rally
Good luck.
P/S: It seems that 1.1790 is a good resistance line as anticipated. The price may reach as low as 1.1500, which will serve as the next support level. Then we wait there for the next sell or maybe buy signal!
And a BIG congratulation to those who sold @ D - 1.1780 :-)

EUR/USD - Sells on H1EUR/USD broke an Ascending Channel and have also shifted the trend downwards.
We will wait for a pullback to 0.5 - 0.618 Fib level for entry with the SL placed above the last high

EURUSDEURUSD needs one more up after correction to break last week's high.
Disclosure: We are part of Trade Nation's Influencer program and receive a monthly fee for using their TradingView charts in our analysis.

eurusd sell tradeThe Relative Strength Index (RSI) is showing a downward trend, indicating weakening momentum. Additionally, the Moving Average Convergence Divergence (MACD) is showing a bearish crossover, further supporting the potential for a downward move

EURUSD: NEW WEEK TECHNICAL BIAS (MARKET OPEN)REVIEW SUMMARY
▪︎ On the Higher Timeframes (HTFs), the Buy-Side Bias Environment (BBE) remains intact, with no confirmed breach of the ongoing Ascend Sequence.
▪︎ However, the 4H chart reveals a developing Descend Sequence within a steep, channel-like structure, recently triggering a Rejection Block (Activated).
▪︎ If this Rejection Zone holds, I expect a potential Trend Shift that resumes the broader Ascend Sequence.
▪︎ Otherwise, a decline into the discount region near 1.16523 may unfold before any significant rally toward the primary Target Zone.
▪︎ Invalidation occurs with a structural breakdown to and below 1.15571, which opens the door toward the pending ARBs lower.
📌 This is not trade advice. Just technical observations and market perspective. Validate independently before acting.
#IntelEdgeProtocol

Lingrid | EURUSD Potential Surge Following Channel BreakoutFX:EURUSD is consolidating after bouncing from a key confluence of support around 1.16000 and forming a higher low within the upward channel. The recent corrective pullback through a downward channel now appears complete, with bullish structure resuming. Price is likely to advance toward the 1.18300 resistance as long as the 1.15900 zone holds. Momentum favors a continuation of the A-B-C and trend continuation sequences already established.
📉 Key Levels
Buy trigger: Break above 1.16500
Buy zone: 1.16000–1.16250
Target: 1.18300
Invalidation: Close below 1.14500
💡 Risks
Failure to break the corrective channel resistance
Bearish divergence on lower timeframes
Broader USD strength reversal
If this idea resonates with you or you have your own opinion, traders, hit the comments. I’m excited to read your thoughts!

EURUSD BUYTapped into an orderblock on the 4hr time frame, so i scaled down to the 30mins to look for a buy entry
Entry : 1.17172
TP : 1.17891
SL : 1.17001

EURUSD Intraweek tradeI know, it's Thursday, but i still think that this can be a good intraweek trade. I expect the price to perform a correction here, till the support area at 1.17. If my analysis is correct i expect the price to be there later today or tomorrow morning
EUR/USD Set to Fly – Don’t Miss This Perfect Channel Breakout!Hi traders!, Analyzing EUR/USD on the 30-minute timeframe, we can observe that price is respecting the ascending channel and reacting to the dynamic trendline support (green dashed lines). A recent bounce suggests a potential bullish continuation within this structure.
🔹 Entry: 1.17399
🔹 Take Profit (TP): 1.17640
🔹 Stop Loss (SL): 1.17056
Price remains above the 200 EMA, confirming a bullish environment. The bounce aligns with the lower boundary of the channel and follows a short consolidation period, indicating buying pressure. The RSI also shows signs of recovery after approaching oversold levels, supporting the idea of upward momentum.
This long setup offers a favorable risk/reward ratio and aims to capture continuation toward upper channel resistance.
⚠️ DISCLAIMER: This is not financial advice. Trade at your own risk and always use proper risk management.

EUR/USD Daily Chart Analysis For Week of July 25, 2025Technical Analysis and Outlook:
During the previous week's trading session, the Euro experienced an increase following the completion of the Inner Currency Dip at the 1.156 level. It subsequently surpassed two significant Mean Resistance levels, namely 1.167 and 1.172; however, it reversed direction by the conclusion of the trading week. Recent analyses indicate that the Euro is likely to undergo a sustained downward trend, with a projected target set at the Mean Support level of 1.169 and a potential further decline to retest the previously completed Currency Dip at 1.156. Nonetheless, it remains essential to consider the possibility of renewed upward momentum towards the Mean Resistance level of 1.177, which could initiate a preeminent rebound and facilitate the completion of the critical Outer Currency Rally at 1.187.

Smart Money Concepts (SMC) Strengths of the analysis:
1. Break of Structure (Choch + Bos)
A break of Structure (Bos) is clearly identified after s Choch, indicating the star of a new bearish structure.
2. OB 1H and FVG as an entry zone:
the price returns to a block order (OB-1H) within the resistance zone, which is an excellent institucional area to look for a short entry. Furthermore, the presence of a FVG on the 1H provides additional confluence.
3.Projection toward the last LL (Lower Low):
It is very accurate to project the bearish continuation toward the support zone, which coincides with the last LL, an area with a high probability of being mitigated.....

Eurousd techinical analysis.Eurousd techinical analysis next move posibale at h1 time frame not finchinal advice.

EURUSDPossible sell opportunity. Waiting for price to make a retest + bearish confirmation on the smaller time frame before we go short.
@musehanezwothe

EURUSD –Bearish Pressure Below 1.1780 |Channel Structure HoldingEURUSD | UPDATE
The price is currently respecting the descending channel, failing to close above the pivot zone (1.1780 – 1.1750) and rejecting from the upper boundary of the structure.
Bias: Bearish While Below 1.1780
As long as price remains under the pivot zone and inside the descending channel, the bearish pressure is likely to persist. A potential correction may retest 1.1750 – 1.1730 levels before continuation.
Next Targets:
1.1700 – Minor support
1.1684 – Short-term level
1.1627 – Mid-target
1.1557 – Main support zone and channel bottom
Invalidation:
Clear breakout and H4 close above 1.1780 would invalidate the short bias and open a path toward 1.1820 and possibly 1.1882.
Structure: Bearish inside descending channel

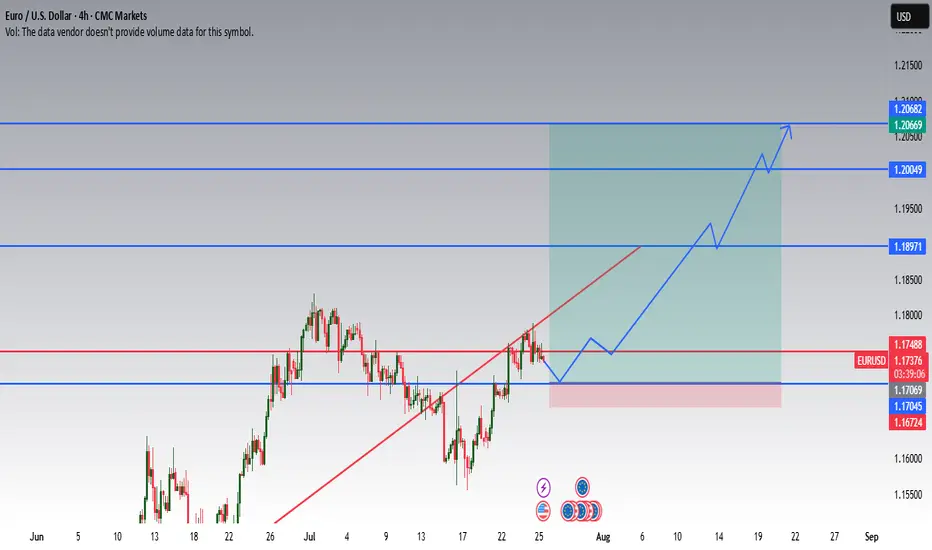
EURUSD Long Setup: Technically and Fundamentally Supported Push 📈 I'm expecting a climb of this pair due to weakening USD.
This idea is based on both technical and fundamental parameters:
🔍 Fundamentals
ECB kept rates unchanged, signaling stability and reluctance to tighten policy further.
FED is expected to cut rates in 5 days, as inflation eases and growth concerns rise in the US.
A weaker dollar is likely to support EURUSD strength.
1.20 is a psychological and political level – above that, European exporters begin to suffer, and ECB might intervene verbally or with policy action.
🧠 Technical Setup
Price has reclaimed a key support zone around 1.17069 – 1.17488, with consolidation signaling accumulation.
Break of the descending trendline shows bullish intent.
Next major resistance lies at 1.18971, followed by 1.20049 – a strong historical level and likely ECB reaction zone.
Final target at 1.20669 – 1.20682 marked by previous highs.
Entry Zone: 1.17045–1.17488 (current area of interest)
Stop Loss: Below 1.16724
Targets: 1.18971 / 1.20049 / 1.20669
💬 Feel free to monitor price action at key zones. Entry should be based on reaction at support or a confirmed breakout. This is not a blind entry setup.
📅 If the FED cuts rates as expected, USD weakness could accelerate the move.
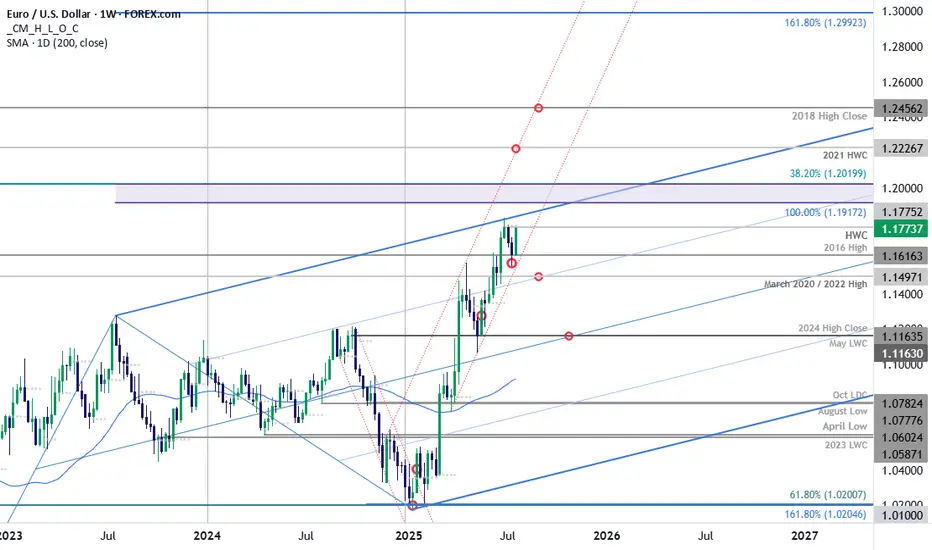
EUR/USD Surges into Resistance Ahead of ECBEuro is poised to snap a two-week losing streak with EUR/USD up more than 1.2% since the Sunday open. The advance takes price back into weekly resistance ahead of tomorrow’s European Central Bank rate decision and the focus now shifts to the weekly close for guidance.
Euro plunged more than 2.3% off the June high with price briefly registering an intraweek low at 1.1557 before rebounding. The rally takes EUR/USD into resistance at the objective high-week close (HWC) / high-close at 1.1775- looking for a reaction off this mark with a weekly close above needed to keep the immediate advance viable into the close of the month.
Initial weekly support remains with the 2016 swing high at 1.1616 with the medium-term outlook still constructive while above the March trendline (red). Ultimately, a break below the 2020 / 2022 highs at 1.1497 would be needed to suggest a more significant high is in place / a larger correction is underway with subsequent support seen at the 2024 high close / May low-week close (LWC) at 1.1164.
A breach / close above this pivot zone exposes the upper parallel (blue), currently near 1.1840s, with the next major technical consideration eyed at 1.1917-1.2020- a region defined by the 100% extension of the 2022 advance and the 38.2% retracement of the 2008 decline (area of interest for possible top-side exhaustion / price inflection IF reached). Subsequent resistance objectives eyed at the 2021 HWC at 1.2227 and the 2018 high-close at 1.2456.
Bottom line: Euro rebounded just ahead of the March uptrend with the rally now testing the yearly high-close ahead of the ECB- watch the Friday close with respect to 1.1775. From a trading standpoint, a good zone to reduce portions of long-exposure / raise protective stops- losses would need to be limited to this week’s low IF price is heading higher on this stretch with a close above the upper parallel still needed to fuel the next major leg of the advance.
-MB
Just looking for a big target, probably we will see big buyersTrends and legs are going to see high prices in most timeframes

EURUSD SHORT. DXY UP. Possible scenario for short term for EURUSD, Short on place for possible target 1.1540 and we might have a bounce from there ,a whole week green for DXY before any downfall
EURUSD--LONG-- 26-07-25--2 weeks before tested end bounced from monthly support level 1.15652
--last week was a rising week.
--upward movement will likely to continue this week too.
--best enrty level is around 1.17096


I'm optymist. 1.183-1.185 In front us3 year channel saying that we should to touch it.
Yellow line.
Before us
In my opinion before us is level. 1.18-1.20 before bigger correction until 1.12 even.
Then in few month i see 1.4-1.6
