EURUSD – Bulls Still in Control, Trend ResumesIn my previous EURUSD analysis, I pointed out that the pair was nearing an important confluence support around 1.1620, and that – given the overall bullish trend – this zone could offer solid long opportunities.
What followed?
The market briefly dipped below that zone, even challenging the psychological 1.1600 round number. But instead of breaking down, bulls regrouped, stepped in with force, and pushed the pair aggressively higher.
📍 At the time of writing, EURUSD is trading at 1.1770, and my long trade is running with a comfortable 150 pips profit.
🔍 W hat’s Next?
The current structure suggests a continuation of the uptrend, and the logical technical target is the recent high at 1.1830.
Until proven otherwise, this is still a buy-the-dip market.
✅ Buying around 1.1700 could be a valid setup, especially if we see buying power on the intraday chart
⚠️ The Warning Sign
Despite the bullish bias, keep in mind:
If EURUSD drops and closes below 1.1670, the structure begins to shift — and this could signal a deeper correction or even trend reversal.
📌 Until then, the bias remains bullish, dips are to be watched for entries, and 1.1830 is the next checkpoint.
D isclosure: I am part of TradeNation's Influencer program and receive a monthly fee for using their TradingView charts in my analyses and educational articles.
USDEUX trade ideas

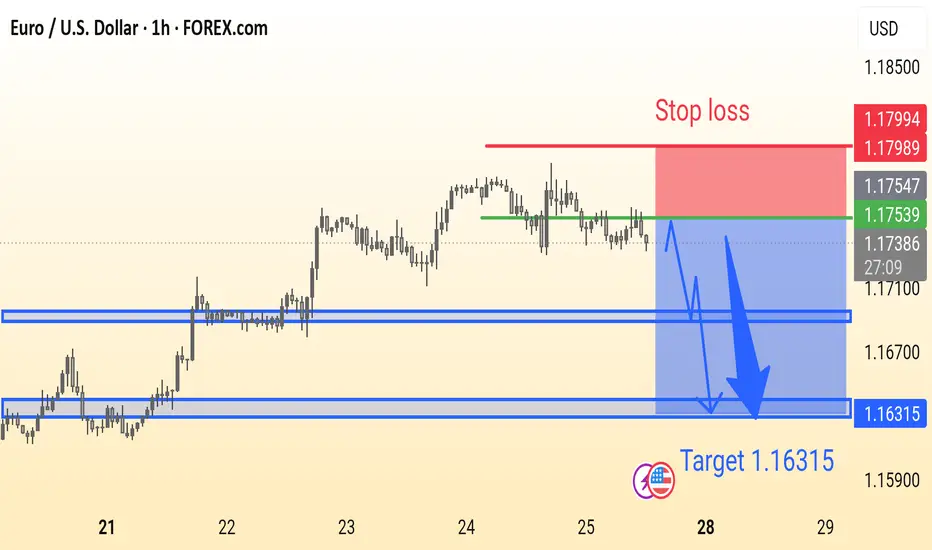
EURUSD Analysis is ReadyEUR/USD Trade Idea (1H Chart):
Price is ranging below resistance with a potential bearish breakout. Suggested Sell near 1.1753 with Stop Loss at 1.1799 and Target at 1.16315. Strong support zones marked for possible reaction.
Quick short on the pull back of EURUSDPrice touched a supply zone and formed a break of structure on the 1 hour. I may have missed the entry, but i placed a sell limit with a TP to the imbalance below.

EURUSD pullbackYesterday, EURUSD attempted to continue its bullish move but was rejected at 1,1788.
Keep an eye on whether it has the strength for another push higher. If it fails again, a correction is more likely to follow.
The first support levels to watch are 1,1699 and 1,1644.
Next week, the FED’s interest rate decision is due.
That news will likely determine both the direction and timing for entry.


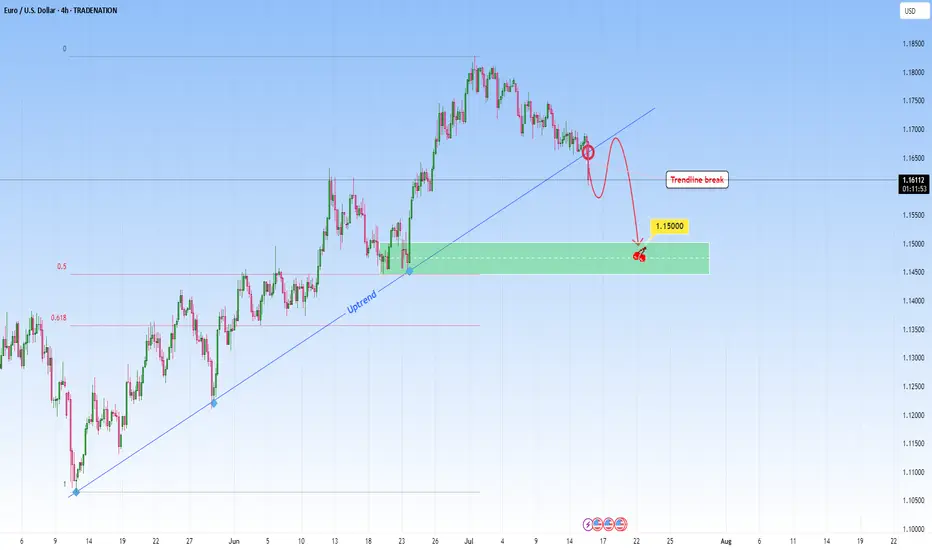
EURUSD: Sell Opportunity after Trendline breakEURUSD was in a steep uptrend but it might stop with this recent break through the uptrend. A break like this one on a strong trendline that had multiple touches, indicates either a potential reversal or major pause in the trend. This candle that broke the trendline signals the first hint of structural change.
I will be waiting for a retest and look to get involved in a short setup.
Ideally, what I look for in retests is to be met with a confirming candle. This would confirm the sellers have taken over and validate the change from uptrend to potential downtrend or consolidation phase.
My target would be around 1.1500.
Just sharing my thoughts for the charts, this isn’t financial advice. Always confirm your setups and manage your risk properly.
Disclosure: I am part of Trade Nation's Influencer program and receive a monthly fee for using their TradingView charts in my analysis .
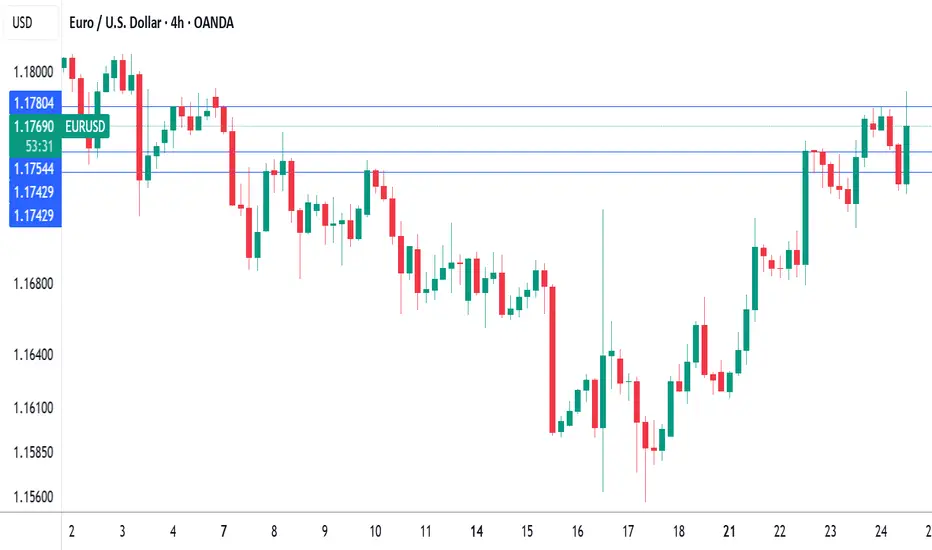
ECB holds rates as expected, Euro steadyThe euro is showing limited movement on Thursday. In the North American session, EUR/USD is trading at 1.1763, down 0.03% on the day. Earlier, the euro climbed to a high of 1.1788, its highest level since July 7.
The European Central Bank's decision to maintain the key deposit rate at 2.0% was significant but not a surprise. With the hold, the ECB ended a streak of lowering rates at seven consecutive meetings. The ECB has been aggressive, chopping 250 basis points in just over a year.
The ECB statement said that inflation was falling in line with the Bank's forecasts and that future rate decisions would be data dependent. President Lagarde has said that the easing cycle is almost down, but the markets are expecting at least one more rate cut before the end of the year.
The European Union and the United States are locked in negotiations over tariffs, with hopes that an agreement can be reached, on the heels of the US-Japan deal earlier this week. US President Trump has threatened to hit the EU with 30% tariffs if a deal is not made by August 1, but there are signals that the sides will agree to 15% tariffs on European imports, as was the case in the US-Japan agreement.
If an agreement is reached, it will greatly reduce the uncertainty around tariffs and will make it easier for the ECB to lower rates and make more accurate forecasts for inflation and growth.
In the US, Services PMI rose to 55.2 in July, up from 52.9 in June and above the market estimate of 53.0. This pointed to strong expansion and marked the fastest pace of growth in seven months. Manufacturing headed the opposite direction, falling from 52.6 in June, a 37-month high, to 49.5. This was the first contraction since December, with new orders and employment falling.
PROFIT TAKING ON EURUSD BUT UPTREND REMAINS INTACT Looking at the daily timeframe of EURUSD we can see that price action didn't take out liquidity at the Blue rectangle zone which was the all time high for EURUSD.
Going forward,I can anticipate signs of profit taking or hedging by market players or institutions but on general basis the uptrend of EURUSD is still intact.
So I will be anticipating a pullback to the desired zones which I indicated with a red rectangle and later we look for buying opportunities.
Targets are:1.15900,1.14900

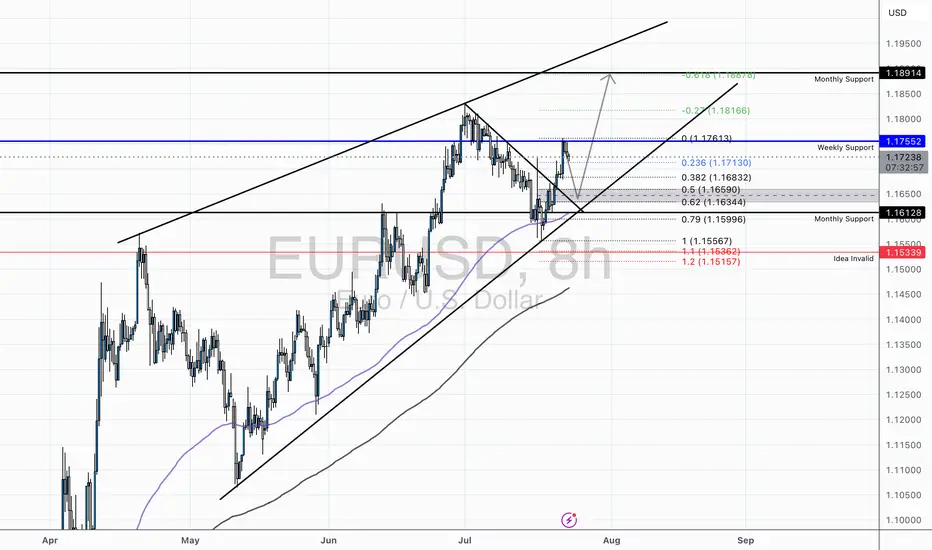
EUR/USD - Holding Bullish Structure Above Key Fibs and TrendlineTechnical Overview:
EUR/USD continues to respect its ascending channel structure, currently rebounding from the lower trendline support while trading above the 50 EMA and 200 EMA. After a healthy retracement to the monthly support (1.16128), the pair has shown strong buying interest, supported by bullish RSI divergence from oversold conditions on the 8H chart.
Key Levels:
Support Zone: 1.1613 – 1.1634 (Fib Cluster + Channel Support + Monthly Support)
Resistance Zone: 1.1755 (Weekly Resistance) followed by 1.1816 (0.27 Fib Extension) and 1.1887 (0.618 Extension)
Invalidation Level: Below 1.1533 (1.272 Fib + Structural Breakdown)
Confluences:
Price broke above a descending correctional trendline, indicating a potential bullish continuation.
Multiple Fibonacci levels (0.382, 0.5, 0.618) have stacked around the previous consolidation area, increasing probability of a sustained move.
RSI bounce from below 40 suggests short-term momentum reversal.
Trade Idea:
We may see a minor pullback into the 1.16344–1.1659 area before a potential continuation higher. Conservative bulls may wait for a retest of this zone with a bullish engulfing or pin bar confirmation before entering long.
Targets:
First target at 1.1755 (prior weekly resistance)
Second target at 1.1816 (Fib extension)
Final target near 1.1887 (major resistance / upper channel boundary)
Risk Management:
A break and close below 1.1533 would invalidate the bullish setup and signal potential bearish pressure returning to the pair.
EURUSD has broken channal and hovering near resistance.EURUSD has broken channal and hovering near resistance.

EUR/USD PROBABLY!Waiting for confirmation on candles and Real Volume 5min or 15min (power of Real Volume)-without real volume I am like a blind man in a dense forest :)
Tools:
- real volume (proper interpretation)
- Fibonacci expansion ABC (an additional, new goal every day)
- Fibonacci retracement (combined with the real volume, it shows me the real probable movement for the next hours and days)
- volume support and resistance levels (confirmation of the price recovery level)
- oversold/overbought index (focusing on 1H and 4H something is already overvalued or undervalued)
- candlestick patterns (my entry point for 5 minutes or 15 minutes candlestick formations confirmed by particularly increasing volume).

EUR/USD – The Cleanest Buy Setup EUR/USD – The Cleanest Buy Setup This Quarter (Wave E Targeting New Highs)
---
📄 TradingView explanation
📊 EUR/USD 4H Chart Analysis
The pair has beautifully respected the corrective channel from Wave C to D and is now preparing for the final leg — Wave E.
🟦 Key Highlights:
🔹 Price bouncing off demand zone
🔹 Tight consolidation near mid-channel = accumulation
🔹 Next targets: 1.1900 / 1.2050
🔹 Bullish continuation expected after liquidity sweep
🎯 The cleanest and most technically sound buy opportunity this quarter — align your longs with the trend before the breakout happens.
💬 Let them call it a bubble — we call it precision and patience. 🧠💸
#ElliottWave #EURUSD #ForexSetups #SmartMoneyMoves
?

EURUSD : What the D saysWhile Buyer may have taken control, it would not be wise to BUY now, as it is too late.
Price is also at the D and resistance @ 1.1790 - Going by the D, a Sell now is possible with SL @ 1.1790/5
We should know very soon if/when the Seller tries to do something.
Good luck.

EURUSD: Will Go Up! Long!
My dear friends,
Today we will analyse EURUSD together☺️
The price is near a wide key level
and the pair is approaching a significant decision level of 1.17201 Therefore, a strong bullish reaction here could determine the next move up.We will watch for a confirmation candle, and then target the next key level of 1.17348.Recommend Stop-loss is beyond the current level.
❤️Sending you lots of Love and Hugs❤️

EURUSD: Long Signal with Entry/SL/TP
EURUSD
- Classic bullish pattern
- Our team expects retracement
SUGGESTED TRADE:
Swing Trade
Buy EURUSD
Entry - 1.1724
Stop - 1.1714
Take - 1.1743
Our Risk - 1%
Start protection of your profits from lower levels
Disclosure: I am part of Trade Nation's Influencer program and receive a monthly fee for using their TradingView charts in my analysis.
❤️ Please, support our work with like & comment! ❤️

EURUSD OUTLOOK On EURUSD, the previous day closed bearish. I then identified the most recent and significant supply and demand zones. After that, I proceeded to map out a possible entry and exit based on price reaction within those key areas.


"EUR/USD Bearish Reversal Setup from Key Resistance Zone"This EUR/USD 1-hour chart suggests a potential bearish reversal from the 1.17730 resistance level. The price has reached a key supply zone, with a marked fair value gap (FVG) and previous break of structure (BOS). The chart anticipates a drop toward the 1.16500–1.16788 support zone, supported by a highlighted short setup.

Bullish momentum to extend?The Fiber (EUR/USD) is reacting off the pivot which is a pullback support that aligns with the 61.8% Fibonacci retracement and could bounce to the 1st resistance.
Pivot: 1.1584
1st Support: 1.1448
1st Resistance: 1.1809
Risk Warning:
Trading Forex and CFDs carries a high level of risk to your capital and you should only trade with money you can afford to lose. Trading Forex and CFDs may not be suitable for all investors, so please ensure that you fully understand the risks involved and seek independent advice if necessary.
Disclaimer:
The above opinions given constitute general market commentary, and do not constitute the opinion or advice of IC Markets or any form of personal or investment advice.
Any opinions, news, research, analyses, prices, other information, or links to third-party sites contained on this website are provided on an "as-is" basis, are intended only to be informative, is not an advice nor a recommendation, nor research, or a record of our trading prices, or an offer of, or solicitation for a transaction in any financial instrument and thus should not be treated as such. The information provided does not involve any specific investment objectives, financial situation and needs of any specific person who may receive it. Please be aware, that past performance is not a reliable indicator of future performance and/or results. Past Performance or Forward-looking scenarios based upon the reasonable beliefs of the third-party provider are not a guarantee of future performance. Actual results may differ materially from those anticipated in forward-looking or past performance statements. IC Markets makes no representation or warranty and assumes no liability as to the accuracy or completeness of the information provided, nor any loss arising from any investment based on a recommendation, forecast or any information supplied by any third-party.

The Mighty US Dollar: At A CrossroadsThe value of the US Dollar currently sits at an interesting place, both from a fundamental and a technical standpoint. Is this the beginning of the end for the Dollar, as the world's reserve currency? Or will America prevail once more?

DeGRAM | EURUSD breakout📊 Technical Analysis
● Breakout – candles have closed twice above the channel roof (black), then retested 1.1690 as support (blue circled zone); the pull-back printed higher-lows along the intraday trend-line, confirming a bullish transition.
● The flag forming beneath 1.1750 measures toward the confluence of the July swing high and rising fork top at 1.1810; invalidation rests at the last swing-low 1.1615.
💡 Fundamental Analysis
● Euro sentiment improves after Euro-area core CPI edged up to 2.9 % y/y while soft US durable-goods orders trimmed 2-yr Treasury yields, narrowing the rate gap.
✨ Summary
Buy 1.1685-1.1700; hold above 1.169 targets 1.175 ➜ 1.181. Exit on an H1 close below 1.1615.
-------------------
Share your opinion in the comments and support the idea with a like. Thanks for your support!

EURUSD BUY SETUPFOLLOW THE PRICE WILL GO UP
BECAUSE WE HAVE PATTERN ON 5 M
WE have strong candle on frame 4h
