EUR/USD TARGET1 TARGET2target no. 1, then target no. 2, meaning continued weakening of the EUR against the USD.
Tools:
- real volume (proper interpretation)
- Fibonacci expansion ABC
- Fibonacci retracement
- volume support and resistance levels
- oversold/overbought index
- candlestick patterns
USDEUX trade ideas

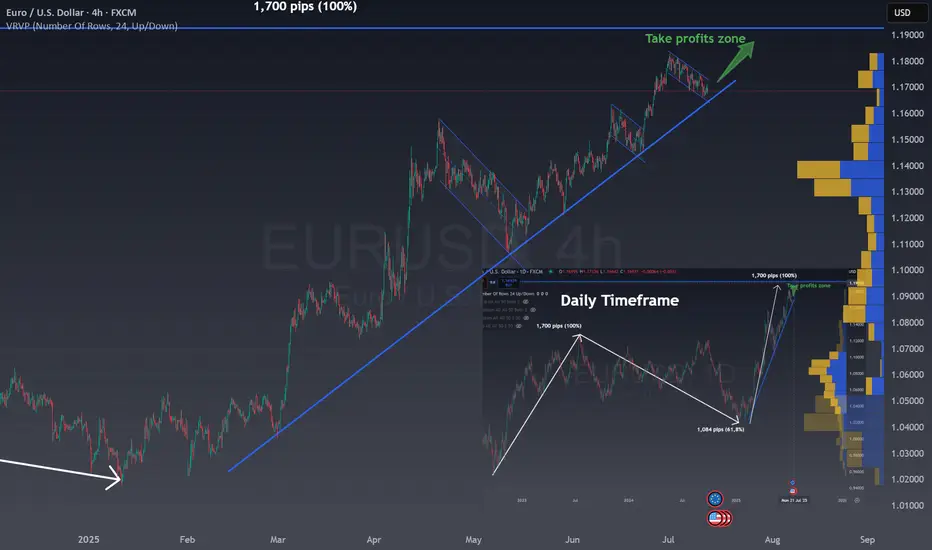
One last rally in EUR/USDIn the right bottom you can see the Daily chart for EUR/USD:
The chart shows the EUR/USD on a daily timeframe.
There was an initial strong rise of 1,700 pips, marked as a 100% move.
After this, the price corrected downward by 1,084 pips, which is 61.8% of the previous rise.
The 61.8% retracement is a common Fibonacci level, often signaling a reversal or pause.
Now, the price is moving up again, following a similar path as the first rise.
The chart suggests a possible new upward move of another 1,700 pips (100%).
A "take profits zone" is marked at the top, indicating a target area for traders.
This pattern reflects how markets often move in waves: trend, correction, and trend continuation.
Fibonacci levels help traders identify potential reversal points.
The chart is used to project future moves based on past price behavior.
The MAIN CHART shows a clear uptrend for EURUSD and the current correction with a flag.
The combination of both patterns give us a clear BUY zone in the channel and using the trend as support or once the channel break upwards.
This is a very good risk reward ratio trade situation where all traders should be!
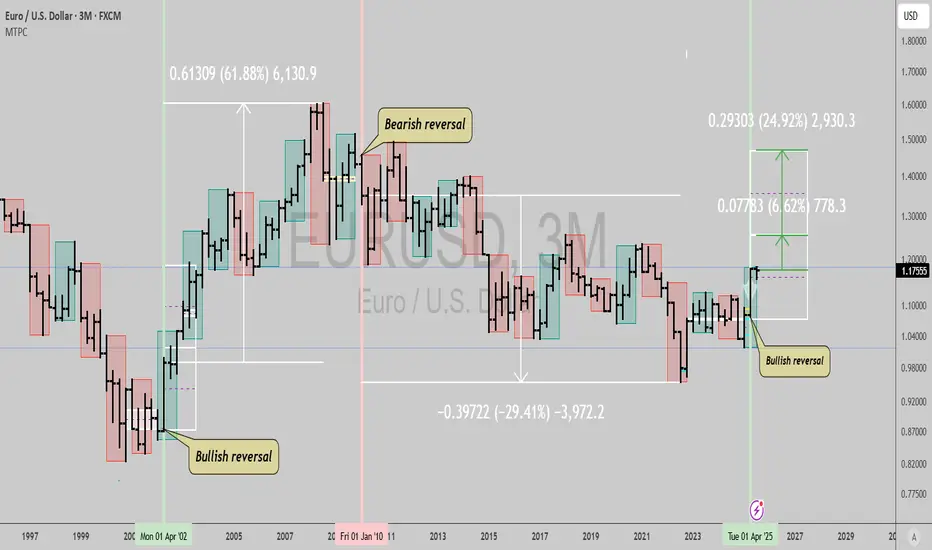
$EURUSD: Massive signal not seen since 2002...GM gents, wanted to bring your attention to the Euro here. This type of signal hasn't happened since 2002, which makes it a very big deal and a very real risk if you're in Europe and holding USD exposure.
We could see a 7% to 25% rally in the coming 2 years from this spot, with pretty high probability, and maybe even a series of similar signals in the same direction for longer like from 2002 to 2010 when the quarterly trend turned bearish decisively.
It's wise to find some way to generate enough returns to cover this currency risk, if you're invested in US stocks, crypto (stables mostly denominated in USD), etc.
Best of luck!
Cheers,
Ivan Labrie.
EURUSD A Fall Expected! SELL!
My dear friends,
Please, find my technical outlook for EURUSD below:
The instrument tests an important psychological level 1.1751
Bias - Bearish
Technical Indicators: Supper Trend gives a precise Bearish signal, while Pivot Point HL predicts price changes and potential reversals in the market.
Target - 1.1708
About Used Indicators:
Super-trend indicator is more useful in trending markets where there are clear uptrends and downtrends in price.
Disclosure: I am part of Trade Nation's Influencer program and receive a monthly fee for using their TradingView charts in my analysis.
———————————
WISH YOU ALL LUCK

EUR/USD – The Cleanest Buy Setup This Quarter
Channel respecting every pivot.
Liquidity beneath – Smart Money needs fuel.
This is not an entry.
This is a precision blueprint.
🔹 Tap into the demand zones at 1.15824 or 1.13862, and ride the next impulse to 1.19614+
Wave D correction underway.
Wave E coming to steal the spotlight.
🧠 Elliott wave structure. Liquidity mapping. Channel geometry.
You’re either chasing price... or anticipating it. I prefer the second.
📍Forex | Where Price Meets Purpose
—
#EURUSDSetup | #WaveEIncoming | #SmartMoneyMoves | #ForexBlueprint | Forex | Trading | #InstitutionalFlow | #LiquidityHunt
---

eur usd shortHi guys i fund this trade for the next hours, the price make a double top with divergence and the double top its confirmed, so lets go to get some money good luck

EURUSD SHORT IDEAFrom my POV theres a high probability for EUR/USD for short as we can look there is market structre shifted already on M30 and H1 which is our confluence for this setup . Our risk to reward is 1 to 4 so its very good for intraday and swing trading . Trade calm , trade safe stick to your plan !

EURUSD will break the resistance ?EURUSD now facing a resistance level which was its support earlier and is now consolidating and soon may resume to higher price with target around 1.82.

EUR/USD BREAKS ABOVE RESISTANCE APPROACHING JULY HIGH! Hey Traders so looking at the EUR/USD still looking bullish if you took the buy zone at 1.571 consider moving stop now to Break Even.
IMO taking the risk out of a trade is the first step before locking in a profit. So now we approach July high at 1.833.
I always say markets can do 3 things as they approach significant support or resistance.
1. Consolidate
2. Breakthrough
3. Reverse
However you want to give the market room to breathe so I would start to lock in profit by staying 3 days behind market. So if you want to try this profit taking wait until tommorows candle finishes and then move the stop 3 days behind the market at 1.1670. Then just manually let the market decide when to stop you out. Just say behind 3 days behind market.
So if bullish consider protecting stops or small profit taking.
However if Bearish I don't think now is the time to short unless a significant reversal takes place and support is broken.
Good Luck & Always use Risk Management!
(Just in we are wrong in our analysis most experts recommend never to risk more than 2% of your account equity on any given trade.)
Hope This Helps Your Trading 😃
Clifford

EURUSD Channel TradeAs you can see EU trading inside a channel and next predicted move can be possible retest and go again upside.
EURUSD: Short Trade Explained
EURUSD
- Classic bearish setup
- Our team expects bearish continuation
SUGGESTED TRADE:
Swing Trade
Short EURUSD
Entry Point - 1.1727
Stop Loss - 1.1759
Take Profit - 1.1661
Our Risk - 1%
Start protection of your profits from lower levels
Disclosure: I am part of Trade Nation's Influencer program and receive a monthly fee for using their TradingView charts in my analysis.
❤️ Please, support our work with like & comment! ❤️

HTF EURUSD PA REVIEWFeel free to provide any feedback.
It is important to note the dynamics between bearish and bullish range-initiation-mitigation-continuation.
Where one phase might be the initiation leg out of a bearish range, it can also be the point of mitigation of a previous bullish range.

EURUSD bullish trend continuationDaily candle closed with strong bullish.
a healthy pullback observed earlier today during Asian & Europe session.
I'm expecting a bullish movement in US session.
i'm buying at current market price.
calculate your own risk & reward.
Good Luck
EURUSD"As you can see in this analysis, the price is moving within an ascending channel on the 15-minute timeframe. I expect the price to react in the area that I have marked in blue, and if I see appropriate candlestick patterns, I will enter a buy position."

EURUSD DAILY UPDATESAs the main trendline on daily timeframe breaks, with the impulsive push price upside and also it closes below the previous day high.
I personally short the idea, see chart above
this is not a financial advice.
you can have a short positions on monday open with stoploss on previous day of the highest wick candle.
This is only my view, I shared the 3hr timeframe. the idea is on Daily.
Goodluck..

EUR/USD || Correction || 1hr
💼 EUR/USD –🔻 Market Move
Timeframe: 30M | Broker: CMC | Brand: GreenFireForex™
Chart Type: Clean. Tactical. Smart Money meets Waves.
---
🔻 Correction Almost Done (Wave 5)
Classic Elliott 5-wave drop inside a bullish falling wedge.
The boys might be setting up a liquidity sweep before lift-off.
📉 Current Range: Grinding between 1.17334 – 1.17153
🕳️ Liquidity Below:
🩷 1.17158 (Mid OB)
🩶 1.17057 (Deep OB)
💜 1.16904 (Max Draw, SL sweep zone)
---
🚀 Upside Projections
🎯 TP1: 1.17253 (Quick scalp)
🧠 TP2: 1.17819 (Institutional Magnet)
---
🔫 Setup Mood:
🎯 Buy the Dip, don’t chase the breakout.
🧊 Let retail short the wedge, we buy into their fear.
🏎️ Risk-managed, sniper mode.
---
👑
"Liquidity funds lifestyle. Waves fund legacy."
---

EUR/USD Update: Bullish Momentum Builds The euro just popped above $1.17 as optimism grows around a potential US-EU trade deal, following the recent US-Japan agreement. 📊
From a technical perspective:
• The euro found support at the April high of 1.1573, rebounding sharply — a strong sign that the bull trend is still intact. 🚀
• Next resistance levels to watch:
o 1.1830 – July’s high 📅
o 1.1850 – Top of a long-term channel from 2022 📈
o 1.2000 – The 200-month moving average, a major long-term target that often attracts price reaction 🔄
📌 Key takeaway: The path of least resistance remains to the upside, with momentum building toward 1.18+ in the near term.
Disclaimer:
The information posted on Trading View is for informative purposes and is not intended to constitute advice in any form, including but not limited to investment, accounting, tax, legal or regulatory advice. The information therefore has no regard to the specific investment objectives, financial situation or particular needs of any specific recipient. Opinions expressed are our current opinions as of the date appearing on Trading View only. All illustrations, forecasts or hypothetical data are for illustrative purposes only. The Society of Technical Analysts Ltd does not make representation that the information provided is appropriate for use in all jurisdictions or by all Investors or other potential Investors. Parties are therefore responsible for compliance with applicable local laws and regulations. The Society of Technical Analysts will not be held liable for any loss or damage resulting directly or indirectly from the use of any information on this site.

Euro is pumping up Officially the market is targeting the buy side liquidity on the 1.8 , next week we will see if the market confirm the up trend in lower time frame

EUR USD longas trend suggest and as today is Friday everything should settle this trade can be viable but the question that the target will hit would not be answered today
Please note: This is for educational purposes only and not a trading signal. These ideas are shared purely for back testing and to exchange views. The goal is to inspire ideas and encourage discussion. If you notice anything wrong, feel free to share your thoughts. In the end, to learn is to share !

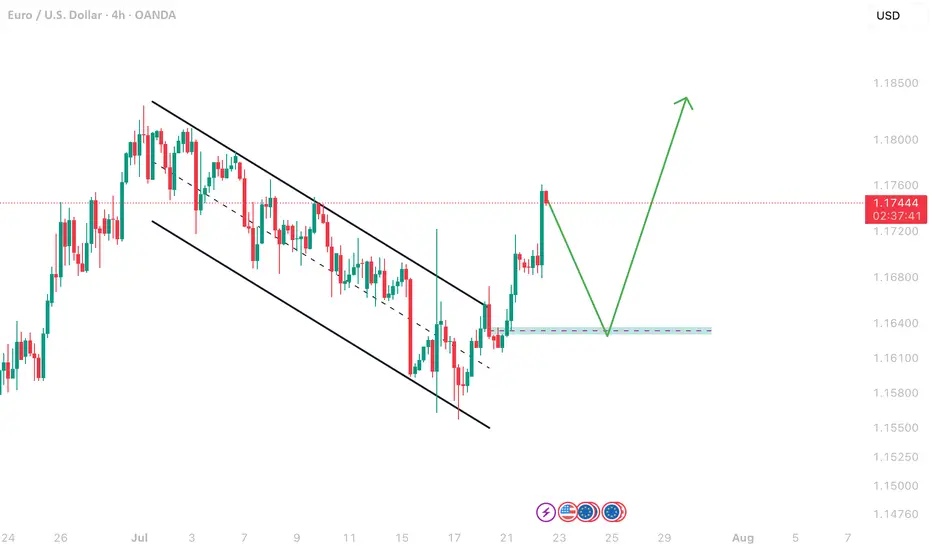
DeGRAM | EURUSD in the consolidation zone📊 Technical Analysis
● Price broke the month-long bearish channel and is now basing inside the 1.165-1.169 consolidation block; repeated intraday retests (blue zone) turn the former cap into fresh support.
● A steep hourly up-sloper is carving successive higher-lows; its width and the prior channel depth project follow-through toward 1.1745 (mid-July pivot) with room to the next swing line at 1.1800.
💡 Fundamental Analysis
● FXStreet highlights softer US PMIs and a pull-back in 2-yr yields, while ECB sources flag “data-dependent patience” rather than imminent cuts—narrowing the short-rate gap and favouring the euro.
✨ Summary
Long 1.1650-1.1680; hold above the blue base targets 1.1745 ➜ 1.1800. Long view void on an H1 close below 1.1615.
-------------------
Share your opinion in the comments and support the idea with a like. Thanks for your support!

EURUSD Breaks Bullish Structure – Here’s My Trade Plan📍 Watching EURUSD closely—it's recently broken bullish (market structure) on the daily timeframe 📈.
I’m now waiting for a retrace into a fair value gap, watching for the rebalance and a possible support zone touch before the next leg up 🔄🟢.
🎥 In this idea, I walk you through:
🔍 Price action
🧱 Market structure
📊 Trend direction
📋 And my personal trade plan for this setup
Not financial advice ❌💼

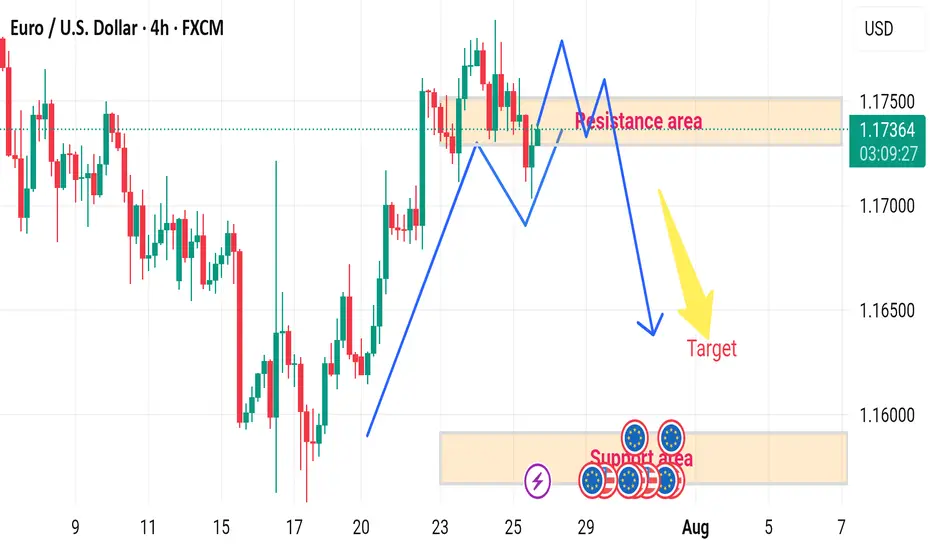
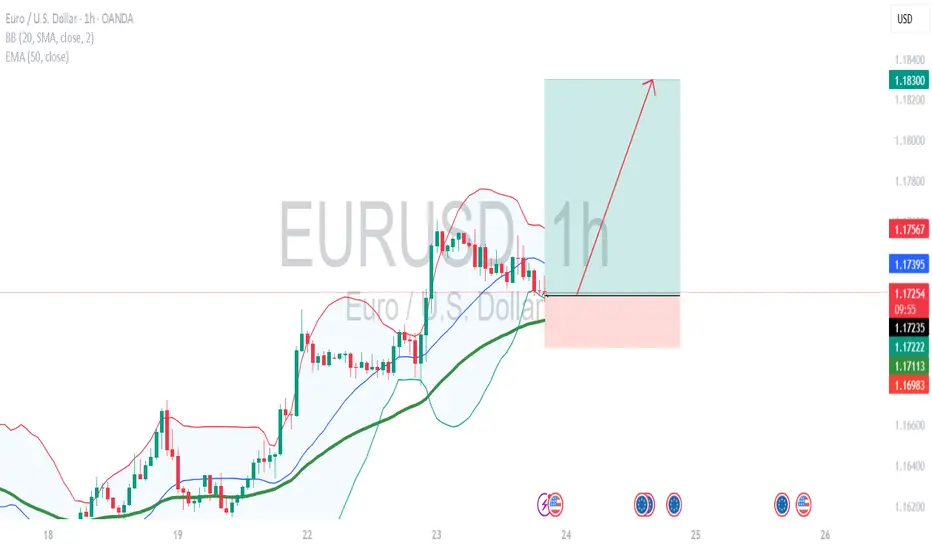
EUR/USD H4 DOWNWARD 🔄 Disrupted EUR/USD 4H Analysis
🟢 Current Context:
Price is currently at 1.17375, slightly below the resistance area (1.17400–1.17500).
Market shows a recent bullish impulse, followed by consolidation within the marked resistance zone.
Projection in the image suggests a double-top pattern forming at resistance, followed by a bearish reversal toward the target demand area (~1.15800–1.16000).
---
⚠️ Disruption Points:
1️⃣ Failed Double Top Scenario
Disruption Hypothesis: Instead of forming a clean double top and reversing, price may break above the resistance zone at 1.17500.
Reasoning: Strong bullish momentum and recent higher highs indicate potential for bullish continuation, invalidating the bearish target.
Disrupted Path: Price could break out → retest the resistance as new support → continue toward 1.18000–1.18300 zone.
2️⃣ Mid-Range Liquidity Trap
The current range may act as a liquidity trap:
Smart money could push the price slightly below support (fake breakdown), attract sellers, then reverse sharply upwards.
This would trap retail sellers targeting the 1.15800 zone.