EUR USD longit can be a viable setup , as last week we got trumped the uncertainty about dollar can continue...
one thing about how i trade . the last method I'm using is using a secondary analyzer app that can detect the lines and patterns , in mass numbers . i would put my favorite asset beside then ill open trades with a proper risk to reward ratio ( 1/ 1.5 usually) , i have fixed hour for job its 5 hours of monitoring the market. after that i wont open trades as it enters new york session . in whole day i would close my trades as i reach my daily goal, then i go do my daily life ...
so you may think i copy these ideas . that's not the case, its true for my real account im using a fish catcher but i know some day i dont have this and i should be able to catch the fishes with my hand. so im sharing these ideas based on my experience and yet i have to work on them ...
Please note: This is for educational purposes only and not a trading signal. These ideas are shared purely for back testing and to exchange views. The goal is to inspire ideas and encourage discussion. If you notice anything wrong, feel free to share your thoughts. In the end, to learn is to share !
USDEUX trade ideas

Key resistance for EURUSDYesterday, EURUSD moved higher and reached a key resistance level at 1,1720.
Watch closely to see if there’s enough momentum for a breakout and further upside.
If the price gets rejected, we could see a deeper correction.
Increased volatility is likely on Thursday following the ECB decision.
At the current levels, there’s no clear reason to enter a trade.

EURUSD 2nd Sell EntryEntry: 1.16403
Stop Loss (R): 1.16720
Take Profit (4R): 1.15135
*Disclaimer: I will not accept liability for any loss or damage, including without limitation to any loss of profit, which may arise directly or indirectly from use of or reliance on such information.

EURUSD buyer stepping inBase on today price action, we could see buyer is dominating the market.
My plan:-
wait at 1.1655 for any buy opportunity.
calculate your own risk & reward.
Good Luck


EUR/USD long: The Fed Chair debacle is getting spicyHello traders
My previous EUR/USD long did not pan out but I am swinging again. My entry order at 1.0563 was filled by the skinny skin of my teeth but so far so good. I'll use a trailing stop for this trade.
The pressure on Fed Chair Powell is being ramped up by Trump's attack dogs with allegations of mismanaging Federal funds(gasp :) ) during the FOMC headquarters.
We all saw the result of the rumor that Powell was fired/is considering resigning yesterday and as much as I am sure it pained DJT, he had to refute the rumor, no doubt on advice from Bessent.
In addition, FOMC board member Waller publicly dissented today and suggested a rate cut at the July meeting.
On the economic calendar we have the ECB rate decision, JOLTS, ADP and finally FOMC over the next two weeks.
This is purely a technical play but I am keeping a close eye on the bond markets, the
CME FedWatch tool and as for trade and tariffs, who cares...
I mentioned the Federal Court of Appeals case regarding the IEEPA court decision starting on 7/31/2025. For anyone interested in the court's decision,
www.cafc.uscourts.gov
More importantly, you can sign up for a notification at courtlistener.com which is a free service.
I have used it in the past and not only is it free but I also received the notification in a very timely manner.
www.courtlistener.com
Best of luck.

EURUSD Q3 | D21 | W30 | Y25 📊EURUSD Q3 | D21 | W30 | Y25
Daily Forecast 🔍📅
Here’s a short diagnosis of the current chart setup 🧠📈
Higher time frame order blocks have been identified — these are our patient points of interest 🎯🧭.
It’s crucial to wait for a confirmed break of structure 🧱✅ before forming a directional bias.
This keeps us disciplined and aligned with what price action is truly telling us.
📈 Risk Management Protocols
🔑 Core principles:
Max 1% risk per trade
Only execute at pre-identified levels
Use alerts, not emotion
Stick to your RR plan — minimum 1:2
🧠 You’re not paid for how many trades you take, you’re paid for how well you manage risk.
🧠 Weekly FRGNT Insight
"Trade what the market gives, not what your ego wants."
Stay mechanical. Stay focused. Let the probabilities work.
FRGNT 📊

eurusd long positionin my opinion this is a good trade with a good r/r
hope hit the tp
consider this is my trade not your trade and i just like to share my trades with world
EURUSD FOUND SUPPORT, READY TO BREAK THE CHANNELEURUSD FOUND SUPPORT, READY TO BREAK THE CHANNEL🔥
EURUSD has been trading within the descending channel since the beginning of the descending channel. Recently the price reached the major trendline, graph started to show the bullish divergence on the RSI .
What is a bullish divergence?
A technical analysis pattern where the price makes lower lows, but a momentum indicator (e.g., RSI, MACD) forms higher lows, signaling weakening bearish momentum and a potential trend reversal upward.
So, another hike in this pair is expected. Possible direction: spike towards the SMA200, minor pullback and a further development of the bullish impulse.

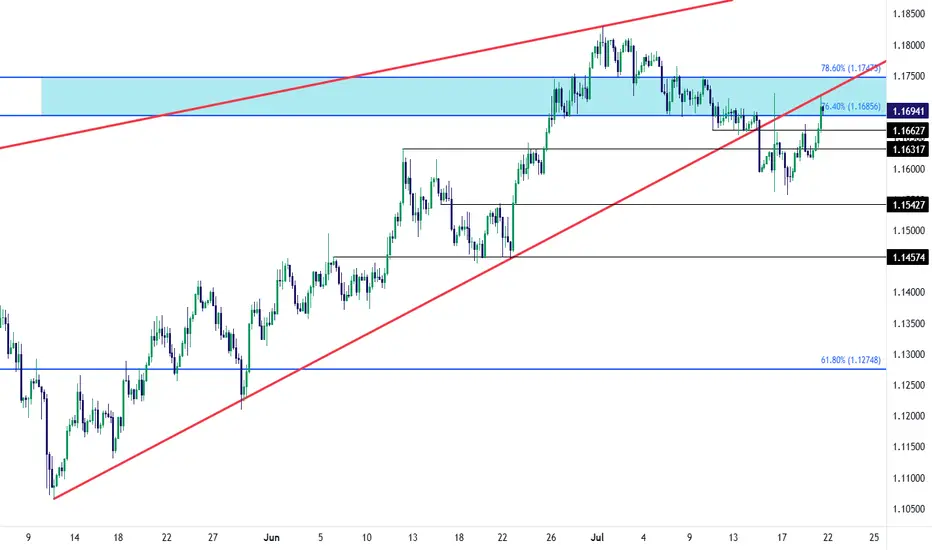
EUR/USD Recovery into Resistance TestEUR/USD bears had an open door to make a run last week and, so far, they've failed. The Wednesday turn around Trump's threat to fire Jerome Powell certainly made a mark, but the question now is whether the USD can respond to support at a longer-term trendline; and, in turn, EUR/USD is now testing in the zone between 76.4 and 78.6% Fibonacci retracements of the 2021-2022 major move.
There's also the underside of the falling wedge pattern that's now coming in as resistance as taken from prior support. The next resistance level overhead is the 1.1748 level, which is the 78.6% retracement that had offered both resistance and support with short-term price action in the pair. - js
EURUSD – Preparing For Potential Volatility AheadThe week ahead has all the elements to be a volatile one for EURUSD traders to navigate. First, the unwind of long positions that has been on-going throughout July, since prices hit a 4 year high at 1.1830 on July 1st may have potentially found a short-term base after rebounding last week from printing a low of 1.1556 on Thursday. More on this in the technical section below.
Secondly, Bloomberg reported over the weekend that negotiations to agree a trade deal between the US and EU are proving to be more challenging than initially hoped. This leaves room for market moving headlines on this topic, or social media posts from President Trump that could influence the direction of FX markets, especially if it shifts trader expectations towards preparing for the prospect of a trade war between these two global economic heavyweights.
Then on Thursday, consideration needs to be given to the ECB interest rate decision (1315 BST) and then the press conference led by ECB President Lagarde, which starts at 1345 BST. After eight consecutive rate cuts at their previous meetings, the European Central Bank are expected to take a pause to assess incoming inflation and growth data, so this outcome would probably not be a surprise. However, the comments of Madame Lagarde in the press conference could increase EURUSD volatility given that there is some uncertainty surrounding whether a further rate cut is possible either in September, or later in the year.
Technical Update: Limited Price Correction or Reversal?
We all know well, even if an asset is trading within a positive uptrend, periods of price weakness can materialise, before fresh buying support develops. This can lead to renewed price strength that manages to break and close above a previous high, leading to an extension of a pattern of higher price highs and higher price lows.
Having been capped by the July 1st high at 1.1830, EURUSD has seen a price correction develop. Traders may be trying to decide if this is a limited move lower before fresh price strength is seen, or if it could be a price reversal, which may result in risks of a more extended phase of price weakness.
Much will depend on the outcome of the risk events outlined above, as well as future market sentiment and price trends, however it is possible to assess what may be the important support and resistance levels that traders could focus on to help gauge the next direction of price activity
Potential Support Levels:
After a period of price strength, it can be useful to calculate Fibonacci retracements on the latest up move to identify areas of potential support. As the chart below shows, for EURUSD, the latest phase of price strength seen from 1.1065 the May 12th low up to 1.1830, the July 1st high can be used for this purpose.
The 38% retracement of this advance stands at 1.1539 and after having remained intact during last week’s sell off, traders may now be watching how this support level performs on a closing basis.
Breaks below 1.1539, while not a guarantee of further price declines, may then lead to a deeper phase of weakness towards 1.1446, the June 19th low, even 1.1356, which is equal to the lower 61.8% retracement level.
Potential Resistance Levels:
If the 38% retracement support at 1.1539 holds any future price weakness in the week ahead, a positive trending condition may still be in place, opening the possibility of EURUSD moving back to higher levels again.
Any potential upside move could bring 1.1690 into play as an important resistance. This is the current level of the Bollinger mid-average, with closing breaks above this needed to open retests of 1.1830 July 1st highs, maybe further if this is in turn broken.
The material provided here has not been prepared accordance with legal requirements designed to promote the independence of investment research and as such is considered to be a marketing communication. Whilst it is not subject to any prohibition on dealing ahead of the dissemination of investment research, we will not seek to take any advantage before providing it to our clients.
Pepperstone doesn’t represent that the material provided here is accurate, current or complete, and therefore shouldn’t be relied upon as such. The information, whether from a third party or not, isn’t to be considered as a recommendation; or an offer to buy or sell; or the solicitation of an offer to buy or sell any security, financial product or instrument; or to participate in any particular trading strategy. It does not take into account readers’ financial situation or investment objectives. We advise any readers of this content to seek their own advice. Without the approval of Pepperstone, reproduction or redistribution of this information isn’t permitted.

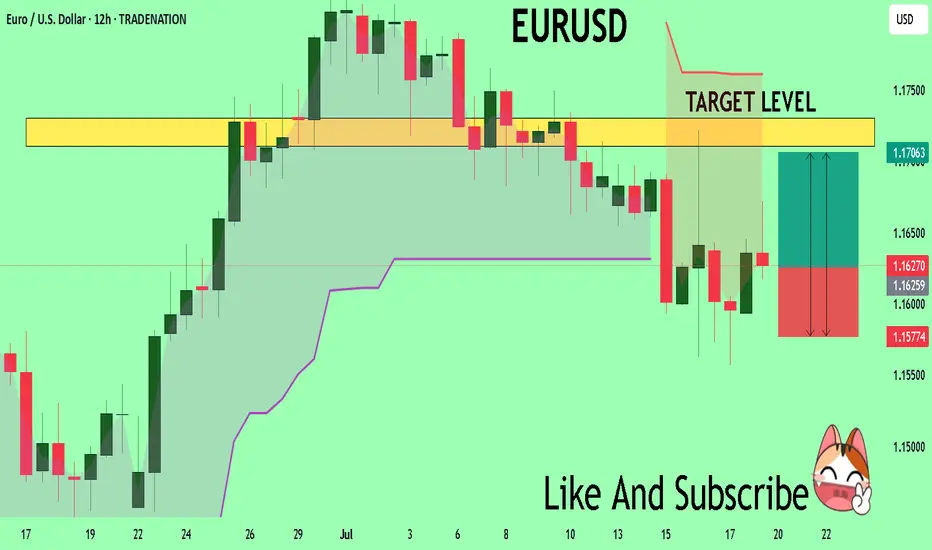
EURUSD: Target Is Up! Long!
My dear friends,
Today we will analyse EURUSD together☺️
The recent price action suggests a shift in mid-term momentum. A break above the current local range around 1.16915 will confirm the new direction upwards with the target being the next key level of 1.17187 and a reconvened placement of a stop-loss beyond the range.
❤️Sending you lots of Love and Hugs❤️

Analysis The market has gotten to the H1 FVG and idn it. Now we need to look for short opportunity. The lq has been taken.

Sell then Buy!Hello all. if market return right from here (IF IF IF IF), the response is the zone I have shown on the chart. I had no time to Optimize it. but enter with your confirmation method. I try to optimize it tonight (wink)

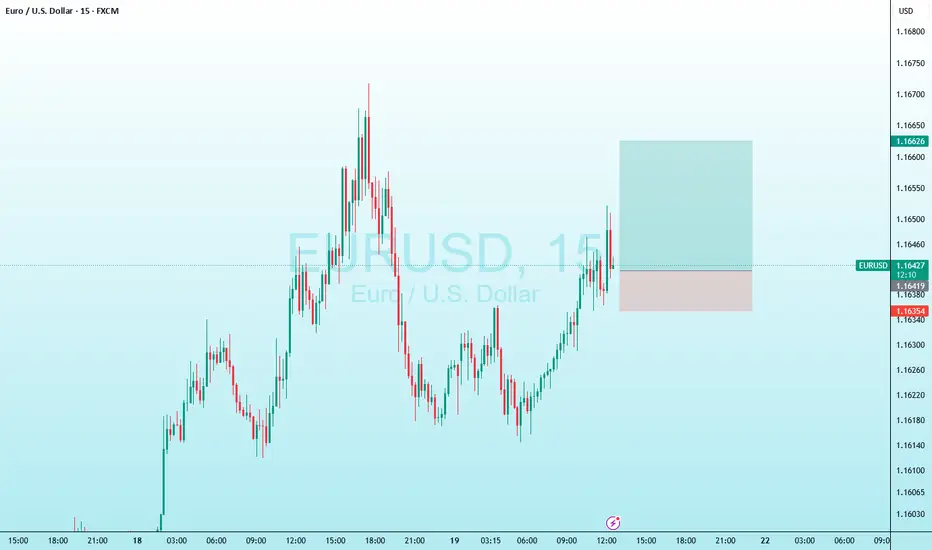
EURUSD Massive Long! BUY!
My dear friends,
Please, find my technical outlook for EURUSD below:
The price is coiling around a solid key level - 1.1627
Bias - Bullish
Technical Indicators: Pivot Points Low anticipates a potential price reversal.
Super trend shows a clear buy, giving a perfect indicators' convergence.
Goal - 1.1710
Safe Stop Loss - 1.1577
About Used Indicators:
The pivot point itself is simply the average of the high, low and closing prices from the previous trading day.
Disclosure: I am part of Trade Nation's Influencer program and receive a monthly fee for using their TradingView charts in my analysis.
———————————
WISH YOU ALL LUCK
EURUSD TRADE IDEA EURUSD pulled back for a trade to the upside.
We got involved on the trade at our Fibonacci level and we seem to be powering to the upside.
Let's see how the market does it's thing.

EURUSD Bullish ProjectionIt’s been a while since my last update here.
Here’s my projection and actual entry/entries on EURUSD, based on a sweep of the previous 1H swing low and mitigation of a Daily imbalance (Fair Value Gap).
We're anticipating a full Change of Character to mark the end of the ongoing Daily pullback.

EUR/USD LIVE TRADE UPDATE📍Trade in Progress – Key S/R Retest
Price is currently pulling back into the same S/R zone we sold from.
If price breaks and closes above this zone, the setup could be invalidated.
However, this level has shown strong historical structure, and we may see a rejection here.
We’re watching closely for:
A sign of momentum turning
A potential engulfing candle confirming rejection
📌 A strong zone can hold—but we don’t guess. We observe and react with discipline.

Buy idea!Hello everyone, as I told you on Last idea on EURUSD, price will go up and will make a new Higher High. it is a good time to go long with 9 R/R ratio.

EURUSD Short ProjectDescription:
1. Price Drivers: smart money distribution
2. Current Trend: down
3. Momentum: confirmed bearish
Action: Waiting for entry on the intraday timeframe (Entry will be published further)
*Disclaimer: I will not accept liability for any loss or damage, including without limitation to any loss of profit, which may arise directly or indirectly from use of or reliance on such information.

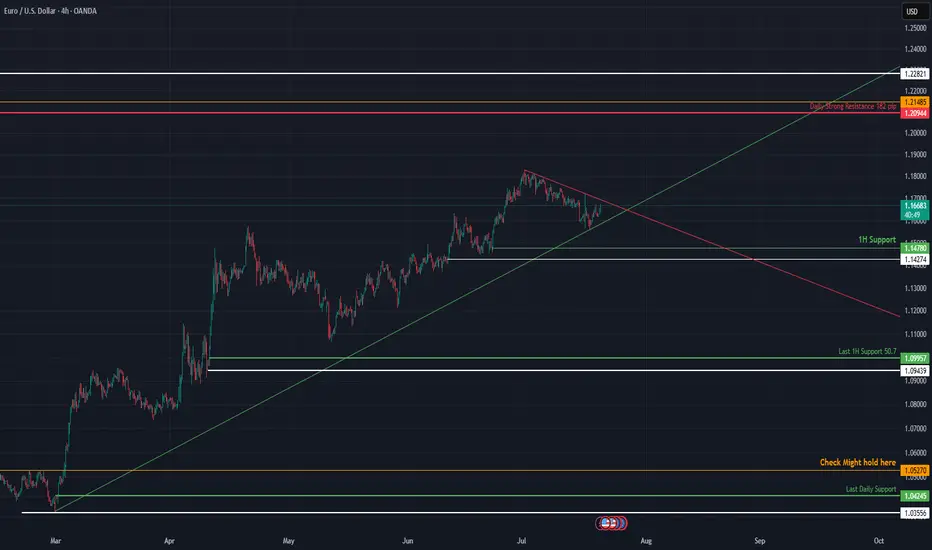
EURUSD Approaches Key Technical Breakout Point📈 EURUSD at a Critical Decision Point Between Two Trends
EURUSD is coiling between descending resistance and ascending support. A breakout from either direction will likely define the next leg of the move. This post breaks down the converging structure, high-probability levels, and what traders should watch to stay on the right side of the market.
🔍 Technical Analysis:
Price action is trapped between a downward sloping trendline (resistance) and a rising trendline (support), forming a symmetrical triangle. This compression indicates growing tension — and whichever trendline breaks first could dictate market direction in the coming weeks.
Currently, EURUSD is hovering near 1.1670, testing short-term structure while holding above prior swing supports.
🛡️ Support Zones (if downside breakout occurs):
🟢 1.1670 – 1H Support (High Risk)
First response zone on minor pullbacks.
Stop-loss: Below 1.1620
🟡 1.1470 – 1.1427 – Medium-Term Support (Medium Risk)
Confluence of diagonal and horizontal structure. Swing entry potential.
Stop-loss: Below 1.1380
🟠 1.0799 – Last 1H Support (Low Risk)
If the ascending trendline fails, this is the final zone to preserve a bullish structure.
Stop-loss: Below 1.0740
🔻 1.0242 – 1.0195 – Last Daily Support (Extreme Risk)
Loss of this zone marks a macro bearish shift.
🔼 Resistance Zones (if upside breakout occurs):
🔴 1.2094 – 1.2148: Daily Strong Resistance
Key breakout level. Strong historical supply. Clean close above here signals trend continuation.
Conclusion
EURUSD is at a technical fork — squeezed between opposing trendlines. The first decisive break will likely set the tone for Q3. Watch 1.2148 on the upside and 1.1427 on the downside for direction confirmation.
Not financial advice. Like & follow for more structured FX insights.
Uptrend Given the price behavior within the current support range, a trend change and the start of an uptrend is likely. Otherwise, a continuation of the downtrend is possible upon the support range being broken.

Watch out for EURUSDEURUSD continues to move sideways above the support zone.
This week, the key event is the ECB’s interest rate decision.
Keep an eye on whether there's enough momentum for a breakout above 1,1720.
If it gets rejected again, we might see a deeper correction.
