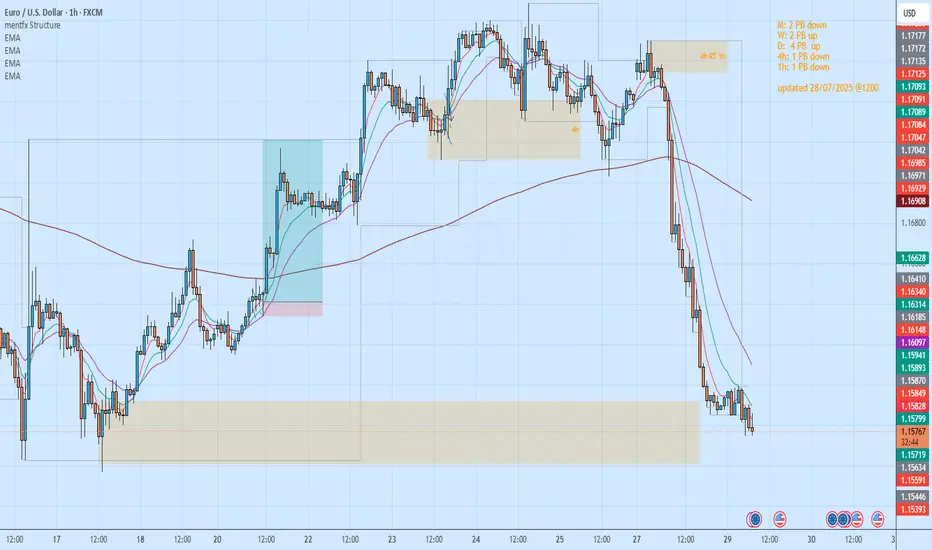
Has the Bleeding STOPPED?Yesterday witnessed a great deal of unidirectional push on major USD crosses. The EURUSD was not an exception. With the DXY strengthening for the most yesterday, the ripple effect on all USD crosses was bound to happen.
We were looking at the market for the most yesterday, trying to find a potential reversal point. While it seemed unclear, we were still able to narrow our probability into a rather slim perspective and spectrum.
Looking at the market right now, i will say that our reverssal should begin to show up any time soon.
I can already see reversals on some other USD crosses.
Price on the EURUSD is currently at a critical zone. Even though not an anticipated zone, price can see some reversal in that zone.
We still wait to see clear sign and confirmation of the reversal on the EURUSD, but for now, we still keep fingers crossed
USDEUX trade ideas
EURUSD BuyPrice did a ‘LG’ off the ‘POI’(looking left). Daily cycle not fully complete. Price should take out asia high.

EURUSD 3:1 Intraday SnipeThe H4 Doji on resistance
The downtrend on H4 H1 and M15
We are just shorting to next support
With a stop above m15 / h1 resistance nearest one - pretty solid also
3:1 Risk Reward
75%-80% odds (my rank)

EURUSD POSSIBLE TRADE SETUP💶 Potential Trade Setup on EURUSD
Overview:
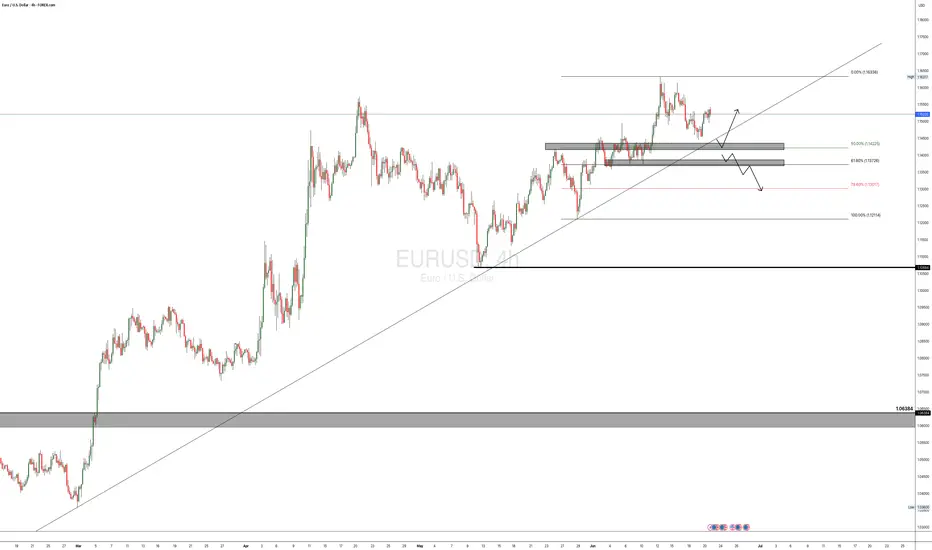
Since March, EURUSD has shown consistent bullish momentum, especially after breaking through the key 1.0600 supply zone.
The pair has maintained higher highs and higher lows, suggesting continued strength in the medium term.
That said, I am still quite anticipating for a possible continuation of the bullish momentum that started a long time ago, and moving forward, I will anticipate for a clear retest of the 50% fib at the 1.1425 region, then I go in for the kill.
Alternatively, there is a clear short opportunity, provided that, the bullish trendline is broken and the 1.1370 region is broken to the downside, this is a bit far a stretch, but it is in play. "IF" the DXY keeps the bullish momentum going.
🧭 Trading Plan:
✅ BUY Bias (Primary Plan):
Look for a retest of the 50% Fibonacci retracement zone around 1.1425. This aligns with the ongoing momentum on the 4H timeframe.
🔻 SELL Bias (Alternative Scenario):
If price breaks the bullish trendline and the 1.1370 support zone, a short opportunity opens up.
This is only valid if DXY continues to strengthen, shifting sentiment.
🎯 Targets & Risk Management: Targeting 1:2 R:R on both setups.
Ensure entries are backed by price action signals and confluences.
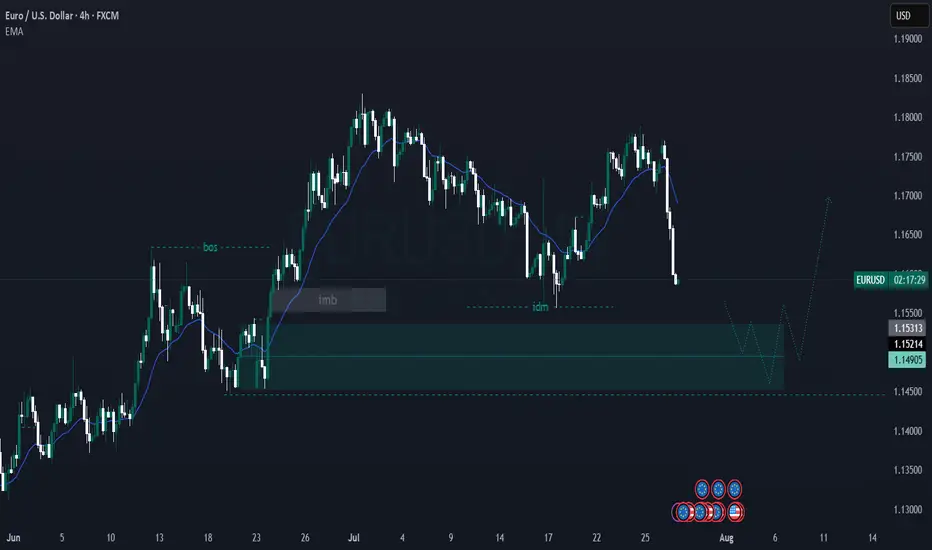
EUR/USD – 4H Technical Analysis AnticipatingPrice is currently in a bullish structure, printing consecutive Breaks of Structure (BOS) to the upside, confirming strong bullish momentum FX:EURUSD FX:EURUSD
On the 4H timeframe, price has:
Left behind an imbalance, signaling inefficiency in price delivery
Formed an unmitigated demand zone (internal OB) that aligns with bullish order flow
We now wait for price to return to this zone for a potential mitigation
📍 Plan of Action:
Monitor the mitigation area
Drop down to the 15-minute timeframe
Look for LTF (lower timeframe) confirmation: CHoCH, BOS, and internal structure shift before entering
Eurusd retraces1st target is low channel 1 line (1,1543).
Red line is magnet... (1,1684-92)
Oscilation between theese two lines....
Expect slow corrective pattern (>1.1610,1,16411,1692)

Countdown to Powell’s rate decision: What to watch WednesdayFederal Reserve Chair Jerome Powell is under mounting pressure from President Donald Trump to begin cutting interest rates.
Markets and analysts overwhelmingly expect the Fed to hold rates steady this Wednesday.
But what if the political heat is becoming too much to bear, and Powell and the Fed board advocate for a cut this week? Some Fed governors, Chris Waller and Michelle Bowman , have already signaled support for an early cut.
FX pairs to watch
USD/JPY:
This pair remains highly sensitive to yield differentials and broader risk sentiment. However, any hawkish resistance or emphasis on data dependency may keep the pair supported, especially if risk appetite holds.
EUR/USD:
The euro has shown relative strength in recent sessions, but the pair has been hit by the announcement of the trade deal struck between the EU and US. If the Fed clearly signals it's not ready to ease, the USD could regain even ground.
EUR-USD Support Ahead! Buy!
Hello,Traders!
EUR-USD is making a massive
Bearish correction and the pair
Is already locally oversold
So after it hits a horizontal
Support level below at 1.1568
We will be expecting a local
Bullish rebound
Buy!
Comment and subscribe to help us grow!
Check out other forecasts below too!
Disclosure: I am part of Trade Nation's Influencer program and receive a monthly fee for using their TradingView charts in my analysis.


EURUSD - Monday analysis - Tarifs EUR/USD Analysis – Market Response to US–EU Tariff Agreement
Following the agreement between the United States and the European Union to implement 15% tariffs, the DXY is strengthening, which is triggering a sharp decline on EUR/USD.
I’m focusing on a potential pullback to rejoin the move or the formation of a new structure.
Given that such strong moves often lack long-term sustainability, I’ll be watching the 1.16654 level closely — looking for a possible structure break and the beginning of a corrective phase.
Trade management will be based on the evolving price action throughout the session.
🔻 In summary: Today, I'm looking for opportunities to either join the ongoing move or enter a fresh structure that sets us up for the next leg — especially with a news-heavy week ahead.
👉 Follow me for more EUR/USD trade ideas, market updates. 💼
I share structured analysis every Monday and Wednesday to help you stay aligned with the market 🗓️📊

EURUSD TEMPORARY BUY THEN SELLBIG picture SELL
There is Temporary BUY since 15m SELL range swiped to BULL.
The BULLISH can start from 1.1736 (BUY ZONE) (I WONT BUY IF SELL ZONE TAPPED FIRST)
TP: 1.1762 (SELL ZONE)
SELL ZONE (1.1762/1.1770) After confirmation SELL.
TP: 1.1710

SHORT TRADE PLAN (LIVE REVERSAL SETUP)🔻SHORT TRADE PLAN (LIVE REVERSAL SETUP)
🔹 Entry: 1.1665
🔹 Stop Loss: 1.1800 (Brick 18 reclaim = hard invalidation)
🔹 Risk: 135 pips
🔹 Style: Macro Renko reversal — Brick 17 collapse, now short inside Brick 16
🔹 Bias: Downtrend targeting full structure rotation and fib reversion
⸻
🧠 WHY THIS SHORT?
• ❌ Bullish structure invalidated: H4 candle closed beneath 1.1700, violating Brick 17
• 🧱 Renko breakdown confirmed: Price now actively trading inside Brick 16 (1.1600–1.1700)
• 🧬 Momentum flipped: Largest bearish candle in weeks signals shift in institutional control
• 📉 No support until 1.1500–1.1400 → multiple clean Renko bricks below = high velocity window
• 🧲 Macro magnet pull: 1.1000 is full cycle reversion zone — untouched since last major fib reset
• 🔐 Longs are trapped under Fib 100 → sentiment rotated hard → fade is now the high-probability play
⸻
🎯 SHORT TARGET LADDER (100 PIP BRICKS)
TP1 — 1.1500 📉
〰️ Brick 14 confirm — early exit zone
+165 pips | R:R 1.22:1
TP2 — 1.1400 🔻
〰️ Brick 13 confirmation — structural break builds
+265 pips | R:R 1.96:1
TP3 — 1.1300 📉
〰️ D1 structural pivot — macro memory zone
+365 pips | R:R 2.70:1
TP4 — 1.1200 📉
〰️ Fib 0.0 / round number test
+465 pips | R:R 3.44:1
TP5 — 1.1100 📉
〰️ Trend extension base
+565 pips | R:R 4.18:1
TP6 — 1.1000 🧲
〰️ Full macro cycle alignment
+665 pips | R:R 4.92:1
TP7 — 1.0900 🪤
〰️ Trap zone for blowout shorts
+765 pips | R:R 5.66:1
TP8 — 1.0800 🧠
〰️ Max extension pressure
+865 pips | R:R 6.40:1
TP9 — 1.0700 🏁
〰️ Renko structure finality zone
+965 pips | R:R 7.14:1
TP10 — 1.0600 🌀
〰️ Overshoot runner — hold only 10–15%
+1065 pips | R:R 7.89:1
⸻
⚙️ EXECUTION RULES
• SL → locked at 1.1800 (only full Brick 18 reclaim = exit)
• Move SL to BE after TP2 hits
• Begin 1-brick trailing after TP3
• Book 70–80% of size by TP6
• Only hold runners beyond TP7–TP10 if Renko bricks remain unbroken
📛 Long bias is off — no reentry until Brick 17 is reclaimed on Renko
🟠 Optional new short entries on bounce into 1.1685–1.1700

EURUSD: A New Possibility On The Horizon!!Following my previous post just a few minutes ago, I’ve observed that price may retrace deeper into the 4H supply zone, which could invalidate our earlier bearish setup. This shift is due to visible signs of uncollected liquidity still resting above the current price.
If price continues its rally to the upside, we’ll shift bias and look for potential opportunities to ride the bullish move instead. Losses are part of the game, guys—but no worries, my sell entries are already secured✌️😂.
Stay sharp and stay active, traders. Let’s see how price unfolds from here. Follow for more updates. See you on the next one. ⚔️📊

EUR/USD | Moving bullish Why Is EUR/USD Always Moving?
Ever asked yourself, "Why does the Euro rise or fall against the Dollar?" 💡
It’s not magic – it’s all about money flow, news, and market mood.
📉 When traders feel unsure, they might sell the Euro.
📈 When Europe’s economy looks strong, the Euro can fly!
Right now, we’re watching some key price zones 👀:
Breakout above 1.17485 could push us to 1.18792 🚀
Drop below 1.17038 might take us lower 📉

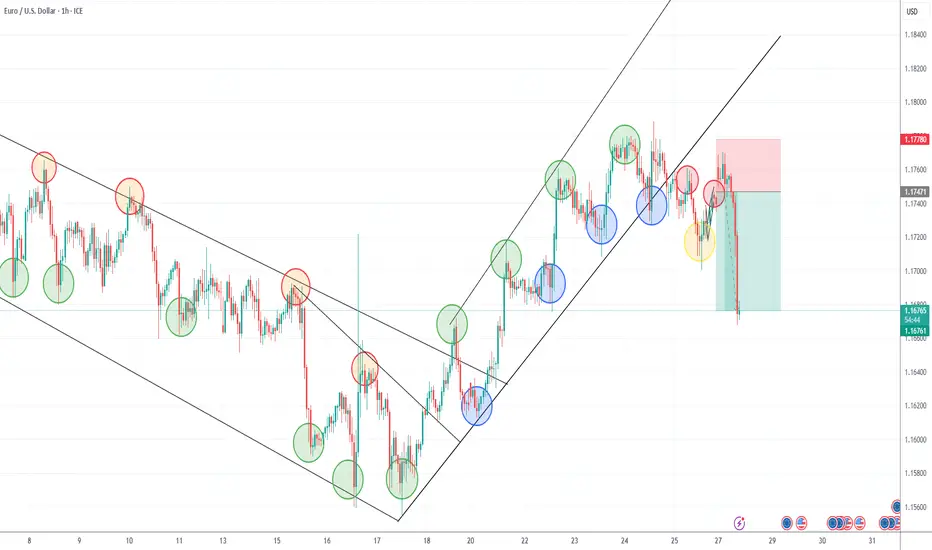
EUR/USD Channel Breakout to Trend Reversal – Clean RR SetupPrice was moving in a descending channel with clear lower highs and lower lows. After a breakout and retest, I entered long during the bullish structure shift. The uptrend held until resistance, where reversal signs appeared. I took a short position based on lower high confirmation. Trade hit TP successfully with clean price action respecting structure.
EUR USD LONG RESULT Price had formed a minor flag pattern after holding the Major Support Trendline and expected price to bounce higher at the resistance Trendline and support zone confluence, which it did.
But I extended TP higher than the supply zone, so price reversed and closed at BE.
Better Setups To Come 💪
_THE_KLASSIC_TRADER_.🔥

Not looking good for the dollarRising wedge broken on the long term chart, EUR will probably keep strengthening

EUR/USD – Testing Premium Zone, ECB & USD Macro Drive Next MoveEUR/USD – Testing Premium Zone, ECB & USD Macro Drive Next Move
EUR/USD is consolidating near 1.1770–1.1780, right inside the premium liquidity zone (0.786–0.886 Fib) and just below the Weak High at 1.1830. This level is critical for the next directional move.
Macro Landscape
ECB paused at 2.0% after eight consecutive cuts but may ease again in late 2025 as inflation trends toward 1.4% (ECB, 2025).
USD remains under pressure on expectations of Fed cuts, high fiscal deficits, and tariff concerns, creating a medium-term bias toward EUR strength (Reuters, 2025).
EU–U.S. trade deal at 15% tariff base reduces downside risks but does not fully remove growth headwinds (OECD, 2025).
Technical Outlook
Key Resistance: 1.1780–1.1830 (premium zone).
Upside Targets: 1.1905 (N) and 1.2085 (V) on breakout.
Support: 1.1680–1.1630 (Cloud/Kijun) and 1.1500 pivot for mean reversion.
VolanX DSS Signal:
Score: 58/100 (Neutral-to-Bullish)
Trend remains constructive but premium levels suggest a possible pullback unless the pair clears 1.1835 with momentum.
Plan:
Watch for a fade setup at 1.178–1.183 with stops >1.184.
A confirmed breakout above 1.1835 opens a run toward 1.19–1.21.
#EURUSD #Forex #MacroStrategy #ECB #CurrencyMarkets #TradingView
For educational purposes only. Not financial advice.

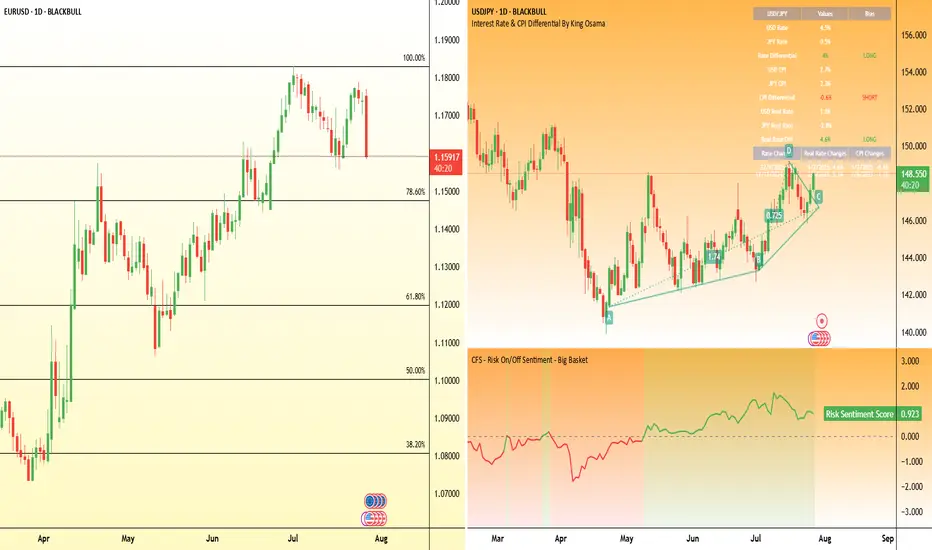
EURUSD(20250728) Today's AnalysisMarket news:
Trump announced that the US and Europe reached a trade agreement: 15% tariffs on the EU, $600 billion in investment in the US, zero tariffs on the US by EU countries, the EU will purchase US military equipment, and will purchase US energy products worth $750 billion. However, the US and Europe have different opinions on whether the 15% tariff agreement covers medicines and steel and aluminum. Von der Leyen: 15% tariff rate is the best result that the European Commission can achieve.
US Secretary of Commerce: The deadline for tariff increase on August 1 will not be extended. The United States will determine the tariff policy on chips within two weeks.
Technical analysis:
Today's buying and selling boundaries:
1.1735
Support and resistance levels:
1.1792
1.1771
1.1757
1.1712
1.1698
1.1677
Trading strategy:
If the price breaks through 1.1757, consider buying, the first target price is 1.1771
If the price breaks through 1.1735, consider selling, the first target price is 1.1712

EURUSD – Channel Forming at Trend Top?EURUSD remains bullish but is showing signs of topping out, possibly forming a downward channel. We’re eyeing a mid-channel entry near a weekly gap, looking for one more push higher before a potential reversal. Key levels could form a double top – a breakout or rejection here will be telling.

EURUSD is Ready for a Bullish MoveHello Traders
In This Chart EURUSD HOURLY Forex Forecast By FOREX PLANET
today EURUSD analysis 👆
🟢This Chart includes_ (EURUSD market update)
🟢What is The Next Opportunity on EURUSD Market
🟢how to Enter to the Valid Entry With Assurance Profit
This CHART is For Trader's that Want to Improve Their Technical Analysis Skills and Their Trading By Understanding How To Analyze The Market Using Multiple Timeframes and Understanding The Bigger Picture on the Charts

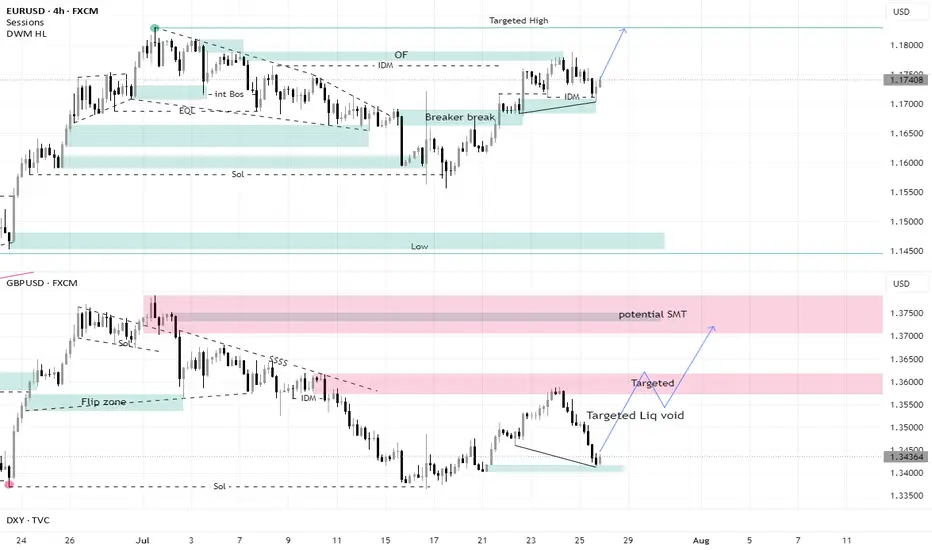
SMT in EU and GU + Targeting Liquidity voidI did not expect the GBPUSD to fall with all this force, but the EURUSD’s refusal to fall with it all these points indicates the strength of the current Low from which it rebounded, and it is expected that this bottom will hold
It is clear that GBPUSD was looking for more liquidity and that is why it dropped all these points. With this drop, it created a liquidity void that allowed it to rise and take all these pips back.
EURUSD Bullish Break of Structure after the liquidity sweepAs long as confirmation comes in the demand zone, this is a solid bullish setup.
