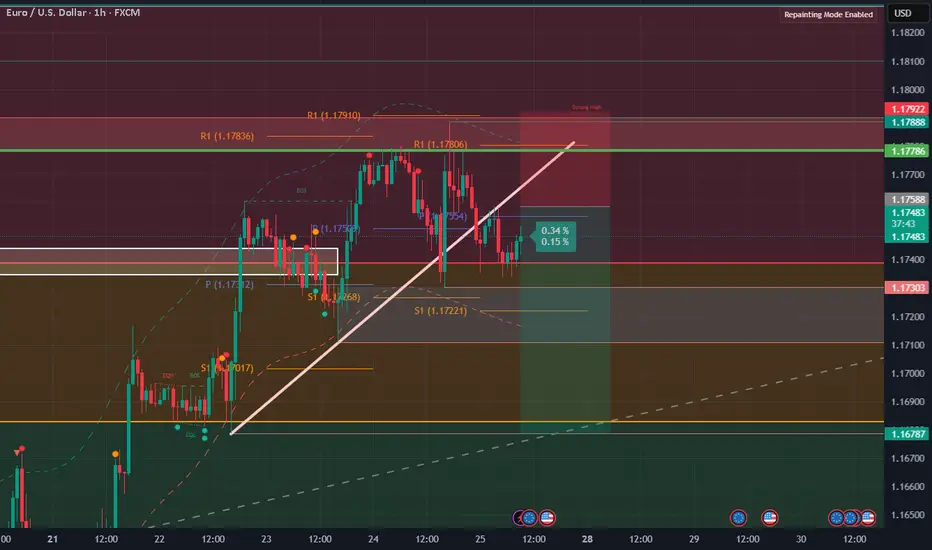
EURUSD 1HConsidering that the one-hour timeframe trend for the EURUSD symbol has turned bullish and liquidity has been collected at the last low, after a price correction in lower timeframes and observing a suitable candlestick setup, one can enter a buy trade and follow the price at least up to 1.18310.
USDEUX trade ideas

EURUSD BUYSEU is bullish. It has been consistently making HHs & HLs. I’d look for price to push towards the daily resistance @ 1.83000 then I’d look for price to push towards 1.19000.

Review on the 1st 3 Elite PairYou can follow us for more Analysis(Images and Videos) with Precise definition of the Financial Market.ENJOY!!!

EU possible buy idea?7 days ago, I shared a bullish idea that remains valid despite price failing to hold above 1.04321.
Current Market Analysis:
Price appears to be forming an Elliot Wave 2 (a-b-c) correction.
Key Levels to Watch:
- 38.2% Fibonacci retracement level (minimum required for Wave 2)
- 88.7% Fibonacci retracement level (maximum allowed for Wave 2 to maintain bullish bias)
Trade Plan:
With my initial position at break-even, I'll employ dollar-cost averaging for additional buys targeting 1.065 :
1. 50% Fibonacci retracement level
2. 61.8% Fibonacci retracement level
3. 78.6% Fibonacci retracement level
Stop Loss: 1.017
This is not a financial advice but if you must take the trade, apply proper risk and money management while scaling into the trade.

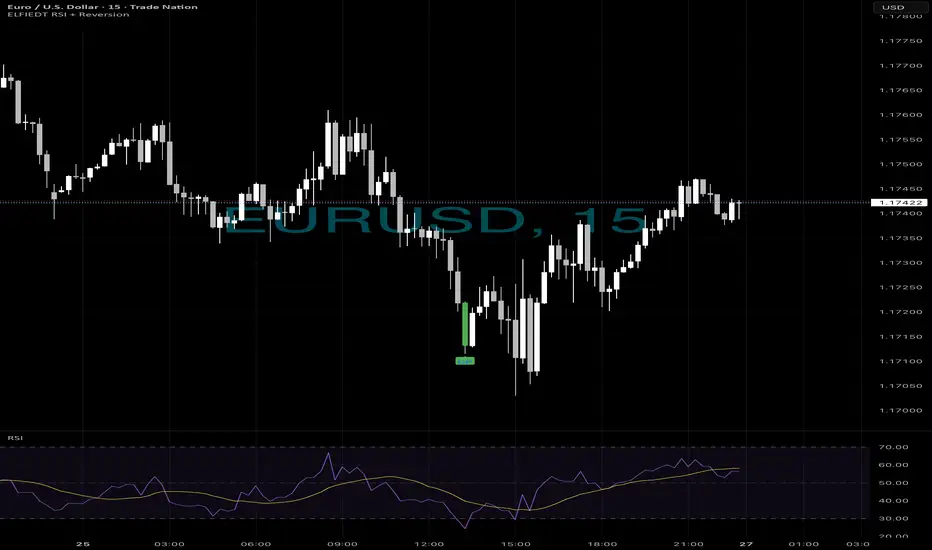
There are more entries and ways….🧠 Smart Traders Don’t Chase… They Wait for Confluence.
On EUR/USD, price dipped hard — but my system didn’t panic.
It waited — and when the conditions aligned, it fired the BUY.
✅ RSI + Reversion Signal printed right at the low
✅ RSI formed a classic bullish divergence
✅ Price reversed within 2 candles
✅ Textbook bounce — no guesswork
⸻
🔍 What Created the Signal?
1. Price made a lower low
2. RSI made a higher low (momentum shift)
3. Signal confirmed with an “UP” tag from ELFIEDT
4. Candle closed above reversion band = ENTRY
5. SL = just below the signal candle’s low
6. Target = 2R minimum (easily achieved)
⸻
This is what confluence looks like.
📉 Momentum shift +
📈 Reversion overshoot +
🟢 System confirmation = High-Conviction Trade
⸻
💬 DM “DIVERGENCE” if you want this tool
📲 Follow for more setups with real edge
Let the indicators do the thinking — you focus on execution.
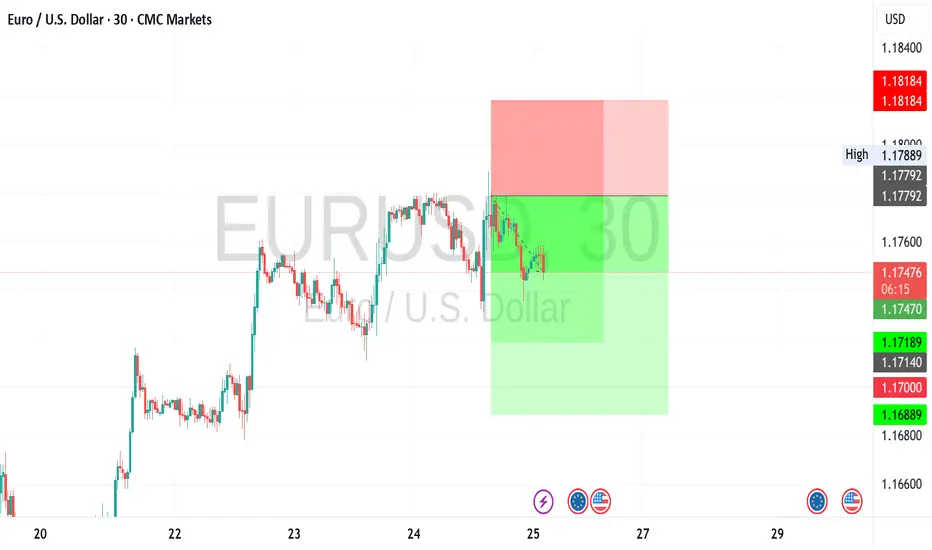
EURUSD pullback short- 25/7/25Price failed to break through the supply zone above that was identified on the higher 4hr and 1hr TF.
The last unmitigated zone is highlighted in green and looking to take a short from there to the next low.
There is equal level liquidity below that will draw price there.
In addition the HH is just a wick giving me more confidence that there is weakness in the EUR.

NZDUSD - EURUSDHi TRADERS, while we are looking to trade NZDUSD mkt wave to the upside on the 4h chart let's not think that "it may" be the same as to EURUSD, because the DOUBLE TOP PATTERN that was formed from January 4th through May 21st 2021 and then breaks to the downside have just came to retest supply zone aera on JUNE 30th 2025, and sell off a little. And this week JULY 21st 2025, buyers push price to that same W/D supply zone that also can be called SOPPRT RESISTANCE PIVOT POINT AERAS after a long period of FOUR YEARS, for the first time . My humble opinion

EUROUSDShort Position of EuroUsd
Total 0.5% risk of my total Portfolio
All the things mention with Sl

EURUSD | Symmetrical Wedge Breakdown
TF: 15m |
🎯 Setup Insight:
The market doesn’t move in straight lines — it coils.
What you're seeing is an ABCDE corrective wedge, playing out its final phase.
Wave E completed, and liquidity is built right above.
We expect a trap in the purple premium zone (1.1740–1.1757) — then a drop toward 1.1695.
---
🧠 Strategy:
Sell Zone: 1.17410 – 1.17574
Target: 1.16958
Invalidation Above: 1.17600
Wedge ✅
Liquidity ✅
Confluence ✅
Only one move left — the snap.
---
🗝️ Notes:
The market may spike into the OB zone to trap late buyers before the real move unfolds.
The mini-diagram on the right explains it all: "Trap them high, exit them low.✓

EURUSD Is Bullish! Long!
Take a look at our analysis for EURUSD.
Time Frame: 9h
Current Trend: Bullish
Sentiment: Oversold (based on 7-period RSI)
Forecast: Bullish
The price is testing a key support 1.173.
Current market trend & oversold RSI makes me think that buyers will push the price. I will anticipate a bullish movement at least to 1.184 level.
P.S
Overbought describes a period of time where there has been a significant and consistent upward move in price over a period of time without much pullback.
Disclosure: I am part of Trade Nation's Influencer program and receive a monthly fee for using their TradingView charts in my analysis.
Like and subscribe and comment my ideas if you enjoy them!

ELLIOTT WAVE EURUSD H4 update
EW Trade Set Up H4
subminuette W4 seems finished
monitor the breakout of the descending channel that appears to contain wave IV
The bullish movement that started on July 17th must assume a 5-wave pattern
key levels (area)
1.1705
1.1684 POC
1.1654
note :
the breakout upwards of the leading span B (red line) by the lagging span (green line) will confirm the start of a bullish movement in the subminuette wave v.
Failure to break above price levels 1.1684 and 1.1705 will result in a recalculation of the waves count

EURUSD HOLDS BULLISH MOMENTUMEURUSD HOLDS BULLISH MOMENTUM📈
24 July I wrote about bearish divergence in EURUSD. Now we see that this resulted into decline towards sma200 on 30-m chart. Currently the price is rebounding from this moving average.
What is the sma200?
The sma200 is a technical indicator that calculates the average closing price of a forex pair or crypto over the past 200 trading periods. It’s used to identify long-term trends, smooth out short-term price fluctuations, and determine potential support or resistance levels.
There is high possibility that the price will continue its way towards local resistance of 1.18300.

Eurusd ShortFX:EURUSD
Yesterday there was a false breakdown of the level after which we saw a return to the range and a breakdown of the trend line, today I expect the removal of Asian hai and a trip for liquidity
Fundamental Market Analysis for July 25, 2025 EURUSDThe euro remains under pressure as the bond yield gap is once again widening in favor of the dollar following comments from Fed Chair Powell about the need to “keep policy tight for longer” to counteract the inflationary effects of new US tariffs. Additional support for the dollar came from the increase in June retail sales and a decline in jobless claims, which confirms the resilience of the US economy and pushes expectations for the first rate cut toward the year-end.
From the European side, euro support is undermined by signs of slowing activity: the GfK consumer confidence index in Germany remains below its historical average, and preliminary July eurozone PMIs, despite some improvement, still indicate an uneven recovery of the real sector. Further pressure comes from ongoing uncertainty around EU–US trade talks; Washington is still discussing the possibility of 15% tariffs, which threatens the bloc’s export prospects and fuels demand for the safe-haven dollar.
With monetary policy divergence and tariff escalation risks persisting, the pair is likely to continue correcting toward 1.17. Investors are awaiting tomorrow’s US PCE data, which could reinforce expectations of the Fed maintaining a “hawkish” stance and cement the downward trend.
Trade recommendation: SELL 1.17350, SL 1.17550, TP 1.16350


EURUSD I Bullish Bounce Off Based on the H4 chart analysis, the price is falling toward our buy entry level at 1.1699, a pullback support that aligns with the 38.2% Fib retracement.
Our take profit is set at 1.1745, a pullback resistance.
The stop loss is placed at 1.1638, below the 61.8% Fib retracement.
High Risk Investment Warning
Trading Forex/CFDs on margin carries a high level of risk and may not be suitable for all investors. Leverage can work against you.
Stratos Markets Limited (tradu.com ):
CFDs are complex instruments and come with a high risk of losing money rapidly due to leverage. 63% of retail investor accounts lose money when trading CFDs with this provider. You should consider whether you understand how CFDs work and whether you can afford to take the high risk of losing your money.
Stratos Europe Ltd (tradu.com ):
CFDs are complex instruments and come with a high risk of losing money rapidly due to leverage. 63% of retail investor accounts lose money when trading CFDs with this provider. You should consider whether you understand how CFDs work and whether you can afford to take the high risk of losing your money.
Stratos Global LLC (tradu.com ):
Losses can exceed deposits.
Please be advised that the information presented on TradingView is provided to Tradu (‘Company’, ‘we’) by a third-party provider (‘TFA Global Pte Ltd’). Please be reminded that you are solely responsible for the trading decisions on your account. There is a very high degree of risk involved in trading. Any information and/or content is intended entirely for research, educational and informational purposes only and does not constitute investment or consultation advice or investment strategy. The information is not tailored to the investment needs of any specific person and therefore does not involve a consideration of any of the investment objectives, financial situation or needs of any viewer that may receive it. Kindly also note that past performance is not a reliable indicator of future results. Actual results may differ materially from those anticipated in forward-looking or past performance statements. We assume no liability as to the accuracy or completeness of any of the information and/or content provided herein and the Company cannot be held responsible for any omission, mistake nor for any loss or damage including without limitation to any loss of profit which may arise from reliance on any information supplied by TFA Global Pte Ltd.
The speaker(s) is neither an employee, agent nor representative of Tradu and is therefore acting independently. The opinions given are their own, constitute general market commentary, and do not constitute the opinion or advice of Tradu or any form of personal or investment advice. Tradu neither endorses nor guarantees offerings of third-party speakers, nor is Tradu responsible for the content, veracity or opinions of third-party speakers, presenters or participants.

EURUSD Identified a more pronounced risk aversion bias Identified a more pronounced risk aversion bias in the current market after integrating news opinion, social media keyword distribution and institutional trading behavior. Recent economic data has deviated from expectations, raising concerns about global economic growth. Relevant currency pairs gradually lost the initiative in the market, and the price trend showed signs of weak oscillation or downward break.
From the viewpoint of sentiment index, investors generally turned to be cautious, and the attraction of safe-haven assets such as the dollar, yen, Swiss franc, etc. rose. This risk aversion is also confirmed on the flow side of the equation - the system recognizes that some funds have withdrawn from risky currency pairs and flowed to more liquid assets.
Combines these dynamic information to judge that the bearish trend may continue in the short term, and recommends that investors maintain a defensive mindset and lay out their strategies in a predominantly short direction.
Eurusd Tomorrow's forecastThe correction process is expected to continue tomorrow.
The yellow zone, as usual, is the separator.
I wish you success.

EUR/USDThe EUR/USD Is proving to show a weekly bearish reversal, but as you know within the weekly swing are smaller fractals that make the occasional (2H - 4H) hedge impulses. I have entered from the (1H - 2H) chart to the down side with a take profit of 1.01310 knowing that due to USA regulation I will not be able to hedge I will add lot size at the peak of every (4H) pull back


Eurusd long 6k profit live execution EUR/USD stays defensive below 1.1800 ahead of ECB decision
EUR/USD remains in a bullish consolidation mode below 1.1800 in European trading on Thursday. Traders refrain from placing fresh bets ahead of the European Central Bank policy announcements and the US preliminary PMI data. Mixed PMI data from Germany and the Eurozone failed to trigger a noticeable reaction.


EURUSD LIVE TRADE 65PIPS 5K PROFITEUR/USD stays defensive below 1.1800 ahead of ECB decision
EUR/USD remains in a bullish consolidation mode below 1.1800 in European trading on Thursday. Traders refrain from placing fresh bets ahead of the European Central Bank policy announcements and the US preliminary PMI data. Mixed PMI data from Germany and the Eurozone failed to trigger a noticeable reaction.
