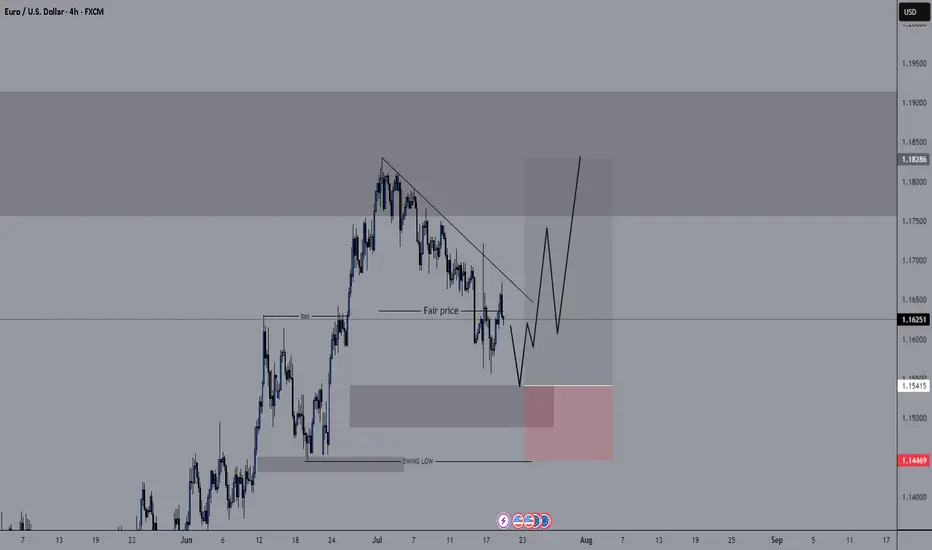
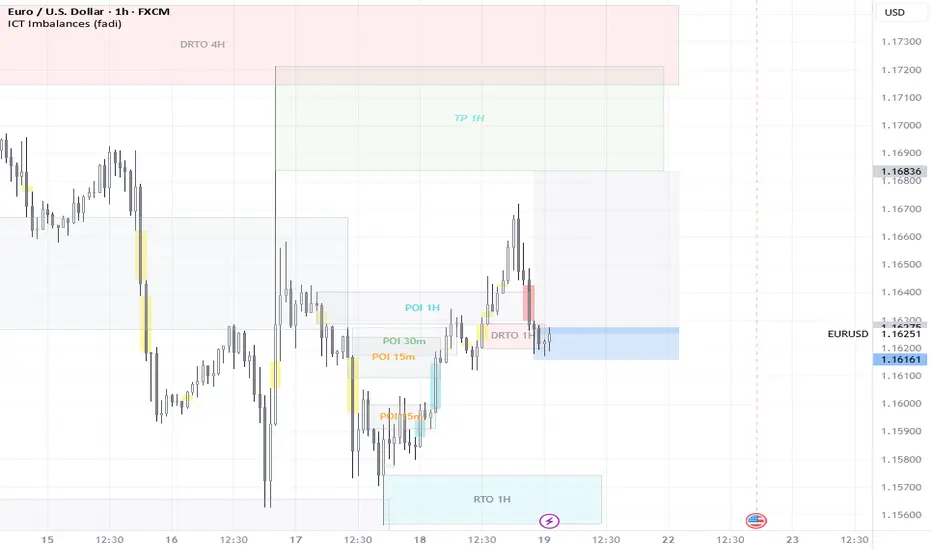
EURUSD - Monday AnalysisAt the beginning of the new week, we're in a local uptrend following the completion of Friday’s bullish wave. I'm currently anticipating two scenarios, which I positioned for on Friday:
Continuation of the trend toward new highs, targeting 1.172
A potential correction into the demand zone around 1.1594
Follow me for more EUR/USD insights and analysis 🔍
USDEUX trade ideas

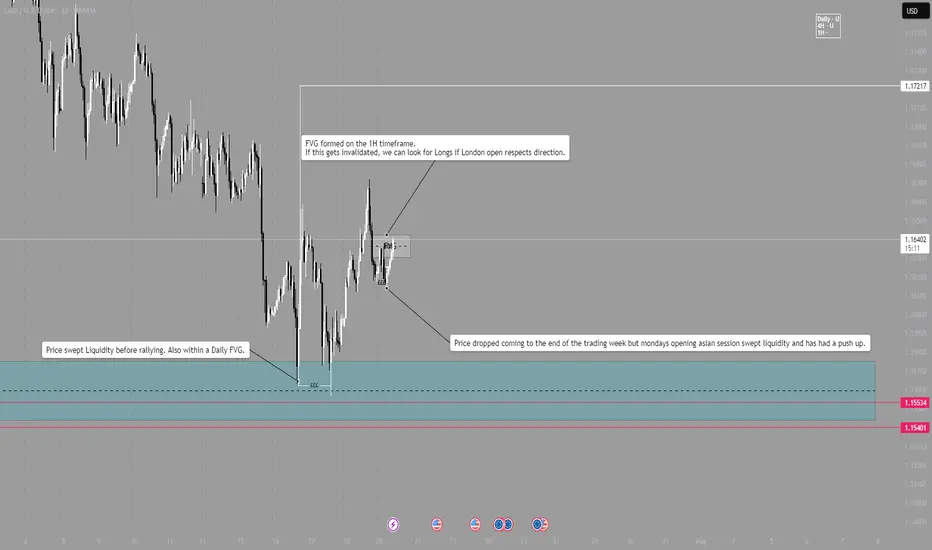
EUR/USD - LONGLondon Session Pre market breakdown.
Daily bias is long.
4H bias is Long.
1H bias is Long.
After last weeks sweep on liquidity within a Daily FVG, market pushed higher, providing several long opportunities.
Now at the beginning of the week, price dropped during Asia session and swept some of Fridays New York liquidity.
Price is pushing higher and is now in a 1H Bearish FVG, if the FVG is broken, we can look for Longs around that range.
NOTE - Wait and see how London open plays out, DO NOT enter within first 15mins and wait for trend continuation to be verified before entering. Always wait for a candle close and a break of structure.
Eurousd techinical analysis.Eurousd techinical analysis next move posibale at h1 time frame.not finchinal advice.

EUR USD SHORTLets go for the first idea for this week, I will be watching other currency pairs, if we have a clear opportunity, we can get in.

EURUSD - M15 Supply Zone RetestThe current price action shows that the market is expected to first fill the Fair Value Gap (FVG) area, which acts as a price inefficiency zone demanding liquidity clearance. After the FVG is filled, the price is anticipated to retest the Higher Time Frame (HTF) Supply Zone, which serves as a strong resistance area.
Following the retest of the supply zone, the prevailing downtrend is likely to resume, pushing the price downwards towards the HTF Demand Zone. This demand zone is identified as a key support level where buying interest is expected to emerge, potentially halting the decline temporarily or initiating a reversal.
This trading plan emphasizes waiting patiently for the FVG fill as a prerequisite step before looking for a supply zone retest confirmation to enter short positions targeting the demand zone below, aligning with the overall bearish trend continuation.

EURUSD M15 I Bearish Reversal Based on the M15 chart, the price could rise toward our sell entry level at 1.1641, a pullback resistance.
Our take profit is set at 1.1604, a pullback support that aligns closely with the 62.8% Fib retracement.
The stop loss is set at 1.1670, an overlap resistance.
High Risk Investment Warning
Trading Forex/CFDs on margin carries a high level of risk and may not be suitable for all investors. Leverage can work against you.
Stratos Markets Limited (tradu.com ):
CFDs are complex instruments and come with a high risk of losing money rapidly due to leverage. 66% of retail investor accounts lose money when trading CFDs with this provider. You should consider whether you understand how CFDs work and whether you can afford to take the high risk of losing your money.
Stratos Europe Ltd (tradu.com ):
CFDs are complex instruments and come with a high risk of losing money rapidly due to leverage. 66% of retail investor accounts lose money when trading CFDs with this provider. You should consider whether you understand how CFDs work and whether you can afford to take the high risk of losing your money.
Stratos Global LLC (tradu.com ):
Losses can exceed deposits.
Please be advised that the information presented on TradingView is provided to Tradu (‘Company’, ‘we’) by a third-party provider (‘TFA Global Pte Ltd’). Please be reminded that you are solely responsible for the trading decisions on your account. There is a very high degree of risk involved in trading. Any information and/or content is intended entirely for research, educational and informational purposes only and does not constitute investment or consultation advice or investment strategy. The information is not tailored to the investment needs of any specific person and therefore does not involve a consideration of any of the investment objectives, financial situation or needs of any viewer that may receive it. Kindly also note that past performance is not a reliable indicator of future results. Actual results may differ materially from those anticipated in forward-looking or past performance statements. We assume no liability as to the accuracy or completeness of any of the information and/or content provided herein and the Company cannot be held responsible for any omission, mistake nor for any loss or damage including without limitation to any loss of profit which may arise from reliance on any information supplied by TFA Global Pte Ltd.
The speaker(s) is neither an employee, agent nor representative of Tradu and is therefore acting independently. The opinions given are their own, constitute general market commentary, and do not constitute the opinion or advice of Tradu or any form of personal or investment advice. Tradu neither endorses nor guarantees offerings of third-party speakers, nor is Tradu responsible for the content, veracity or opinions of third-party speakers, presenters or participants.

EURUSDThis is the EURUSD 1H chart showing a potential bullish setup. Here’s a breakdown of your market structure and what you can do:
Observations:
1. Trendline Support: Price is respecting a daily trendline, which shows potential for upward continuation.
2. Order Block: Price has tapped into a clear order block zone, indicating institutional interest and potential for a reversal.
3. BOS (Break of Structure) & CHoCH (Change of Character): Previous BOS confirms downward movement, but recent CHoCH suggests a possible shift to bullish momentum.
4. Bullish Projection: Your markup shows a forecasted bullish leg with a minor pullback before continuation.
What to do:
- Entry: Wait for a confirmation candle (bullish engulfing or strong rejection wick) within or just above the order block to go long.
- Stop Loss: Place it just below the order block or trendline for safety.
- Take Profit: You can scale out at recent highs or follow price using trailing stops. Consider targeting previous supply zones for partial exits.

Eurusd changing trendPrepeair Ur selv to see euro against US dollar with a kinda big or minimum huge profit, going 2 cents above, from 1.1620 to 1.1840, ofc this is only in my POV.
Keep Ur investment safe and use lways a stop loss under wht you can lose, and I don't mean this trade, but all I mean, is that it need to be after Ur analista and Ur own Point of View.
Keep Ur trade simple
Abd do your own research, always.

EURUSD BUY SETUPEURUSD has touched our sloping support trendline and support zone , ITS still in an uptrend it just came for retest . so our expectations is that we might see it going up since it has tested the major zone but we stay watch on what's going to follow next .

EURUSD 4H - BUYOver all it's an uptrend, I believe price finish the correction by reach 61.8 Fib and price is showering Divergency in the daily Time farm, I expect price to continue with the uptrend.

EURUSD SHORTS IDEA
Key take away poins : FX:EURUSD
Fundamental :
The Euro has been weaker because of USA's tariff on the EU. Which caused an increased demand for USD, as the tariffs supports US economical growth, which boost the short term currency strength.
Technical :
EURUSD has made a break and retest of a previous SnR area.
We printed a H4 engulfing after we swept liquidity.
We have a strong LQ grab
Price retested a really POWERFUL trendline.
I will look to enter directly at the engulfing for some sell opportunities.
TMAS20X, entertainement purpose only. Not financial advice.
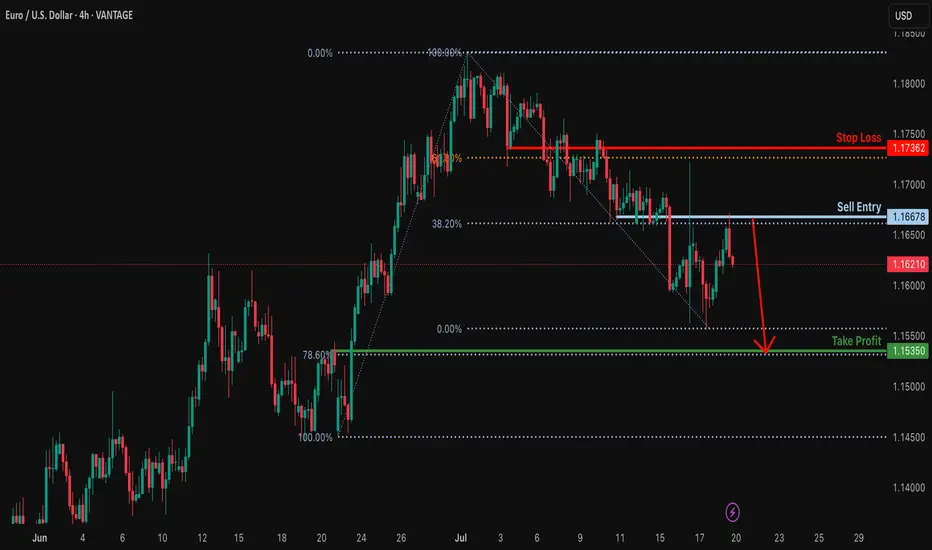
Bearish drop?EUR/USD has rejected off the resistance level which is a pullback resistance that lines up with the 38.2% Fibonacci retracement and could drop from this level to our tale profit.
Entry: 1.1667
Why we like it:
There is a pullback resistance that aligns with the 38.2% Fibonacci retracement.
Stop loss: 1.1736
Why we like it:
There is an overlap resistance that aligns with the 61.8% Fibonacci retracement.
Take profit: 1.1535
Why we like it:
There is a pullback support that lines up with the 78.6% Fibonacci retracement.
Enjoying your TradingView experience? Review us!
Please be advised that the information presented on TradingView is provided to Vantage (‘Vantage Global Limited’, ‘we’) by a third-party provider (‘Everest Fortune Group’). Please be reminded that you are solely responsible for the trading decisions on your account. There is a very high degree of risk involved in trading. Any information and/or content is intended entirely for research, educational and informational purposes only and does not constitute investment or consultation advice or investment strategy. The information is not tailored to the investment needs of any specific person and therefore does not involve a consideration of any of the investment objectives, financial situation or needs of any viewer that may receive it. Kindly also note that past performance is not a reliable indicator of future results. Actual results may differ materially from those anticipated in forward-looking or past performance statements. We assume no liability as to the accuracy or completeness of any of the information and/or content provided herein and the Company cannot be held responsible for any omission, mistake nor for any loss or damage including without limitation to any loss of profit which may arise from reliance on any information supplied by Everest Fortune Group.
BULLISH RUN ON EURUSD…When placing a parallel channel on the Daily timeframe on EU, it failed to breach through halfway of the channel. This means there’s not enough bullish momentum and therefore expecting a bearish signals at 1.18630

Week of 7/20/25: EURUSD AnalysisLast week's price action was bearish and has finally reached the extreme daily demand level and provided some reaction. Price has swept bulls and bears, so now we follow internal structure and wait to see where price actually wants to go. If internal 1h structure breaks bearish, we have confirmation to trade bearish until price goes deeper into the daily extreme zone.

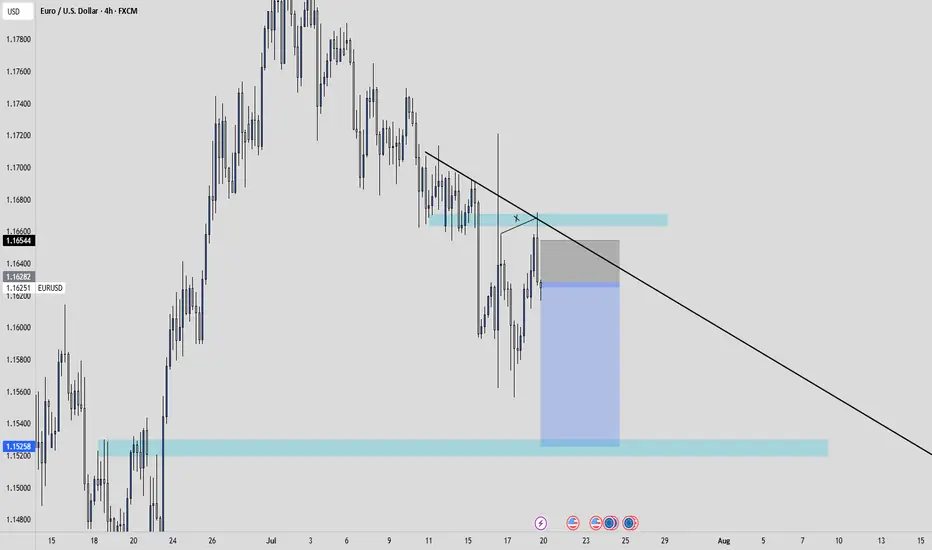
EURUSD - Bullish Bias with Tactical Short Setup• Pair: EURUSD
• Bias: Bullish overall | Tactical short into demand
• HTF Overview (4H):
• Bullish structure confirmed.
• Price took out SSL liquidity — likely draw is internal structure OB below.
• Expecting deeper pullback before continuation.
• MTF Refinement (30M):
• Looking for price to sell off into 4H OB.
• Price already mitigated 30M OB and rejected — watching for follow-through.
• LTF Confirmation (5M):
• Still in analysis mode — waiting on a CHoCH from 5M OB.
• Green lines on chart reflect 5M internal structure.
• Entry Zone:
• Enter short only after 5M shift confirms.
• Ride short into 4H OB demand zone.
• Targets:
• Short-term: 30M lows.
• Major: 4H OB for bullish reaction.
• Mindset Note:
• No rush to enter — analysis leads, execution follows.
• Let price deliver confirmation before switching to trader mode.
Bless Trading!

It has a good risk-reward ratio.Hello friends..
The transaction shown, if it reaches the specified area, you can enter the transaction in the lower time frame with confirmation.
Follow our page to see more analysis.
Eurusd sellStrong sell expected
Monthly and weekly overbought pair
Daily time frame buy trend break confirmation
Ready for the bearish correction

EURUSDEURUSD needs one more push up as correction before a drop.
Disclosure: We are part of Trade Nation's Influencer program and receive a monthly fee for using their TradingView charts in our analysis.

EUR/USD - Pattern & SMA PerspectiveDear Friends in Trading,
How I see it,
Keynotes:
A] Under Pressure
B] Previous Swing Support Area
C] Contraction/Accumulation
Rangebound pattern:
1) Short term correction trend holding firm
2) Decisive breakout expansion required above or below range
3) Pair suggests that greenback bulls are in charge at this time
I sincerely hope my point of view offers a valued insight.
Thank you for taking the time study my)) analysis.

EURUSD - BUY - Doesn't need any more confirmations..EURUSD - Bumping short term. Get your entries. Doesn't need any more confirmations..
DXY was looking for More Liquidity to sweepIt appears that the DXY was searching for more liquidity before continuing its decline. There are good buying areas for the EURUSD, as the liquidity swept to the bottom, and the immediate rebound indicates the strength of this area and can be considered a buying zone.
This area coincides with the 61 Fibonacci support line, confirming the possibility of an upside move.
The GBPUSD was targeting the bottom to trigger a liquidity sweep on the weekly timeframe. This is also an SMT signal, but it is somewhat weak, but it confirms the complete vision of the analysis.

EURUSDThe Euro-Dollar has fallen to the downtrend line and reached the top of the ascending channel. We are expecting a pivot to form and reach the bottom of the ascending channel.

EURUSD buyThe eurusd looks set for upward move , its in a huge uptrend on the daily chart so this pullback down looks perfect for a return to the highs, now back to the 2 hr chart and we can see we have clearly bounced off a dynamic support zone not once but twice and formed a double bottom then for the first time since July 4th we have broken up throughout the 50 day moving average breaking the structure and returning back , I can now see a move upwards from here.
