eurusd upin my pov euro dollar is going up, first instance until 1.1670 then 1.1730 after that maybe until 1.18 oreven 1.19
USDEUX trade ideas


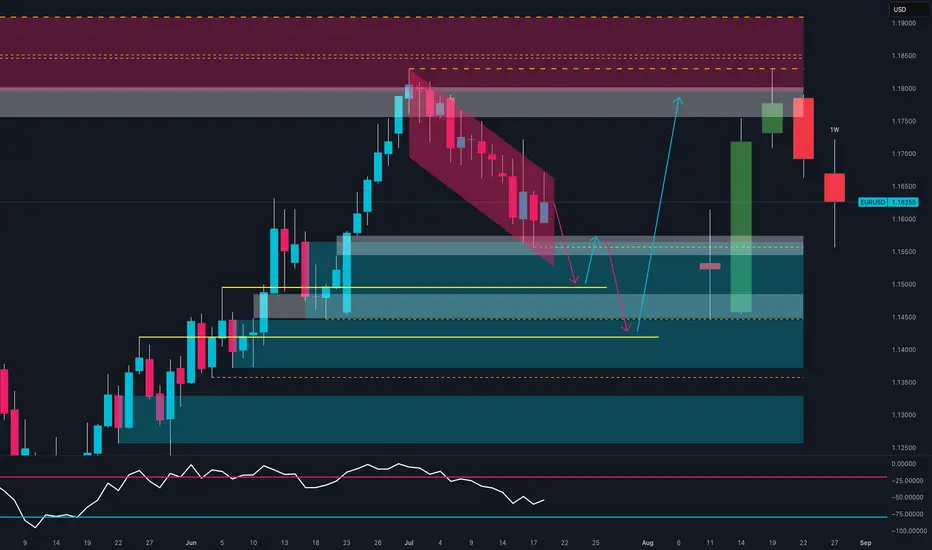
EURUSD: Support & Resistance Analysis For Next Week 🇪🇺🇺🇸
Here is my latest structure analysis and important supports/resistances
for EURUSD for next week.
Consider these structures for pullback/breakout trading.
❤️Please, support my work with like, thank you!❤️
I am part of Trade Nation's Influencer program and receive a monthly fee for using their TradingView charts in my analysis.

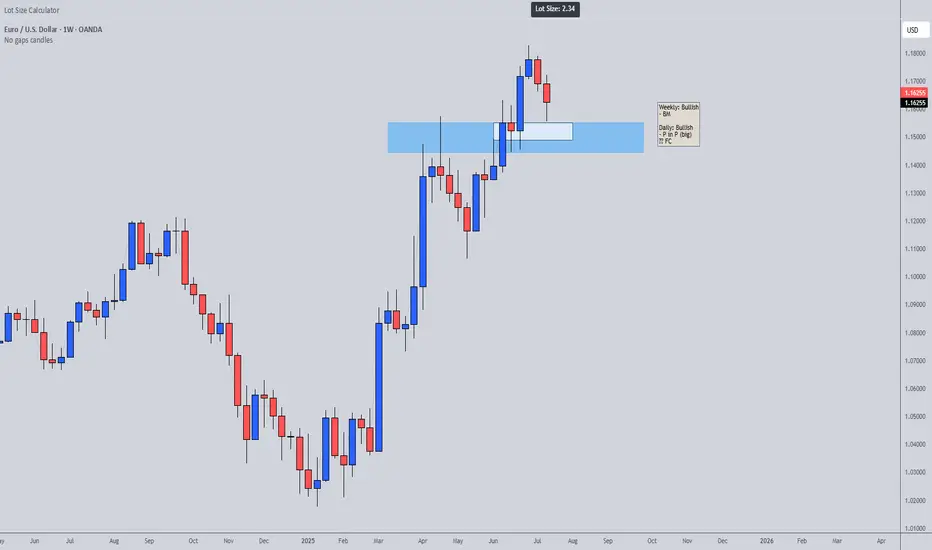
EURUSD potential being range recently story background:
1. a strong bullish momentum appear 23Jun - 1Jul
2. potential range of price level between 1.17176 and 1.15625
position enter criteria
1. if the price reach the key support lv 1.15451 and rebound with strong bullish momentum >>> the first entry point would be around 1.15693
2. if the price breakout the key resistance lv of 1.17183, i will wait for the price retest to around 1.16350 to long again

EURUSD Analysis week 30🌐Fundamental Analysis
The USD rose after June retail sales beat expectations and initial jobless claims fell to 221,000. However, the USD's gains were limited as US stocks rebounded late in the session.
On Friday morning, US stock index futures rose 0.2%, indicating that risk sentiment remains dominant. If this trend continues, EUR/USD could hold support.
The next focus is on the Consumer Sentiment and Inflation Expectations Index data from the University of Michigan. If the data is positive, the USD could regain support and put pressure on EUR/USD.
🕯Technical Analysis
EURUSD is in a corrective downtrend towards the 1.145 support. If this support zone is broken, the EURUSD trend will turn to a Downtrend. Currently, the main trading strategy will be to look for SELL points. After price reacted at EMA and trendline and headed to temporary bottom 1.156 and hit important support soon.
📈📉Trading Signals
SELL EURUSD 1.17500-1.17700 Stoploss 1.18000
BUY EURUSD 1.14500-1.14300 Stoploss 1.14000

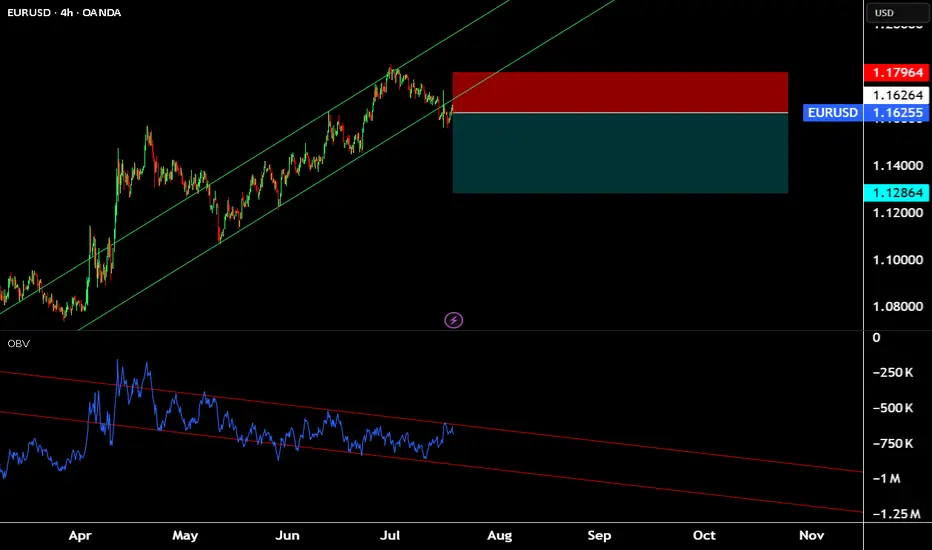
Time to play the Euro It's hard for me to remember the last time the Euro burned me. its been a long trend since liberation day. Time to play the Euro this week, Volume Divergence. Eurozone PMIs
EURUSD Is Weaker vs USD. Look For Sells!Welcome back to the Weekly Forex Forecast for the week of July 21-25th.
In this video, we will analyze the following FX market:
EURUSD
Expecting the USD to continue to push higher, which would further drag the EURO down. Look to take advantage of this dynamic and wait for sell setups!
Enjoy!
May profits be upon you.
Leave any questions or comments in the comment section.
I appreciate any feedback from my viewers!
Like and/or subscribe if you want more accurate analysis.
Thank you so much!
Disclaimer:
I do not provide personal investment advice and I am not a qualified licensed investment advisor.
All information found here, including any ideas, opinions, views, predictions, forecasts, commentaries, suggestions, expressed or implied herein, are for informational, entertainment or educational purposes only and should not be construed as personal investment advice. While the information provided is believed to be accurate, it may include errors or inaccuracies.
I will not and cannot be held liable for any actions you take as a result of anything you read here.
Conduct your own due diligence, or consult a licensed financial advisor or broker before making any and all investment decisions. Any investments, trades, speculations, or decisions made on the basis of any information found on this channel, expressed or implied herein, are committed at your own risk, financial or otherwise.


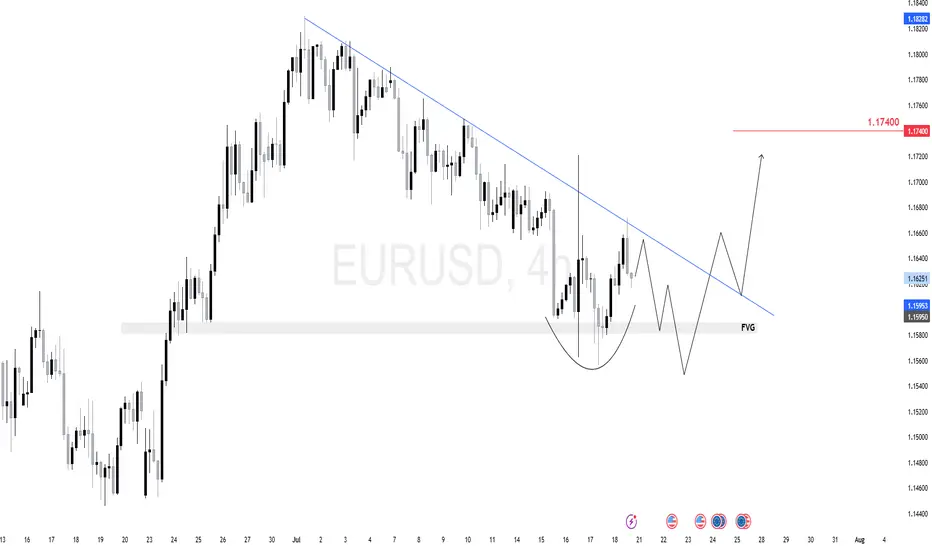
$EU (EURUSD) 4HEURUSD is forming a potential inverse head-and-shoulders just above a 4H fair value gap (FVG).
We expect one more dip toward the 1.1580–1.1595 zone to complete the right shoulder and tap demand.
From there, a breakout above the descending trendline can target 1.1740 next.
The key here is watching the reaction after the FVG test — if buyers step in strong, we ride it up.
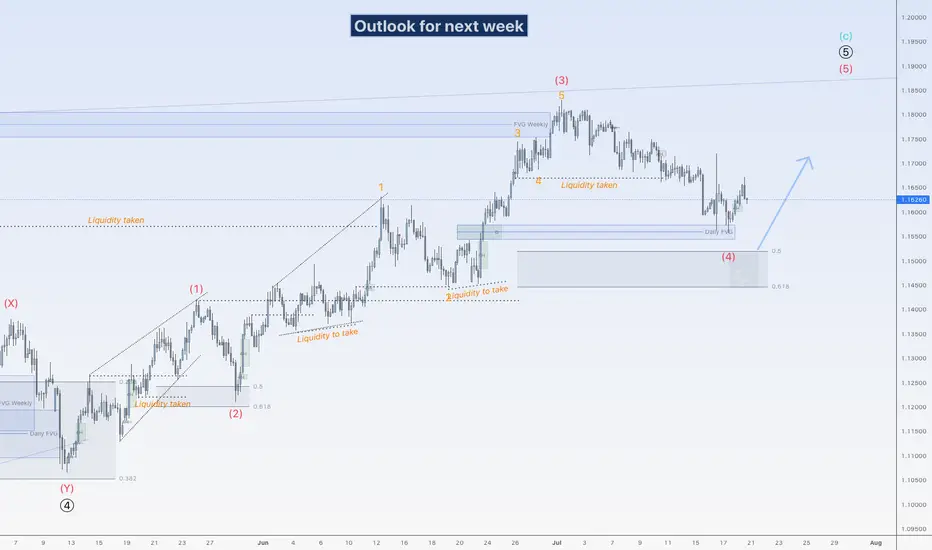
EU could go up againHi traders,
Last week EU continued the slowly down movement to the next bullish Daily FVG. Price rejected from there and swept the low of the rejection. After that it slowly went up again.
Next week we could see price go higher for the start of the next (impulsive or corrective) wave up.
Let's see what the market does and react.
Trade idea: Wait for the finish of a correction down and a change in orderflow to bullish on a lower time frame to trade longs.
If you want to learn more about trading with FVG's, liquidity sweeps and Wave analysis, then make sure to follow me.
This shared post is only my point of view on what could be the next move in this pair based on my technical analysis.
Don't be emotional, just trade your plan!
Eduwave
Smart Money Reloading: Will EUR/USD Explode from Demand Zone?📊 Technical Context (Daily)
EUR/USD is currently in a corrective phase following the strong June rebound from the 1.1450 area, which culminated in a high near the 1.1850 supply zone.
The recent bearish move has pushed the pair back into a key demand area between 1.1450 and 1.1550, a zone that has acted as support multiple times in the past.
The latest weekly candle shows a potential bullish exhaustion signal (long lower wick), with the RSI hovering in oversold territory.
📌 Primary scenario: Possible consolidation above 1.1550 followed by a bullish continuation toward 1.1750–1.1800.
📌 Alternative scenario: Break of the recent lows could lead to a deeper retest of the 1.1350 zone.
📈 COT (Commitment of Traders)
Non-commercial positioning shows growing bullish interest in the euro:
EUR: +971 new longs, -6,654 shorts → strong increase in net long exposure.
USD Index: -267 longs, +92 spreads → signs of institutional indecision on the dollar.
This suggests a favorable shift toward the euro by smart money.
💡 Retail Sentiment
Retail traders remain heavily short on EUR/USD (63% short) with an average entry price of 1.1579.
This reinforces the contrarian bullish case, as retail traders are trapped short in a potential reversal zone.
📆 Seasonality
Historically, July has been a bullish month for EUR/USD:
➕ 2Y average return: +0.0287
➕ 5Y average return: +0.0166
This supports a seasonal bullish bias aligning with the current technical setup.
✅ Operational Outlook
EUR/USD is trading at a technically and macroeconomically significant area. The confluence of:
Weekly demand zone being tested
RSI in oversold conditions
COT positioning favoring the euro
Retail sentiment skewed short
Bullish seasonality
…makes a bullish bounce plausible in the coming weeks, with a first target at 1.1750. Invalidation level below 1.1450.
📌 Bias: Moderately Bullish
📍 Technical Activation Zone: Above 1.1550 with confirmed bullish price action
EURUSD is Nearing an Important Support!!Hey Traders, in today's trading session we are monitoring EURUSD for a buying opportunity around 1.15400 zone, EURUSD is trading in an uptrend and currently is in a correction phase is in a correction phase in which it is approaching the trend at 1.15400 support and resistance area.
Trade safe, Joe.

EURUSD: Long Trade with Entry/SL/TP
EURUSD
- Classic bullish setup
- Our team expects bullish continuation
SUGGESTED TRADE:
Swing Trade
Long EURUSD
Entry Point - 1.1627
Stop Loss - 1.1586
Take Profit - 1.1711
Our Risk - 1%
Start protection of your profits from lower levels
Disclosure: I am part of Trade Nation's Influencer program and receive a monthly fee for using their TradingView charts in my analysis.
❤️ Please, support our work with like & comment! ❤️
EURUSD – WEEKLY FORECAST Q3 | W30 | Y25📊 EURUSD – WEEKLY FORECAST
Q3 | W30 | Y25
Weekly Forecast 🔍📅
Here’s a short diagnosis of the current chart setup 🧠📈
Higher time frame order blocks have been identified — these are our patient points of interest 🎯🧭.
It’s crucial to wait for a confirmed break of structure 🧱✅ before forming a directional bias.
This keeps us disciplined and aligned with what price action is truly telling us.
📈 Risk Management Protocols
🔑 Core principles:
Max 1% risk per trade
Only execute at pre-identified levels
Use alerts, not emotion
Stick to your RR plan — minimum 1:2
🧠 You’re not paid for how many trades you take, you’re paid for how well you manage risk.
🧠 Weekly FRGNT Insight
"Trade what the market gives, not what your ego wants."
Stay mechanical. Stay focused. Let the probabilities work.
FRGNT FOREX ANALYSIS 📊

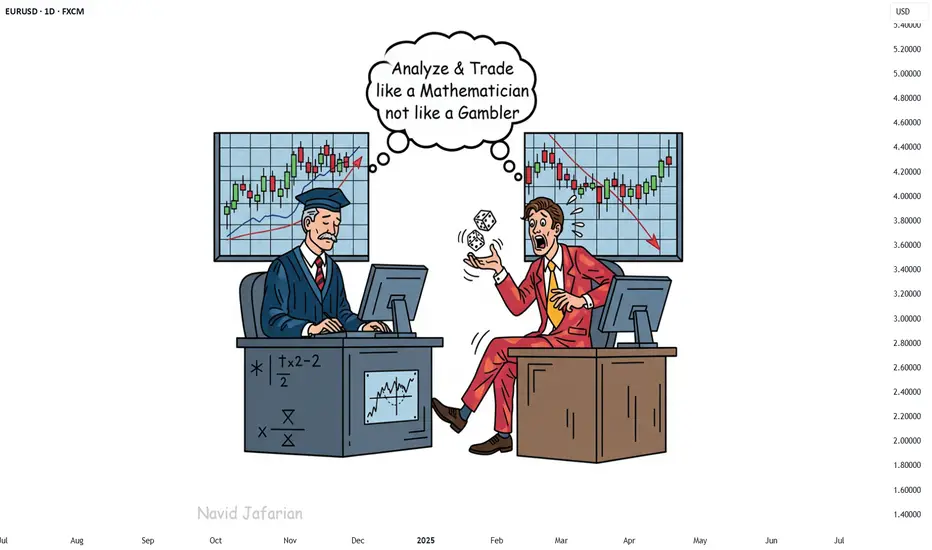
123 Quick Learn Trading Tips - Tip #7 - The Dual Power of Math123 Quick Learn Trading Tips - Tip #7
The Dual Power of Math: Logic for Analysis, Willpower for Victory
✅ An ideal trader is a mix of a sharp analyst and a tough fighter .
To succeed in the financial markets, you need both logical decision-making and the willpower to stay on track.
Mathematics is the perfect gym to develop both of these key skills at the same time.
From a logical standpoint, math turns your mind into a powerful analysis tool. It teaches you how to break down complex problems into smaller parts, recognize patterns, and build your trading strategies with step-by-step thinking.
This is the exact skill you need to deeply understand probabilities and accurately calculate risk-to-reward ratios. 🧠
But the power of math doesn't end with logic. Wrestling with a difficult problem and not giving up builds a steel-like fighting spirit. This mental strength helps you stay calm during drawdowns and stick to your trading plan.
"Analyze with the precision of a mathematician and trade with the fighting spirit of a mathematician 👨🏻🎓,
not with the excitement of a gambler 🎲. "
Navid Jafarian
Every tip is a step towards becoming a more disciplined trader.
Look forward to the next one! 🌟
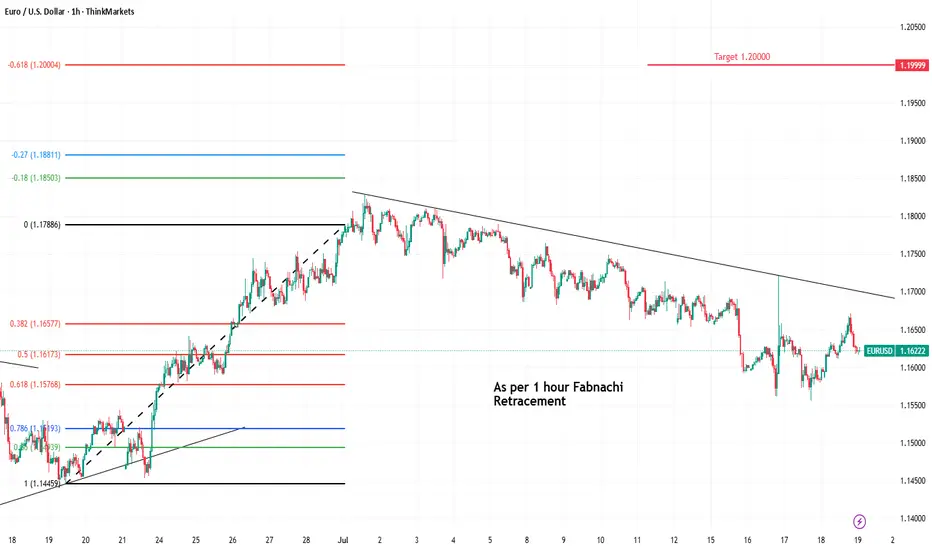
EUR/USD chart As Per 1 hour Time FrameEUR/USD chart As Per 1 hour Time Frame
Fibonacci Retracement Buy entry.
THINKMARKETS:EURUSD
Buy 1.16200
Target 1,20000
Stoploss 1.14300
eurusdin this week for eurusd
its break down the line and pullback to it successfully.
now it can goes down to the 1.14550 zoon and if it happens we can wait for head and shoulder pattern .

EUR USD short setupwe had lower low so i say it may go further down , consider its Friday we may see ranging market so waiting for over price can be logical ...
Please note: This is for educational purposes only and not a trading signal. These ideas are shared purely for back testing and to exchange views. The goal is to inspire ideas and encourage discussion. If you notice anything wrong, feel free to share your thoughts. In the end, to learn is to share !

Sell eurusdStrong sell expected
Still weekly and monthly overbought pair
Bearish correction expected
Daily buy trend broken

EUR/USD Daily Chart Analysis For Week of July 18, 2025Technical Analysis and Outlook:
In the current trading session, the Euro has continued its decline, completing our Mean Support level of 1.160. Recent analyses indicate that the Euro is likely to experience a sustained downward trend, with an anticipated retest at the Mean Support level of 1.159 and a possible further decline to reach a Currency Dip of 1.152. Nevertheless, it is crucial to consider the potential for a dead-cat bounce toward the Mean Resistance level of 1.167, which could trigger a significant reversal of the downtrend and target a Currency Dip of 1.152.

EURUSD SELL SETUPThis is my view on eurusd, kindly watch and share your opinion in the comment section

