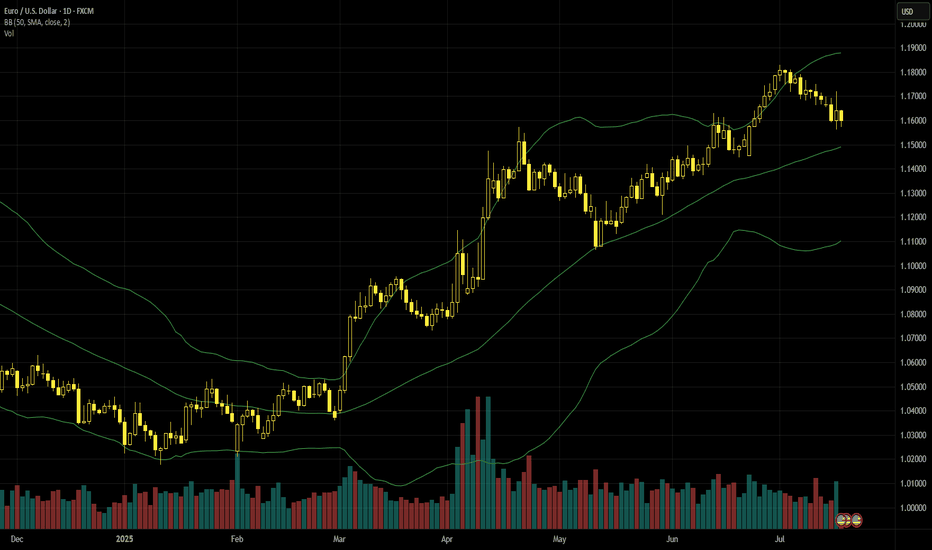
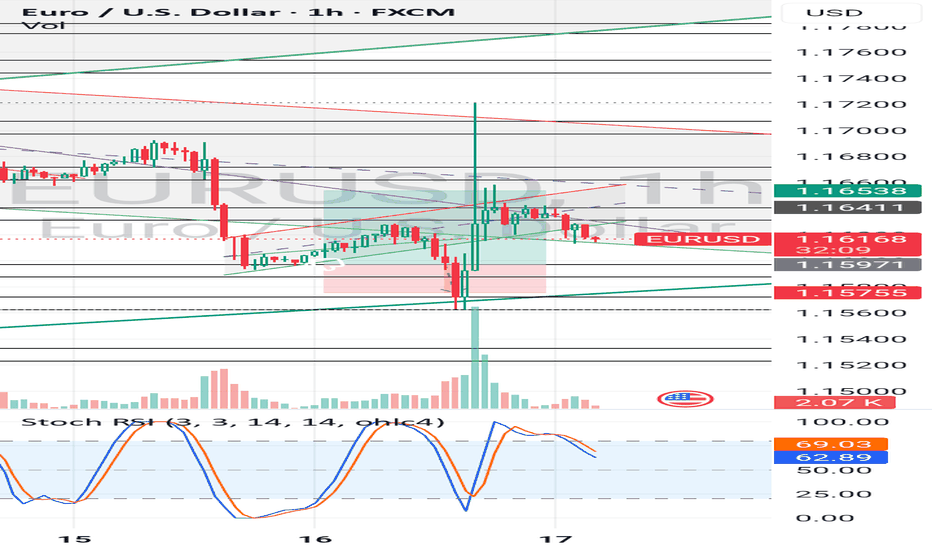
Euro-dollar pushes below $1.16 for nowThe announcement of 30% American tariffs on the EU from 1 August caused some negativity on the prospects for the bloc’s economy, but as with any similar announcement so far this year it’s likely that the figure can be negotiated down or just backtracked by the American government. A more immediate important factor driving euro-dollar down has been the significant rise in American annual headline inflation in June to 2.7%. The ECB is likely to cut once more this year and the Fed twice, but there’s some intrigue on the timing of the latter.
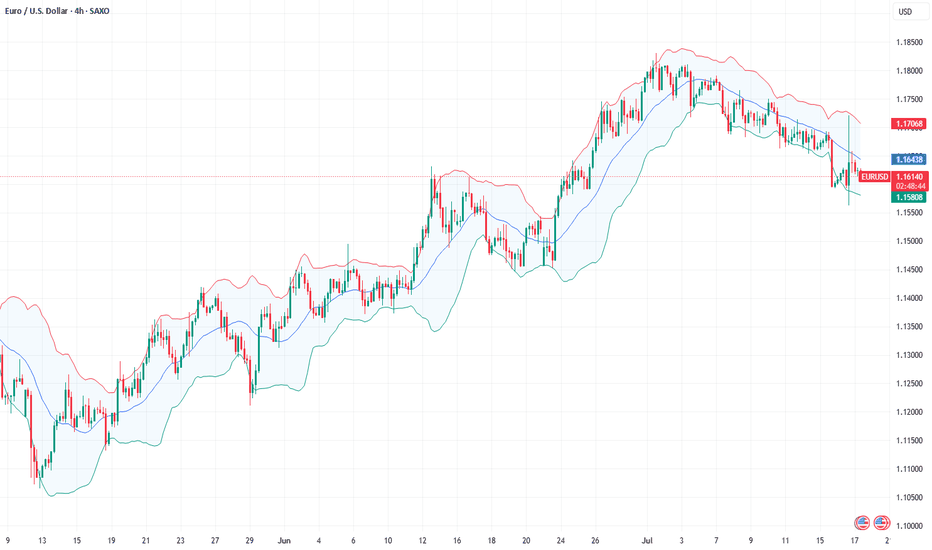
The retreat from the area of $1.18 – a high of nearly four years – has so far been fairly consistent with some momentum. However, $1.16 still seems to be an important battleground, with the long wick on 16 July indicating buying pressure. With the price currently oversold and there not being a clear uptick in selling volume, the 50 SMA around $1.155 might be an important short-term dynamic support.
A move back up to the 38.2% monthly Fibonacci retracement around $1.166 seems possible in the next few days depending on the volume of buying and reactions to upcoming news. For now, the movement seems more like a relatively small retracement in the context of the uptrend than the beginning of a new downward or sideways trend, but this depends on the reaction to the ECB’s meeting on 24 July as well.
This is my personal opinion, not the opinion of Exness. This is not a recommendation to trade.
USDEUX trade ideas
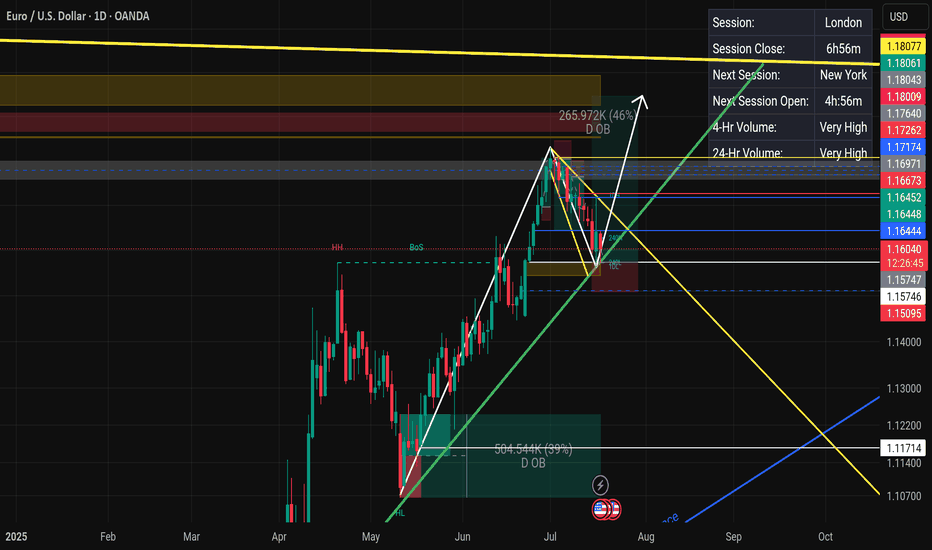
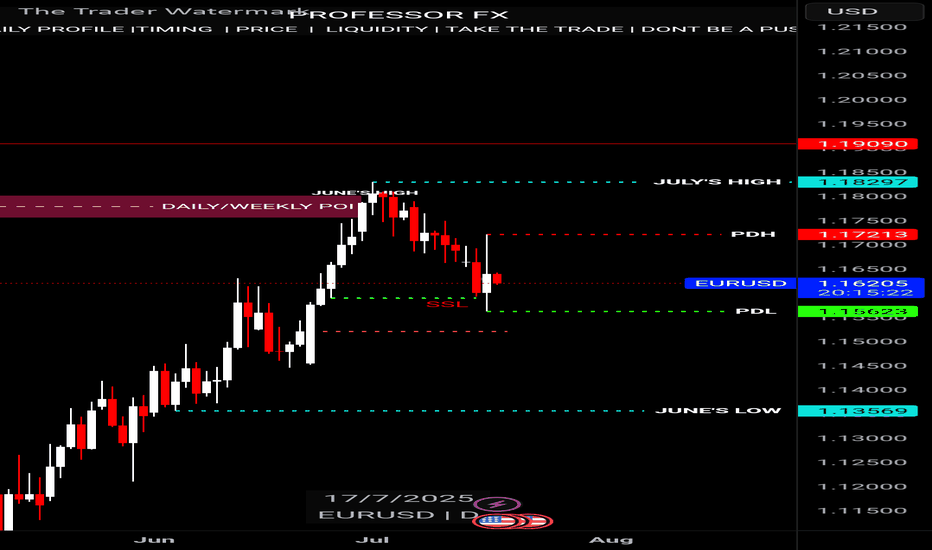
BullsHaving in mind that the have been in buys through the year so far. This would be a flag formation and we currently on the daily FVG which provides an entry to continuation in buys.
NB we have a resistance line and that would be iur target before EURUSD starts to dunp massively. Closure below the FVG will result in closure of the buys.
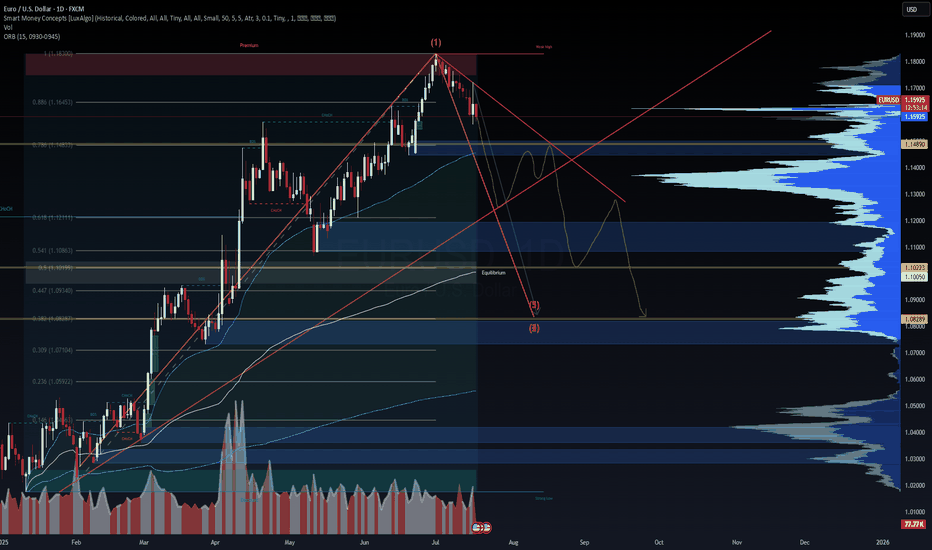
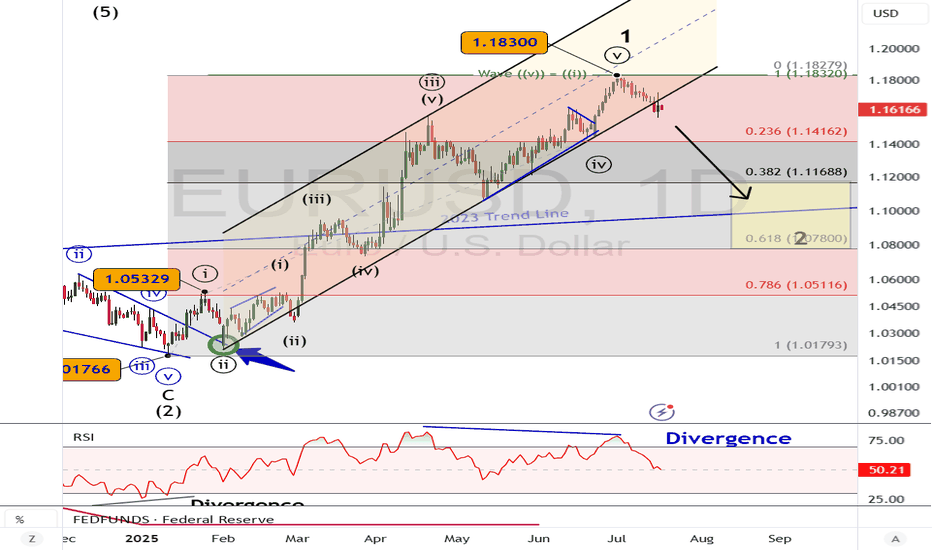
EUR/USD Bearish Wave Outlook Into September 2025EUR/USD Bearish Wave Outlook Into September 2025
Technical + Elliott Wave + Macro View
EUR/USD has likely completed a major top at 1.18300, which aligns with the 1.0 Fibonacci extension. This level acted as a liquidity sweep before reversing sharply, marking the top of Wave (1) in the current Elliott sequence. We're now entering Wave (3) to the downside—a high-momentum leg often driven by macro confirmation.
Price has broken the ascending channel and rejected the 0.786 and 0.886 retracement zones. With lower highs forming, the structure is weakening. The next likely target sits around 1.10223, a key Fibonacci and order block confluence. If momentum accelerates, EUR/USD could continue toward 1.08289, completing the full Wave (2).
From a macro lens, the divergence between the Fed and ECB continues to widen. The U.S. economy remains resilient with sticky inflation and strong yields supporting the dollar. In contrast, Europe is showing signs of stagnation, with Germany and France struggling to post meaningful growth. This favors continued downside on the pair.
Expect potential relief rallies into 1.1400–1.1550, but these are likely to be sold unless a fundamental catalyst shifts sentiment.
Bias: Bearish
Targets: 1.1022 > 1.0828
Invalidation: Clean break and close above 1.1700
—
🔔 Watch for volume spikes and failed reclaims of structure as confirmation. DSS signals aligned.
#EURUSD #Forex #ElliottWave #SmartMoneyConcepts #MacroTrading #WaverVanir #VolanX #DollarStrength #FXForecast #TechnicalAnalysis
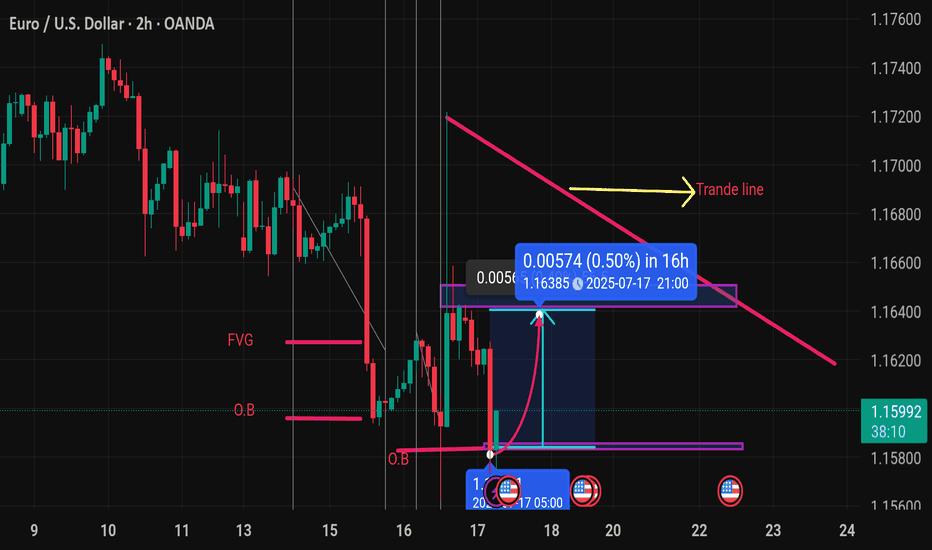
Eurousd techinical analysis.This chart shows a technical analysis of the EUR/USD currency pair on a 2-hour timeframe. Let's break down the elements and implications:
---
Key Chart Elements:
Current Price: 1.15988
Bullish Move Expected:
A potential price increase of 0.00574 (0.50%), targeting 1.16385 around 21:00 on July 17, 2025.
This is indicated by the curved arrow pointing upwards and the blue box highlighting a projected move.
FVG (Fair Value Gap):
This zone often represents inefficiencies in the market where price might return to fill the gap. There's a visible FVG around the current action zone.
O.B (Order Block):
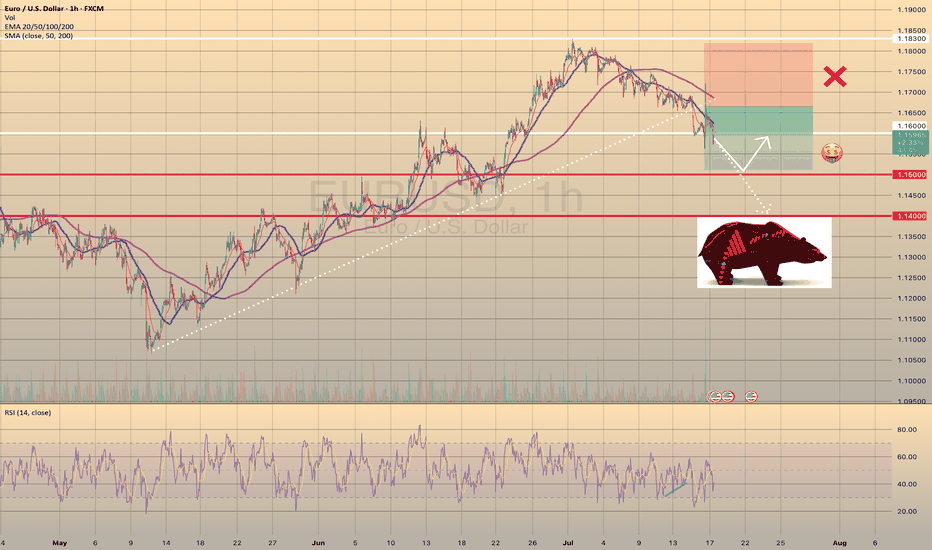
EURUSD - BEARISH TREND CONTINUESEURUSD - BEARISH TREND CONTINUES📉
On Tuesday, despite the bullish divergence (highlighted as green on RSI), the price broke through the trendline, formed since the beginning of May. Yesterday this trendline got retested on Bloomberg's rumor that Powell may resign. Currently the price is going through the support level of 1.16000.
I see the major way is to go towards 1.15000 support level with a further rebound and possible target of 1.16000. Another option is to go straight towards 1.14000. Will see.
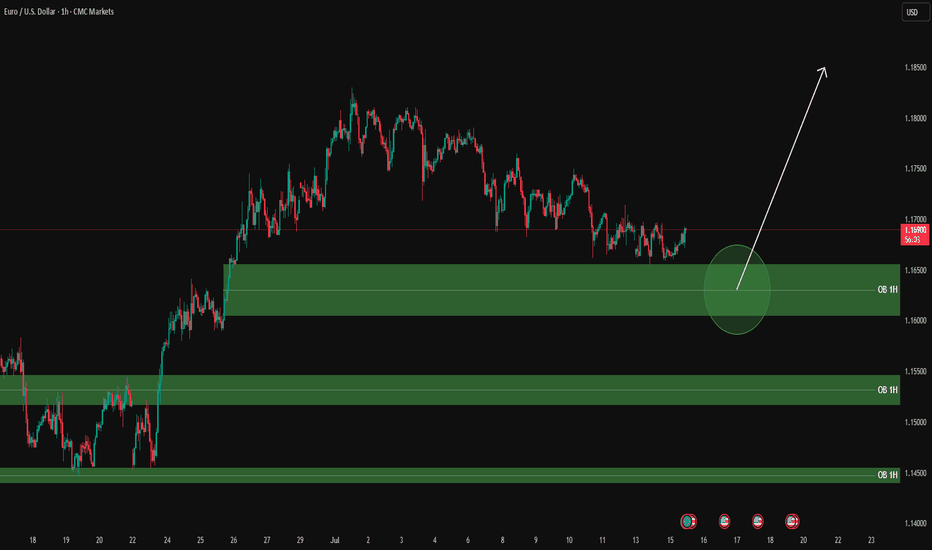
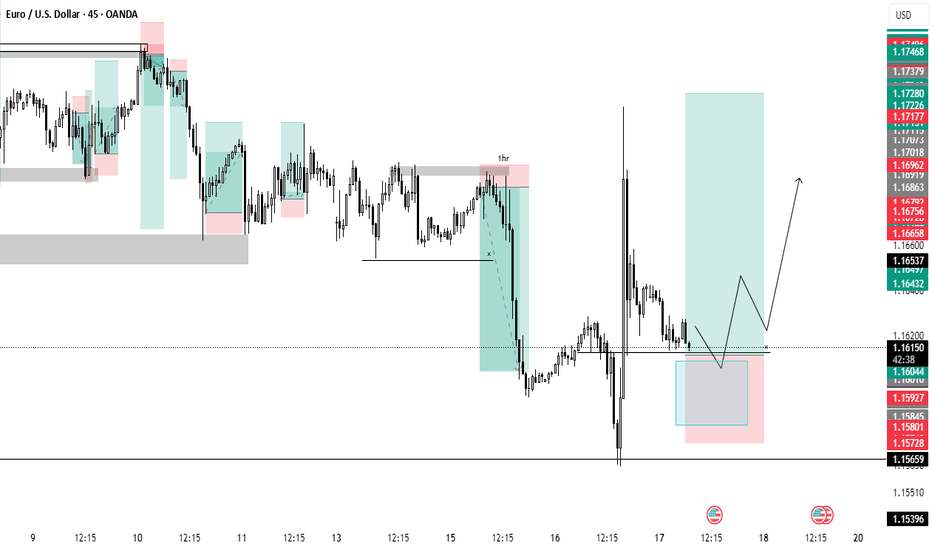
EURUSD analysis – 1H OB Setup
✅ Green zones = 1H Buy Order Blocks
Clean plan:
Wait for price to reach the green circle zone (1.1600 – 1.1650 OB).
Once there:
✅ Drop to LTF (5M / 3M) and wait for:
Price reaction to the OB zone
BOS / CHoCH structure confirmation
Strong bullish candle for clean entry
Then, enter with stop below the OB zone.
🎯 Targets:
First TP: 1.1690 – 1.1700
Second TP: higher previous highs if momentum continues
⚠️ Let price enter your zone, get your LTF confirmations, and then take your entry with discipline.
📊 ProfitaminFX | Gold, BTC & EUR/USD
📚 Daily setups & educational trades
EURUSD FORMING BEARISH TREND STRUCTURE IN 15 MINUTES TIME FRAMEEURUSD is forming lower lows and lower highs.
Sellers are maintaining selling pressure from late few sessions.
Market is expected to remain bearish in upcoming trading sessions.
On lower side market may hit the target level of 1.17100
On higher side 1.18100 can act as an important resistance zone.
Fundamental Market Analysis for July 17, 2025 EURUSDThe euro is edging back toward the 1.16 – 1.17 range highs after headlines suggesting former U.S. president Donald Trump might try to dismiss Fed Chair Jerome Powell and a softer-than-expected U.S. Producer Price Index (PPI) print pressured the dollar. Political noise around the Fed’s independence, coupled with a cooling inflation pulse, has pushed market pricing toward a longer policy pause; the pair is hovering near 1.16250 at the time of writing.
Fundamental support also stems from the upcoming 24 July ECB meeting. Governing-Council commentary reveals a split between hawks and would-be doves, yet consensus that euro-area inflation remains above target makes an aggressive rate cut unlikely for now. Meanwhile, subdued U.S. Treasury yields—futures price a 95 % probability of no change this month and only 50 bp of total easing over 12 months—help narrow the U.S.–German 10-year spread to about 150 bp.
Against a backdrop of ongoing U.S. trade tensions and steady inflows into euro-area assets, that narrower spread leaves room for EURUSD to grind toward the 1.1680 target if sentiment stays risk-positive.
Trading recommendation: BUY 1.16250, SL 1.15950, TP 1.16800
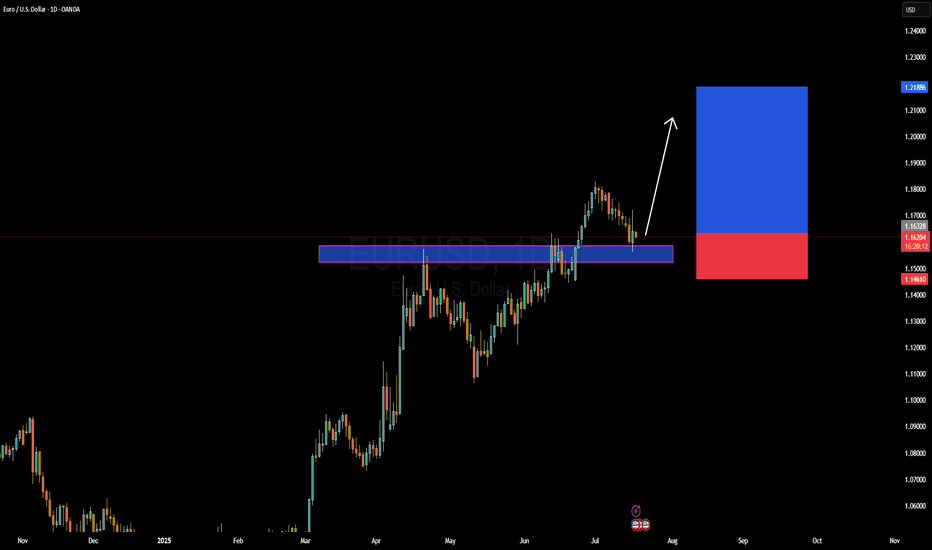
EURUSD Forming Bullish Continuation SetupEURUSD is currently retesting a key breakout zone that previously acted as resistance and is now serving as strong support around the 1.1620–1.1630 area. After a healthy bullish impulse in recent weeks, the pair is pulling back in a controlled manner, likely forming a bullish continuation setup. I entered from earlier levels and remain confident in a further upward move, with the structure showing signs of a new bullish wave forming.
From a fundamental perspective, the euro is gaining strength as the European Central Bank (ECB) continues to signal a more cautious stance on rate cuts compared to the Federal Reserve. US inflation data released last week came in softer than expected, increasing speculation that the Fed could start its rate-cutting cycle as early as September. This shift in monetary policy outlook has weighed on the US dollar, opening up room for EURUSD to push higher.
Additionally, eurozone macro data is showing early signs of recovery, especially in Germany, where industrial production and sentiment indicators are slowly improving. As inflation in Europe trends lower but remains sticky, the ECB has fewer reasons to rush into easing, which adds strength to the euro over the medium term. This divergence is a critical driver of the current bullish sentiment in EURUSD.
Technically, the market is respecting a clean demand zone, with momentum indicators starting to flatten after the recent correction. With the trend structure intact and fundamentals aligned, I'm targeting the 1.2180–1.2200 zone as the next leg of this bullish cycle. Price action remains favorable, and the broader sentiment on TradingView is also increasingly bullish, confirming my conviction in this setup.
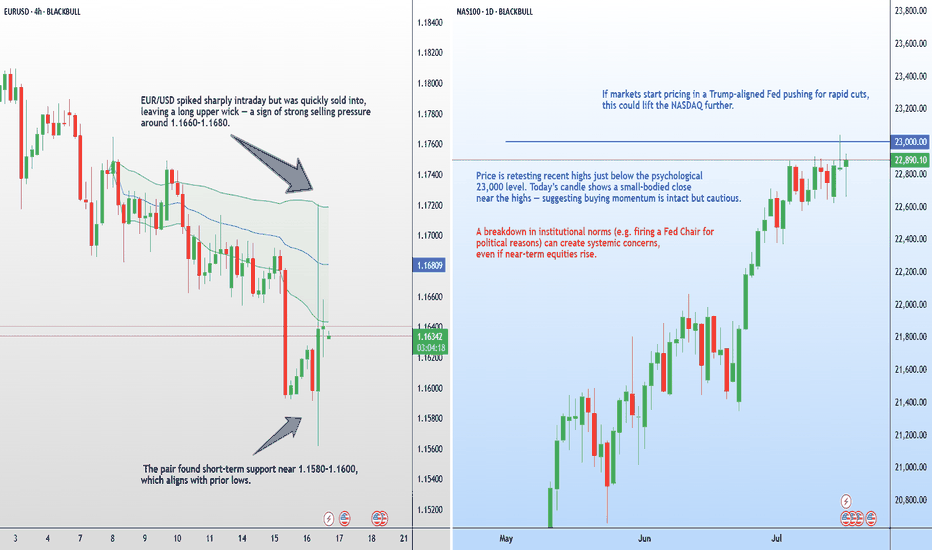
Buying opportunities on EURUSDYesterday, EURUSD saw a sharp spike after reports that Trump might fire the Federal Reserve Chair.
Although this wasn’t confirmed, the news triggered short-term volatility before the market settled down again.
At the moment, EURUSD is reacting to key support levels. Watch for the formation of a higher low and potential signs of a new bullish move.
The goal remains a breakout above the previous high and continuation of the main uptrend.
EURUSD Elliott Wave: Top in PlaceExecutive Summary
Wave 1 rally from January 2025 to July 2025 appears complete
Decline to 1.1170 and possibly 1.08 in wave 2.
The support shelf near 1.1170 may contain the decline.
We now have enough evidence in place to consider a medium-term (or longer) top in place for EURUSD.
The weekly chart above shows a rally from the January 2025 low that reached the upper parallel at the July high. This rally appears to be complete and a sideways to lower consolidation is likely underway.
On January 24, we forecasted a rally with a second target of 1.18. EURUSD reached the target topping at 1.1830.
Now, it’s time to flip the scrip as a correction is likely underway to correct that strong rally.
The 6-month rally in EURUSD appears to have ended this month and a correction is likely underway to 1.1170 and possibly lower levels.
The top of EURUSD on July 1 is labeled as wave 1. The decline underway appears incomplete and would be wave 2.
Within the wave 1, wave ((v)) measures equal to wave ((i)) at 1.1832, just a couple of pips within the actual high. Additionally, there is RSI divergence within the wave ((v)) and wave ((iii)) highs. This is a common pattern within a fifth wave of an Elliott wave impulse pattern.
The next trend (lower) will likely carry to below 1.1170.
Near this level is the 38% Fibonacci retracement level of the 6-month rally. Additionally, there is a support shelf of broken resistance and congestion appearing between 1.1033 - 1.1275.
At the lower end of that price zone is a broken trend line dating back to 2023. Therefore, this price zone will offer up a strong level of support that may launch the next rally or at least a small bounce.
BOTTOM LINE
The Elliott wave impulse pattern from January to July 2025 appears over. A downward correction appears to have begun and may visit 1.1170 and possibly lower levels.
As the downward trend takes hold, we’ll review its structure to determine where we are at within the larger wave sequence.
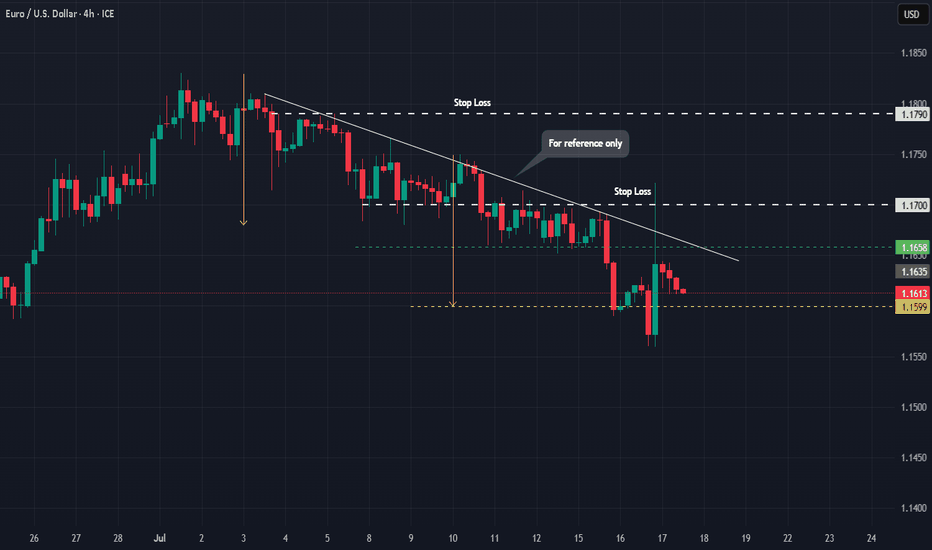
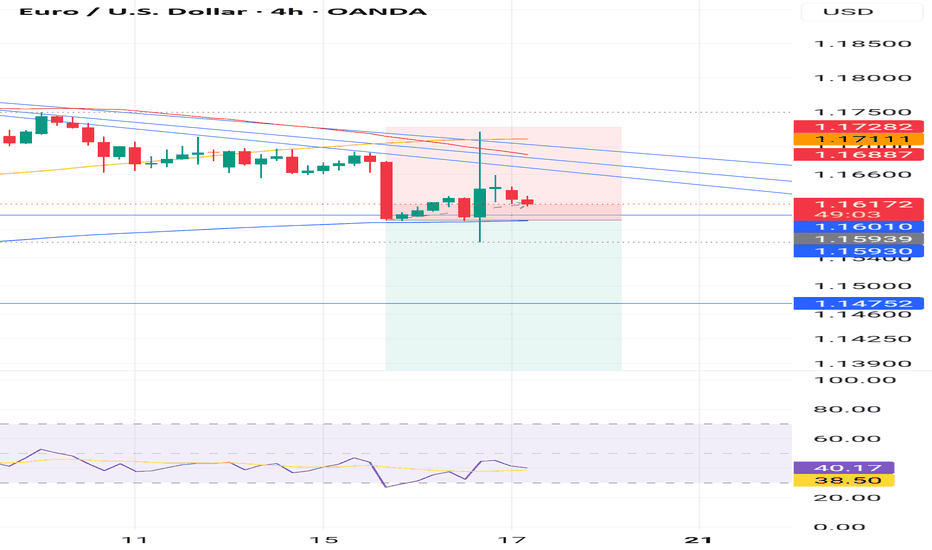
EUR USD LONG RESULT Euro Price had been trading inside a falling channel then broke down the channel holding the Order Block Support from which I Opened the long position, just misread/ didn't extend our sl taking the 4HTF Support Trendline into consideration which cost the downside to be taken first before heading up
But no worries, better Setups and Results on the way 🙌
_THE_KLASSIC_TRADER_.
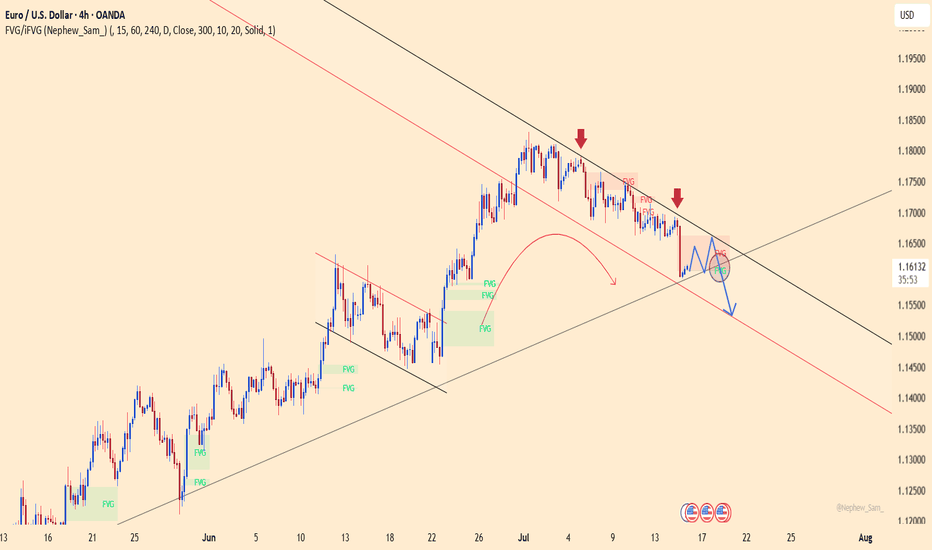
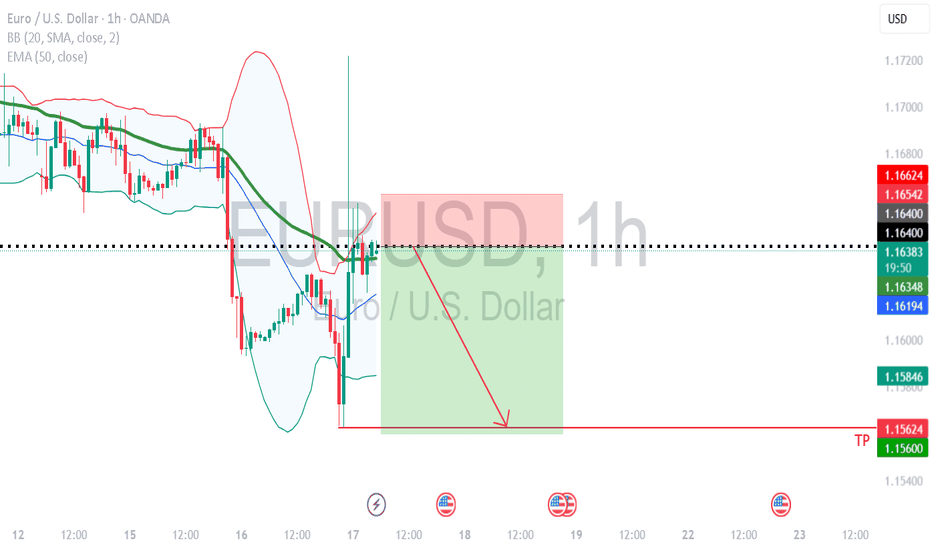
EURUSD – Weakness emerges at descending channel resistanceEURUSD remains within a well-defined descending channel and was recently rejected at the upper trendline – a key dynamic resistance zone. Price action shows the recovery is limited around 1.16600, with multiple FVG (Fair Value Gap) zones reinforcing the potential for further downside.
On the news front, the euro remains under pressure as Eurozone inflation data brought no surprises, while the US dollar is supported by June’s PPI rising exactly as expected at 0.2%. This combination leaves EURUSD with little momentum to break higher, making a move back toward the 1.15300 support area a scenario to watch.
If the price fails to break above 1.16600 and forms a lower high, the bearish trend will be further confirmed. Keep an eye on price behavior around the FVG zones to identify optimal entry points.
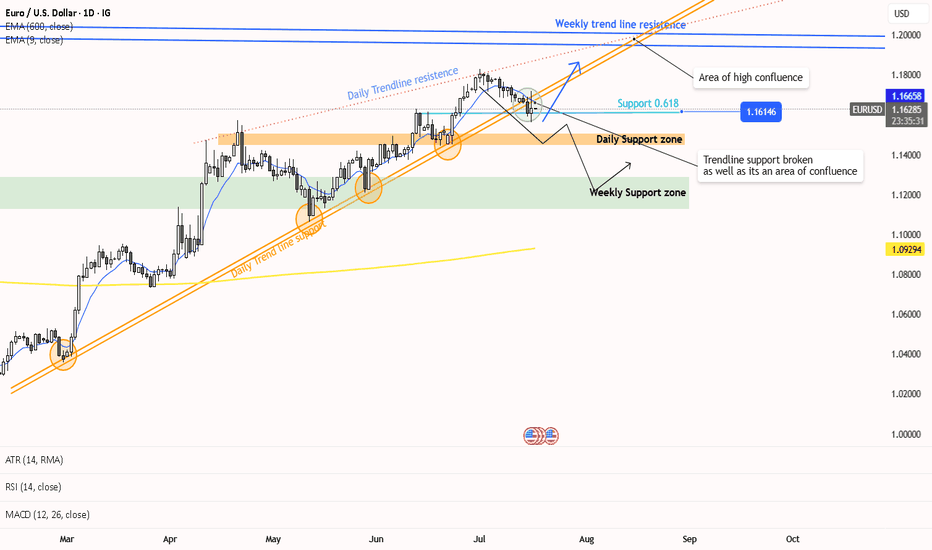
EUR/USD Trend Analysis: Pullback or Reversal?Alright Traders,
Looking at the charts, it seems price just broke below a really strong trend line support – that line held up multiple times (you can see the circled spots!).
Now, the big question is: Is this just a quick dip (a pullback) in our current uptrend, or is this the end of the uptrend altogether?
If the price holds up at the 1.16146 support level, we could see a strong move higher, potentially all the way to our daily trend line resistance (that dotted line).
But, if the 0.618 Fibonacci support level fails to hold, we might be looking at a short downtrend heading towards a daily or even weekly support zone.
My technical indicators are flashing 'buy' right now, but we know we can't just follow indicators blindly.
So, here's my plan: I'm waiting. I want to see if this pullback finishes and price starts climbing again, or if it clearly shows us the uptrend is over and a downtrend has started. Patience is key!
Timeframes used: Daily and Weekly
Current Trend: Uptrend"
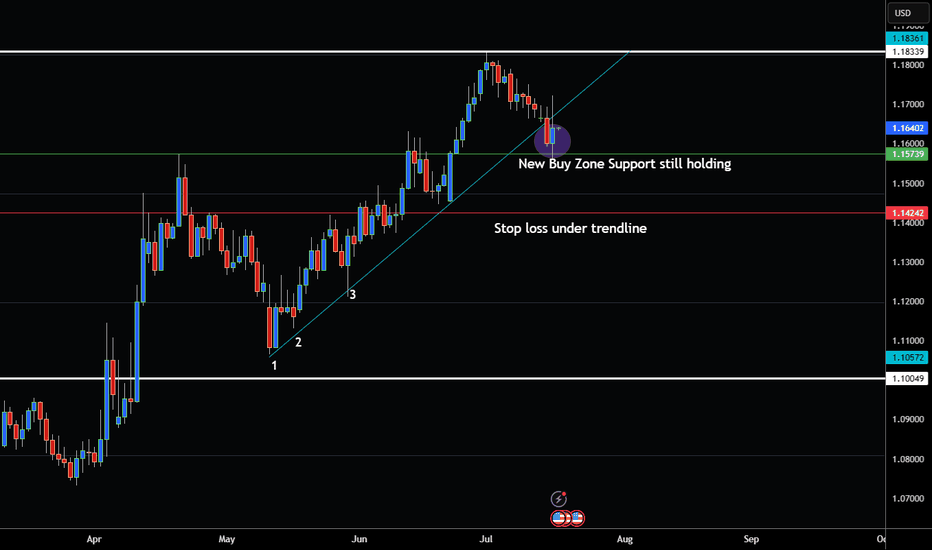
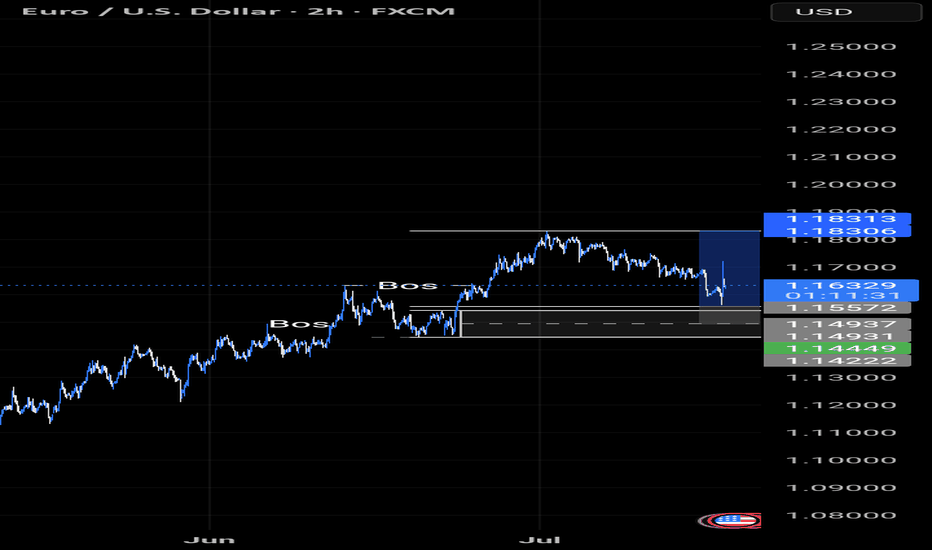
EUR/USD PULLS BACK TO BUY ZONE MORE UPSIDE AHEAD?Hey Traders so looking at Euro still looks bullish but again markets can change on a dime so always be cautious because we need to be good at defense just as much as offense in this game of trading.
Some say US Dollar may bottomed some say it's still going to weaken regardless of what do news says what can the charts show us?
I see a support level of 1.1573 holding for now I see new highs made at 1.1833.
Also I see higher lows and higher highs this all signals an uptrend but again trend changes happen.
However I still see enough to stay bullish for now so if your bullish consider buying here with a stop below support 1.1424
But if bearish I would wait for break below support at 1.1424 before selling into a rally. That way market confirms it wants to change trend.
Good Luck & Always use Risk Management!
(Just in we are wrong in our analysis most experts recommend never to risk more than 2% of your account equity on any given trade.)
Hope This Helps Your Trading 😃
Clifford
Fed warning: Rate cut rally or credibility crisis?JPMorgan and Goldman Sachs have both raised their concern about political interference at the Federal Reserve, amid reports that President Trump considered firing Fed Chair Jerome Powell earlier this week.
In a note titled “How Safe is Powell’s Job?”, JPMorgan analysts warned that even the perception of a politically motivated dismissal could undermine the Fed’s credibility and spark market volatility.
Goldman Sachs CEO David Solomon echoed the concern in a CNBC interview, describing central bank independence as “super important,” and warning that it remains a pillar of global economic stability that “we should fight to preserve.”
The warnings followed a volatile 24-hour period in markets, after reports emerged that Trump had drafted a letter to dismiss Powell and floated it among Republican leaders. This might prove the right distraction from the Epstein client list?
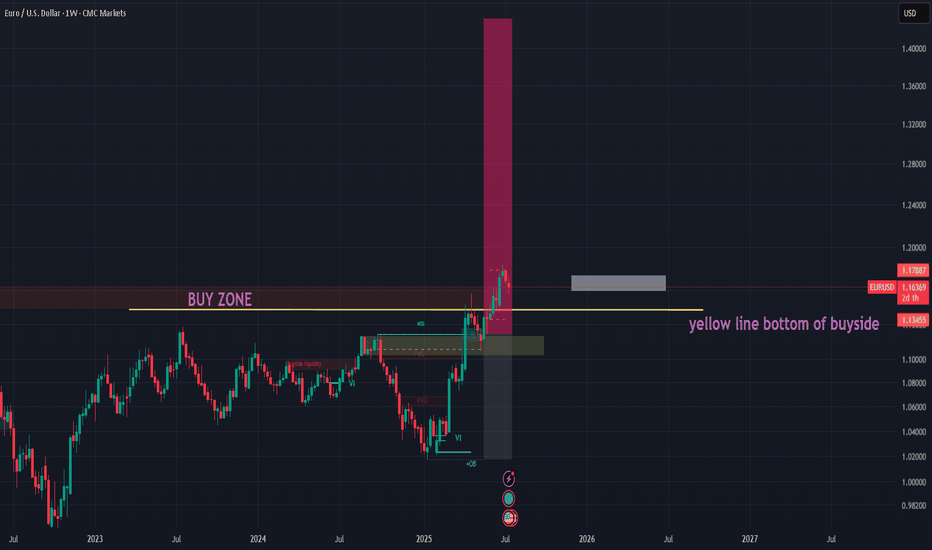
EURUSD BUY IDEA SWING PLAY (WEEKLY) Outlook🔁 EUR/USD Long – Weekly Buyside Re-Test for 1.17 Breakout 🌍📈
Description:
EUR/USD is retesting a weekly buyside liquidity zone between 1.1575–1.1600, which previously acted as strong resistance and has now flipped into support. This zone aligns with a confluence of breakout structure, Fibonacci mid-point, and a clean liquidity sweep beneath local lows.
📉 Trade Setup:
Entry Zone: 1.1475–1.1600 (buyside retest)
Stop Loss: 1.1400 Zone (risker)
Safer stop: use chart
Target 1: 1.1777
Target 2: 1.1877
Target 3: Open(manage)
Risk-Reward: ~1:3+ depending on entry precision
Trade Type: Swing / Trend Continuation
📊 Technical Bias:
Weekly structure flipped bullish after breakout above 1.1575
Daily shows clean HH/HL sequence with strong momentum
RSI/MACD favor continuation with no divergence yet
DXY weakness supports continuation move
🧠 Macro + Sentiment Overlay:
EUR supported by improving Eurozone data + reduced ECB dovishness
Fed pause expectations + soft US CPI drive USD weakness
Retail sentiment shows most traders are short EUR/USD — contrarian bullish
⏳ Patience:
Let price stabilize in the 1.1575–1.1600 zone with a bullish engulfing or H4 reversal signal before execution. Structure invalidation below 1.1530.
