DeGRAM | EURUSD rebound from the trend line📊 Technical Analysis
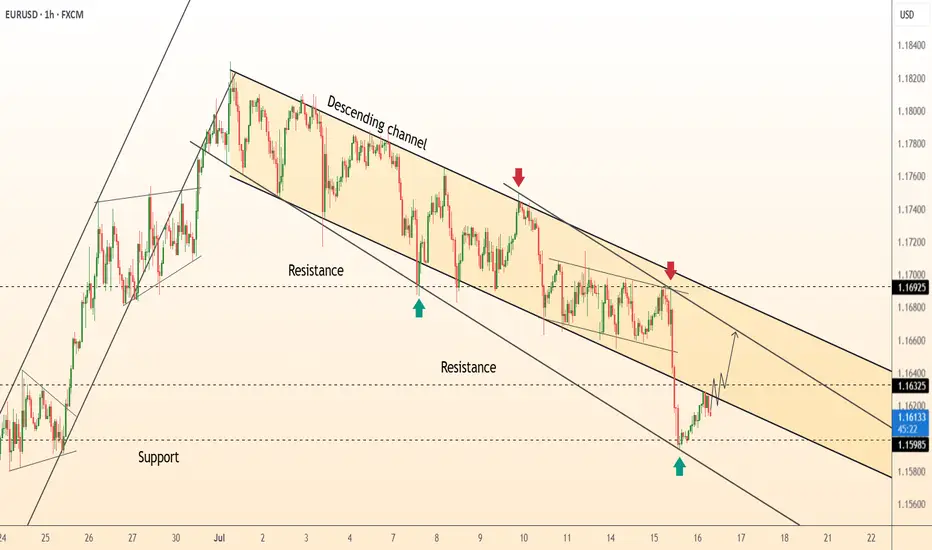
● Price printed a hammer and bullish RSI divergence on the lower rail of the 3-week descending channel (green arrow 1.1598), breaking the inner wedge that guided last leg down.
● First resistance is the channel mid-line / prior pivot 1.1632; a move through it exposes the upper band near 1.1692, where July supply and the larger bearish trend-line converge.
💡 Fundamental Analysis
● Softer US retail-sales control-group and Daly’s “more evidence needed” remarks cooled 2-yr yields, trimming dollar support, while ECB’s Knot said additional cuts “are not imminent,” limiting euro downside.
✨ Summary
Long 1.1600-1.1620; hold above 1.1632 targets 1.1690. Long view void on an H1 close below 1.1580.
-------------------
Share your opinion in the comments and support the idea with a like. Thanks for your support!
USDEUX trade ideas
EURUSD Will Go Down! Short!
Take a look at our analysis for EURUSD.
Time Frame: 15m
Current Trend: Bearish
Sentiment: Overbought (based on 7-period RSI)
Forecast: Bearish
The market is testing a major horizontal structure 1.161.
Taking into consideration the structure & trend analysis, I believe that the market will reach 1.159 level soon.
P.S
Please, note that an oversold/overbought condition can last for a long time, and therefore being oversold/overbought doesn't mean a price rally will come soon, or at all.
Disclosure: I am part of Trade Nation's Influencer program and receive a monthly fee for using their TradingView charts in my analysis.
Like and subscribe and comment my ideas if you enjoy them!

DeGRAM | EURUSD fixed under the resistance level📊 Technical Analysis
● Price is stalling against the upper band of a three-month rising channel (≈ 1.1790) after producing a false break and quick rejection—marking a potential bull-trap at trend resistance.
● Bearish divergence on the 4 h RSI and the first lower-high inside a micro rising wedge suggest momentum is fading; a slide through 1.1745 should trigger profit-taking toward the mid-channel support at 1.1595.
💡 Fundamental Analysis
● Solid US payrolls and a hawkish tone in FOMC minutes lift two-year yields, reviving the dollar bid, while post-election coalition wrangling in France keeps a risk premium on the euro.
✨ Summary
Sell 1.1785 ± 15 pips; break below 1.1745 targets 1.1595. Invalidate on a 4 h close above 1.1810.
-------------------
Share your opinion in the comments and support the idea with a like. Thanks for your support!

Market Analysis: EUR/USD Pares GainsMarket Analysis: EUR/USD Pares Gains
EUR/USD declined from the 1.1750 resistance and traded below 1.1650.
Important Takeaways for EUR/USD Analysis Today
- The Euro started a fresh decline after a strong surge above the 1.1720 zone.
- There is a connecting bearish trend line forming with resistance at 1.1660 on the hourly chart of EUR/USD at FXOpen.
EUR/USD Technical Analysis
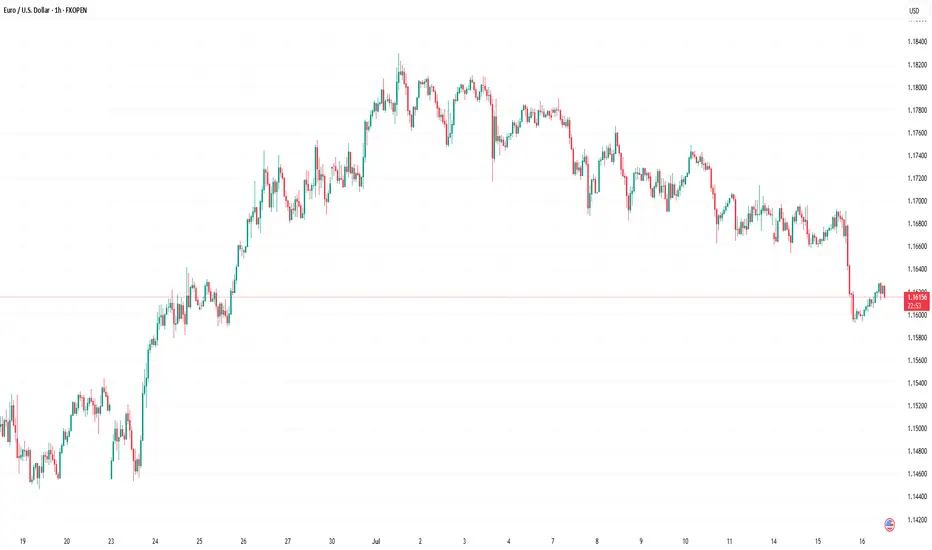
On the hourly chart of EUR/USD at FXOpen, the pair rallied above the 1.1720 resistance zone before the bears appeared, as discussed in the previous analysis. The Euro started a fresh decline and traded below the 1.1660 support zone against the US Dollar.
The pair declined below 1.1620 and tested 1.1590. A low was formed near 1.1592 and the pair started a consolidation phase. There was a minor recovery wave above the 1.1610 level.
EUR/USD is now trading below the 50-hour simple moving average. On the upside, it is now facing resistance near the 1.1630 level. It is close to the 23.6% Fib retracement level of the downward move from the 1.1749 swing high to the 1.1592 low.
The next key resistance is at 1.1660 and the 50% Fib retracement level. There is also a connecting bearish trend line forming with resistance at 1.1660.
The main resistance is near the 1.1690 level. A clear move above it could send the pair toward the 1.1720 resistance. An upside break above 1.1720 could set the pace for another increase. In the stated case, the pair might rise toward 1.1750.
If not, the pair might resume its decline. The first major support on the EUR/USD chart is near 1.1590. The next key support is at 1.1550. If there is a downside break below 1.1550, the pair could drop toward 1.1520. The next support is near 1.1485, below which the pair could start a major decline.
This article represents the opinion of the Companies operating under the FXOpen brand only. It is not to be construed as an offer, solicitation, or recommendation with respect to products and services provided by the Companies operating under the FXOpen brand, nor is it to be considered financial advice.
Strong sell eurusdWeekly and monthly overbought pair
Daily buy trend almost break
Straight selling expected till our weekly sell target , now no chances for buyers

EUR/USD : US Dollar Strengthens Following Inflation ReportEUR/USD Analysis: US Dollar Strengthens Following Inflation Report
Yesterday, the US Consumer Price Index (CPI) report was released, showing an increase in consumer prices. According to Forex Factory, annual CPI rose from 2.4% to 2.7%, exceeding analysts' expectations of a 2.6% rise.
As reported by Reuters, the data supports the stance of Federal Reserve Chair Jerome Powell, who has repeatedly stated that the anticipated inflationary pressure—driven in part by tariffs—is a reason to refrain from further interest rate cuts.
However, President Donald Trump interpreted the data differently. On his Truth Social platform, he posted that consumer prices remain low and called for an immediate rate cut.
The market responded with a stronger US dollar—indicating that participants believe interest rates are likely to remain at current levels in the near term. Notably, the EUR/USD exchange rate fell to the 1.1600 level for the first time since late June (as indicated by the arrow).
Technical Analysis of the EUR/USD Chart
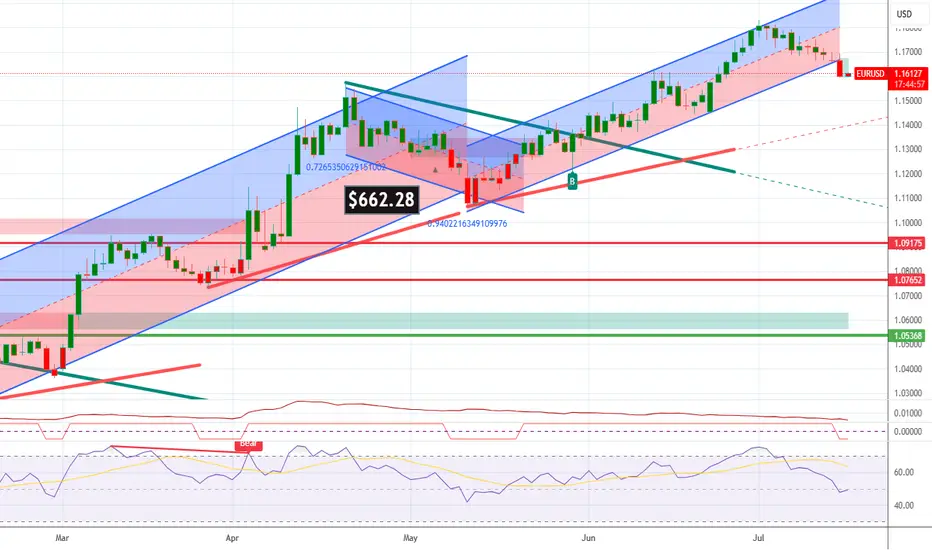
Analysing the EUR/USD chart as of 7 July, we identified:
→ A long-term ascending channel
→ A potential downward trajectory (marked by red lines)
Since then, the pair has followed the outlined path and declined by more than 1%.
It is worth noting that today, the EUR/USD price is near the lower boundary of a key trend channel, which may offer significant support — traders may look for a technical rebound from this level.
Additionally, attention should be paid to the upcoming release of the US Producer Price Index (PPI) at 15:30 GMT+3. These figures carry particular weight in light of potential renewed inflationary pressures. This and other upcoming data may prove decisive for the near-term direction of EUR/USD.
This article represents the opinion of the Companies operating under the FXOpen brand only. It is not to be construed as an offer, solicitation, or recommendation with respect to products and services provided by the Companies operating under the FXOpen brand, nor is it to be considered financial advice.

EURUSD: Deeper Pullback Before Bullish MoveHello Traders,
On EURUSD, we opened the new week with a significant downside gap, which has already been filled during the Asian session. Price has reacted from that gap area, and heading into the London session, I’m expecting a deeper pullback into the daily demand zone before the bullish continuation.

check the trendConsidering the price behavior in the current support area, possible scenarios have been identified. It is expected that a trend change will form in the current support area and we will see the start of an upward trend.
If the price passes the support area, the continuation of the downward trend will be likely.

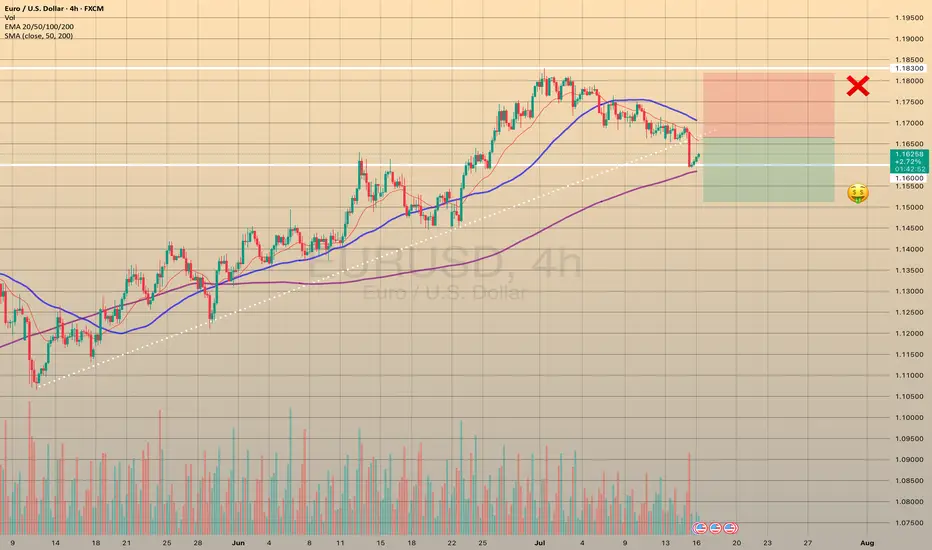
EURUSD TRIGGERED STOP LOSSTRADING IDEA UPDATE - EURUSD TRIGGERED STOP LOSS
The U.S. CPI report data came out right what the market expected (2.7% vs. 2.7% annually). After this report the pair went downwards on increased volume, triggering my stop loss and found the support only on 4-h sma200 and 1.16000 level.
What will be the possible scenario next?
I assume that the asset will go testing the trendline at 1.16650. If the test is successful, I will consider opening a
🔽 a pending sell stop order at 1.16651 with
❌a stop loss at 1.18180 and
🤑a take profit at 1.15122
Only if the retest is successful, not earlier! Let's observe first. Additionally, today is the U.S. PPI report coming out at 12:30 p.m. UTC, so got to be careful around this time
July 15 2025 -Sell Limit ActivatedGood day, folks!
Just sharing another learning from my ideas here:
EURUSD has been in a bearish structure since July 14, 2025 (1H Intraday). As you know, I always look for clear supply or demand validation before placing a sell or buy limit order. On the chart, you can see a valid supply zone that was generated on Monday. After that, I waited for a clear move during the Tuesday London and New York sessions, with the CPI news release acting as a catalyst for more volatility. The trade came to fruition during the New York session on Tuesday. (See chart for the complete breakdown of the movement and entry.)
RR: 1:3
Another Wyckoff schematics and structure analysis.

Expecting an upward move for EURUSD After the EURUSD decline, we expect EURUSD to move higher from this range and see an upward leg. Now there are two scenarios! The first scenario is that the price goes up without a direct correction, and the second scenario is that the price first makes a small correction and gives us more confirmation to enter BUY.

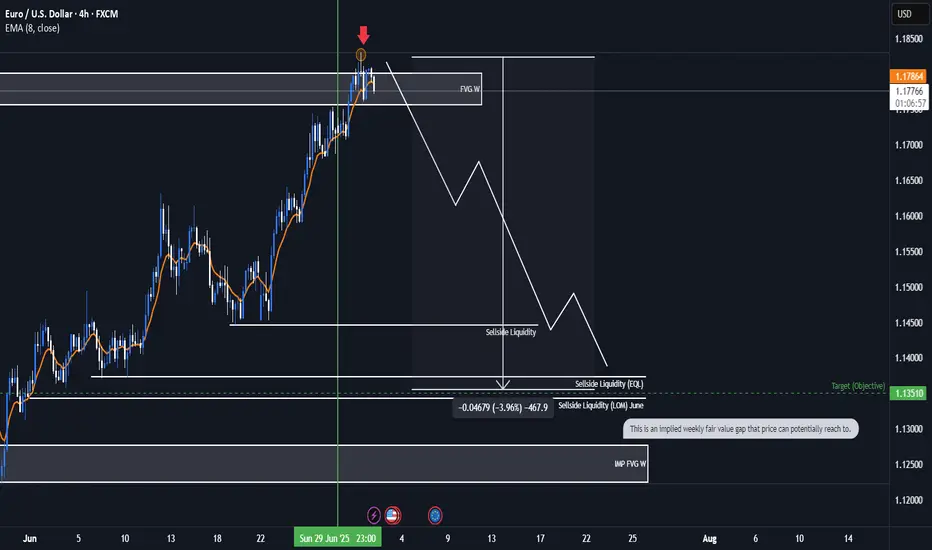
EURUSD Bearish ideaWe are in a weekly fair value gap that we have balance and potentially collected orders to prepare for a potential drop in price. We are anticipating a quarterly shift for the month of July were we could be targeting downside liquidity that is in open float.
* Fundamentals:
-Interest rate differentials shows us that USD interest rate of 4.5 is higher than the interest rate EUR 2.15 which lead to the longer fundamental frame work of price correcting to the higher dollar rate to the euro.
-The COT report also indicates to us that there is huge buying of Dollar by the commercials and a huge amount of selling of the EUR by commercials which can lead us to assume potential weaker dollar.
*Targeting:
-We are looking for the low of last month (June) to be taken out as well as even potentially reaching to the implied weekly fair value gap.
EURUSDU - market structure EURUSDU - market structure , use your own risk and trade managmnet and your own decision
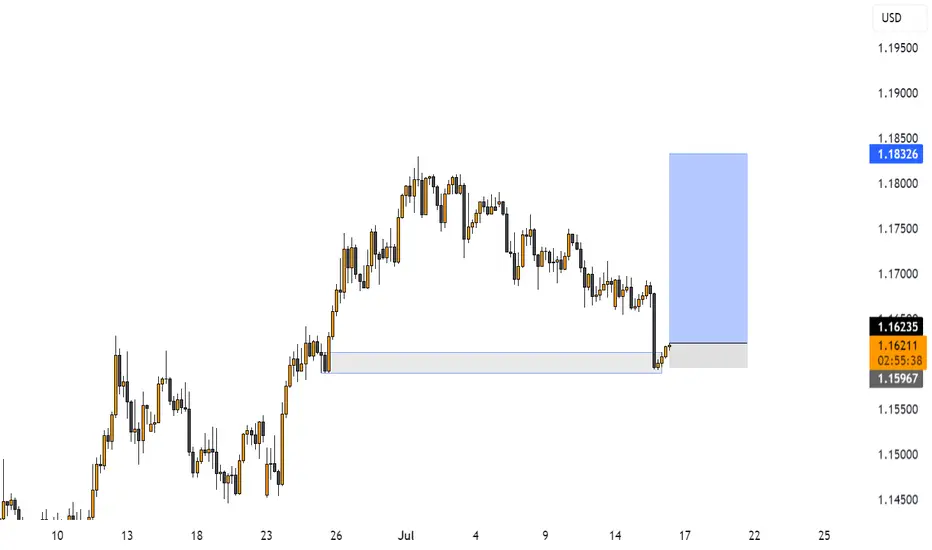
Eyes on 1.16300: EUR/USD Prepares for the Next Move.📉 EUR/USD Technical 📈
The pair has broken a strong support level and is now finding footing around 1.15970, forming a fresh bullish Fair Value Gap (FVG) at this zone.
At the moment, EUR/USD is moving within a bearish FVG. Here's what to watch next:
🔻 If the market dips from here, we could see a reversal from the lower edge of this FVG.
🔼 But if it holds and pushes higher, breaking above 1.16300 — the CE (Continuity Equation) level of the bearish FVG — that could unlock further bullish momentum.
🚨 Key Levels to Watch:
Support: 1.15970
Resistance/Breakout Zone: 1.16300
📊 Stay alert — price action at these levels could define the next move.
👉 DYOR – Do Your Own Research
📌 Not financial advice.

EURUSD at Daily Demand After CPI – Bullish Setup in PlayHello Traders,
I hope everyone is having a fantastic week!
Today on EURUSD, price is trading within the daily flip demand zone following yesterday’s USD CPI news release. While I usually avoid trading during CPI events due to the high volatility and unpredictable price spikes—often driven by algorithms and emotional retail reactions—yesterday did present a valid short opportunity.
Now that price is back in the daily demand zone, a bullish setup using lower time frame (LTF) confirmation offers a high-probability trade. We could see a decent push up toward the nearby daily supply zone.

CONTINUATION OF BEARISH TREND EUR/USD continuaring bearish, just going up to the the imbalance created yesterday during CPI, we expect it to hit the horizontal line as shown in the image, we expect a redistribution then another short entry, a the US dollar index gains strength

Eurousd techinical analysis.This chart of EUR/USD (Euro / U.S. Dollar) on the 3-hour timeframe includes several technical elements:
Key Elements Identified:
1. Descending Channel (Blue & Red Area):
Price was moving within a descending trend channel, indicating a bearish trend.
2. Breakout Above Trend Line:
The price has broken out of the descending trend line ("Trande line" — which is likely a typo for "Trend line"), suggesting potential bullish reversal.
3. FVG (Fair Value Gap):
This marks an imbalance in price action where the price moved too rapidly, often leading to a retracement or revisit. It could be used as a liquidity target for price to fill.
4. O.B (Order Block):
An order block represents a strong area of institutional buying/selling. Price appears to have reacted from this bullish order block, initiating the recent upward move.
5. Measurement Box (0.55% / 63.3 pips):
Indicates the expected or measured move from the O.B. to the FVG level.
6. Horizontal Support and Resistance Levels:
Marked in purple, showing recent consolidation or price reaction

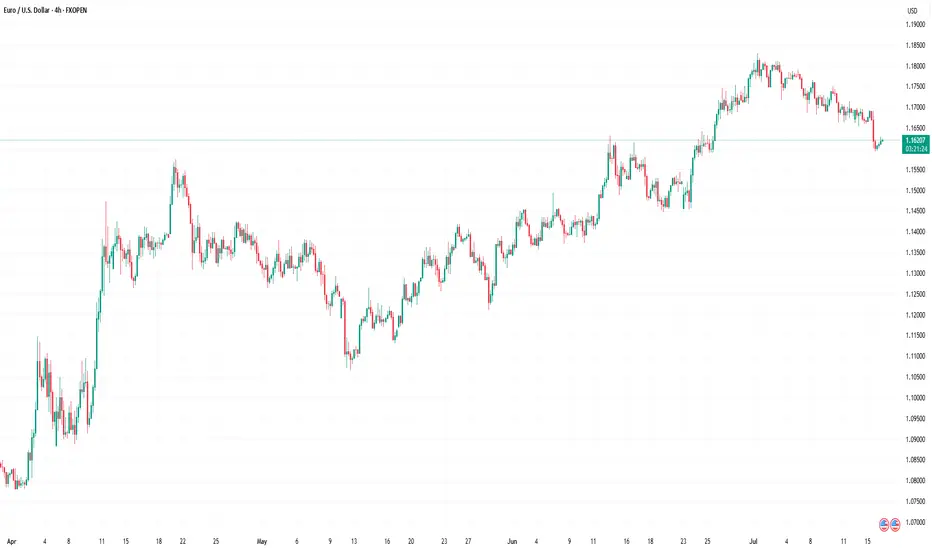
EUR/USD 4-Hour Chart (OANDA)4-hour performance of the Euro/US Dollar (EUR/USD) currency pair on the OANDA platform as of July 10, 2025. The current exchange rate is 1.16920, reflecting a 0.25% decrease (-0.00298). The chart includes a candlestick representation with a highlighted resistance zone between 1.1692 and 1.17477, and a support zone around 1.16523. Buy and sell signals are marked at 1.16927 and 1.16912, respectively, with a spread of 1.5 pips.


EURUSD correction continuesYesterday, EURUSD reached 1,1590 following key news releases.
This doesn’t change the overall market direction or the type of setups we’re looking for.
The next key support level is at 1,1536.
Keep an eye out for a bounce and potential entry signals around that area.

Potential Bearish Setup on EURUSDBearish Breakdown Setup
Summary
Analysing Price action from yesterday we have got a very nice distribution leg push that broke down below our accumulation zone a good indication of downside momentum, therefore the anticipation is that price will retest our BOS an ideal zone to look for bearish setups.
📉 EURUSD Daily Breakdown Potential setup
🔴 Distribution leg: 1.16921 - 1.15924
📉 Sell Below: 1.16540 (Confirmed Break)
🎯 Target 1: R:R 1:2
🎯 Target 2: R:R 1:3
🎯 Target 3: R:R 1:4
🛑 Stop Loss: Above Resistance Zone
🔍 Watch: Failure to break back in = Confirmation
LIKE or COMMENT if this idea sparks your interest, or share your thoughts below!
FOLLOW to keep up with fresh ideas.
Tidypips: "Keep It Clean, Trade Mean!"