A case for a EURUSD ShortPrice got rejected at the U-MLH.
DXY shows some strenght too:
A close below yesterdays low is a short for me.
USDEUX trade ideas

eur/usd 07.07The information and publications are not meant to be, and do not constitute, financial, investment, trading, or other types of advice or recommendations.
Have a nice evening ahead.

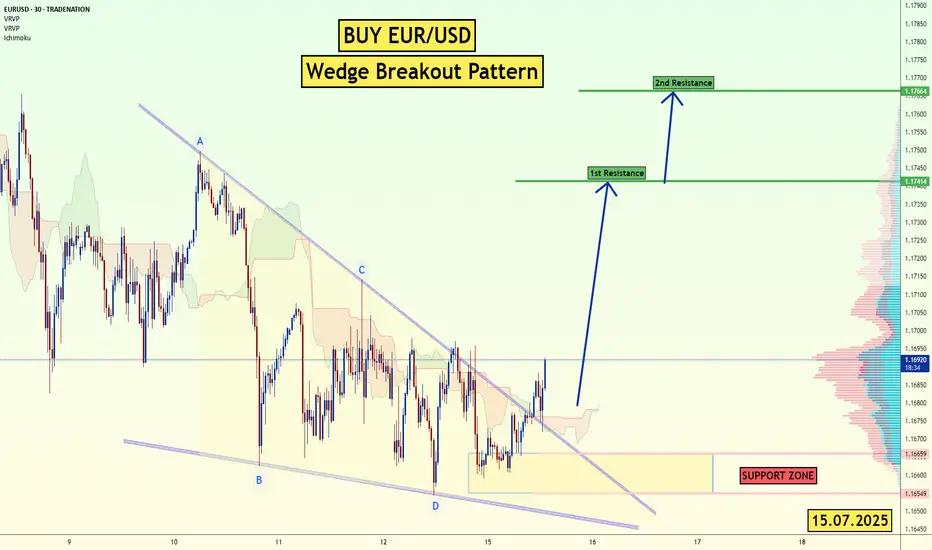
EUR/USD - Wedge Breakout (CPI- Today) 15.07.2025 The EUR/USD pair on the M30 timeframe presents a Potential Buying Opportunity due to a recent Formation of a Wedge Breakout Pattern. This suggests a shift in momentum towards the upside and a higher likelihood of further advances in the coming hours.
Possible Long Trade:
Entry: Consider Entering A Long Position around Trendline Of The Pattern.
Target Levels:
1st Resistance – 1.1741
2nd Resistance – 1.1766
🎁 Please hit the like button and
🎁 Leave a comment to support for My Post !
Your likes and comments are incredibly motivating and will encourage me to share more analysis with you.
Best Regards, KABHI_TA_TRADING
Thank you.
Disclosure: I am part of Trade Nation's Influencer program and receive a monthly fee for using their TradingView charts in my analysis.
EUR/USD Daily OB Analysis – ICT-Based SetupEUR/USD Daily OB Analysis – ICT-Based Setup
This is a clean ICT-style analysis of EUR/USD on the Daily timeframe.
A Daily Bullish Order Block (OB) has been identified in the Discount zone.
The OB ranges between two psychological levels:
1.15500 – Mid Figure
1.15000 – Big Figure (key liquidity level)
The market is currently approaching this OB, and the region is well aligned with the principles of PD Arrays (Premium/Discount Arrays) from ICT methodology.
The OB is considered valid as price action broke market structure (BOS) after the OB was formed, confirming institutional interest at that level.
We are now watching for potential bullish confirmation signals (MSS, SMT divergence, or bullish FVGs) on lower timeframes like H1 or M5 as price taps into the OB zone.
This setup offers a high-probability long opportunity, especially if price reacts from the 1.15000 big figure level with bullish price action.

EURUSD CONTINUATION UPSIDEI see 4H liquidity above, before it goes another high let the thing sweep first.
See entries below, always look for lower timeframe for entries at 15min-1min.
I only share more swing trades, so better capitalize it, I do swing too. GOODLUCK.
Don't be a 90% trader who gamble daily, try with swing. specially on my GOLD charts updates.
ciao.. keep winning fellas, you can also reach me on my X account. I do share too

EUR/USD drops post US CPI reportAfter gaining ground last week, the US dollar initially came under slight pressure earlier today. However, it regained momentum in the aftermath of a mixed US inflation report. Despite the nuanced inflation print, market expectations around interest rate policy remained largely unchanged. Investors continue to anticipate a slower pace of rate reductions, a sentiment that could further weigh on the EUR/USD pair—provided confidence in the Federal Reserve’s monetary approach remains intact.
Mixed Signals from US Inflation Data
The consumer price index for June presented a mixed picture. Headline CPI increased by 0.3% month-over-month and 2.7% year-over-year, surpassing both the previous 2.4% figure and the 2.6% forecast. However, core CPI (which excludes food and energy) showed a slightly softer reading, rising by only 0.2% month-on-month—below the expected 0.3%. The annual core rate stood at 2.9%, in line with expectations.
This mixed data has not allayed fears that inflation could remain sticky for longer. As a result, the Fed may hold off on aggressive rate cuts, although a possible move in September remains on the table.
Adding to the dollar’s bullish case, President Trump has proposed aggressive tariffs—35% on select Canadian goods and up to 30% on imports from Mexico and the EU—if no agreements are reached by August 1. These protectionist threats, combined with his expansive fiscal agenda, could drive inflation higher and bolster the dollar if market faith in US policy stays strong.
Euro Zone Data Shows Resilience, But the Euro Falters
Despite some encouraging macroeconomic indicators from the Eurozone, the euro slipped. Germany’s ZEW economic sentiment index rose to 52.7, outperforming both expectations (50.8) and the previous reading (47.5). Additionally, industrial production climbed 1.7% month-on-month, beating forecasts.
While these positive data points reflect a degree of resilience in the euro area, trade tensions are looming. The European Union has said it will retaliate on US products—ranging from aircraft to alcohol—should trade talks collapse or fail to yield agreements by the August 1 deadline.
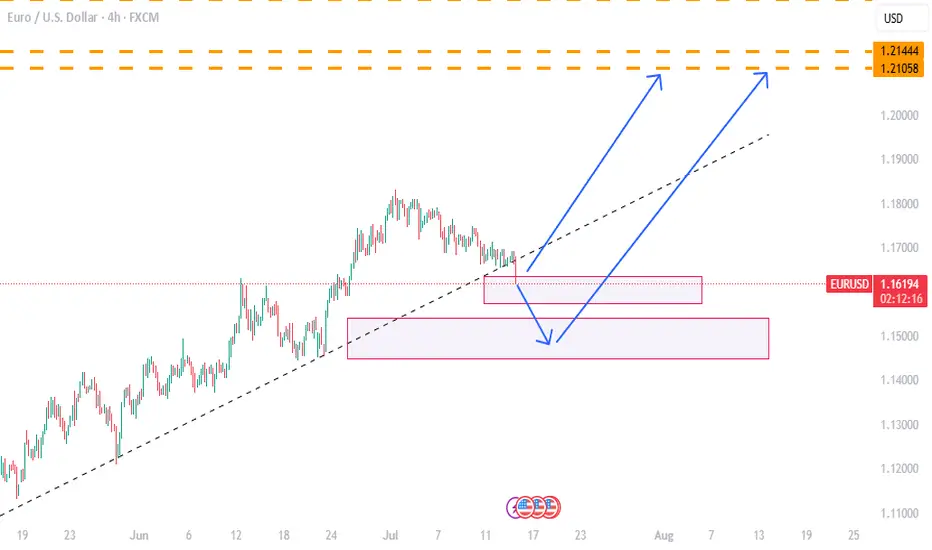
Technical Outlook
Technically, EUR/USD breached the bullish trendline established since Q1, a development that bears are watching as the session wears on. Currently, the pair is testing a key support zone between 1.1570 and 1.1630—an area that served as resistance in both April and mid-June before the rally that followed.
Should prices fall decisively below this support today or in the coming days, the technical bias could shift bearish. On the upside, resistance lies at 1.1700 and 1.1750. A break above these levels would clear the way for bulls to target a fresh 2025 high above 1.1830.
By Fawad Razaqzada, market analyst with FOREX.com

analyse eurusd *The content on this analysis is subject to change at any time without notice, and is provided for the sole purpose of assisting traders to make independent investment decisions.
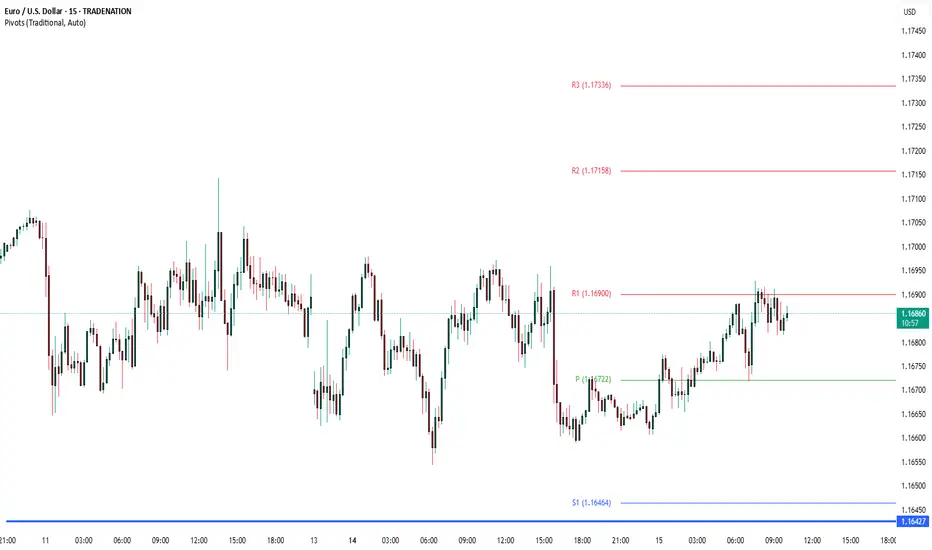
EURUSD Will Explode! BUY!
My dear followers,
I analysed this chart on EURUSD and concluded the following:
The market is trading on 1.1686 pivot level.
Bias - Bullish
Technical Indicators: Both Super Trend & Pivot HL indicate a highly probable Bullish continuation.
Target - 1.1706
About Used Indicators:
A super-trend indicator is plotted on either above or below the closing price to signal a buy or sell. The indicator changes color, based on whether or not you should be buying. If the super-trend indicator moves below the closing price, the indicator turns green, and it signals an entry point or points to buy.
Disclosure: I am part of Trade Nation's Influencer program and receive a monthly fee for using their TradingView charts in my analysis.
———————————
WISH YOU ALL LUCK
EURUSD - sell market after consolidation phase has taken control by the bears with strong support level being broken with engulfing candle (momentum candle)
we have two buy setup: wait for the market to retrace to the level of 0.382 of fib or enter instant in to the market.
TP1 and TP2 with R:R of 1:1 and 1:2

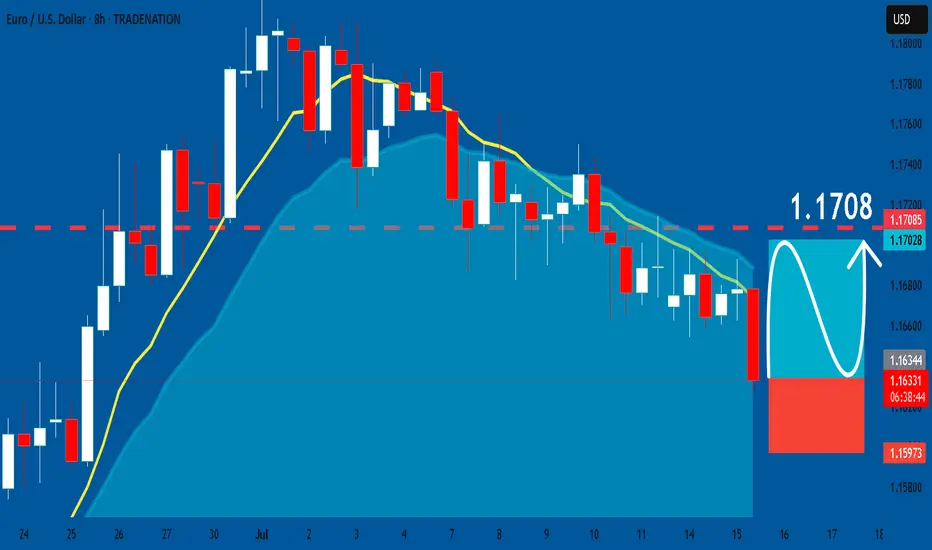
EURUSD: Long Trade with Entry/SL/TP
EURUSD
- Classic bullish pattern
- Our team expects retracement
SUGGESTED TRADE:
Swing Trade
Buy EURUSD
Entry - 1.1635
Stop - 1.1597
Take - 1.1708
Our Risk - 1%
Start protection of your profits from lower levels
Disclosure: I am part of Trade Nation's Influencer program and receive a monthly fee for using their TradingView charts in my analysis.
❤️ Please, support our work with like & comment! ❤️
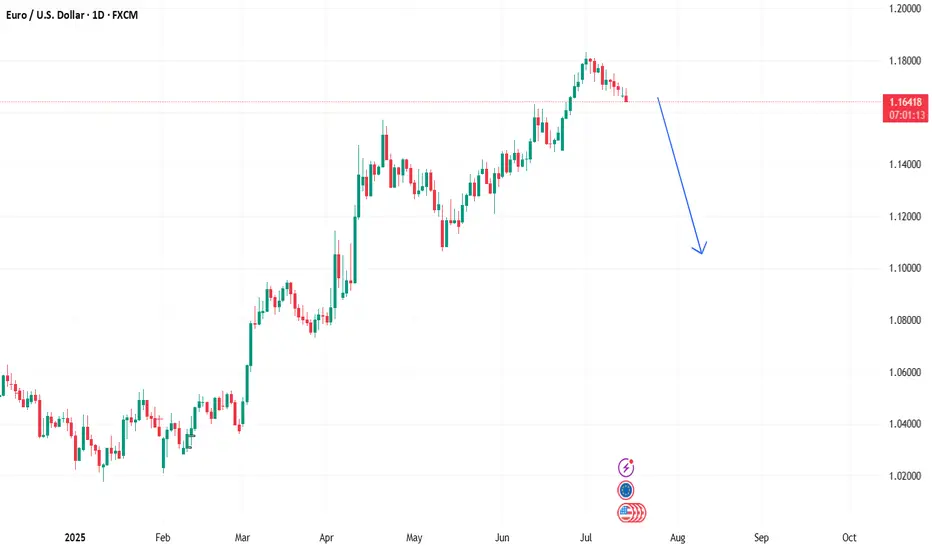
Bearsih EurUsd!The fibre has begun its downward spiral. You can look for sell set-ups from now on; every time it buys, wait and look for sells. Unless of course you can trade both sides of the market. Price is aiming for 1.1060 level.

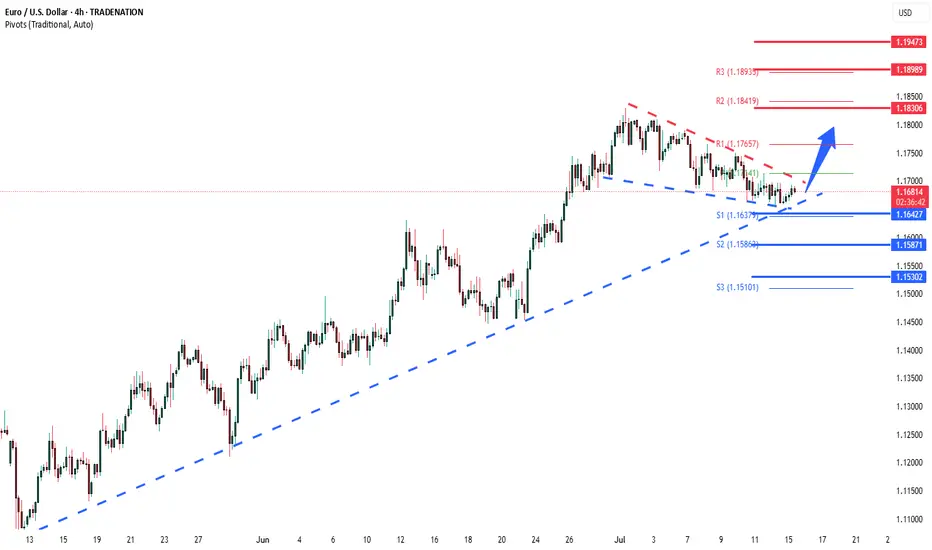
Lingrid | EURUSD Pulled Back to Key Support levelFX:EURUSD is approaching a major confluence zone at 1.16422 where the downward channel meets the upward trendline and horizontal support. The structure remains bullish with a sequence of higher highs and higher lows, and the current pullback fits within a healthy correction phase. A strong bounce from this triple-support region could trigger a reversal toward 1.18320, validating the continuation of the broader uptrend. All eyes are now on the 1.16450 reaction point for early momentum signs.
📉 Key Levels
Buy trigger: bullish reaction from 1.16422 support zone
Buy zone: 1.16200–1.16500 (channel base + trendline + demand)
Target: 1.18320
Invalidation: confirmed 4H close below 1.1600 breaks upward structure
💡 Risks
Deeper push below the trendline may trap early buyers
Low liquidity during the bounce can cause fakeouts
Unexpected USD strength could stall recovery momentum
If this idea resonates with you or you have your own opinion, traders, hit the comments. I’m excited to read your thoughts!

#EURUSDStill playing so hard!!!! Eur/usd is really waitng for aa breakout, since following the Resistance and pattern .
looking for a bullish side for now.....but its bearish this week.
whats your analysis....traders!!

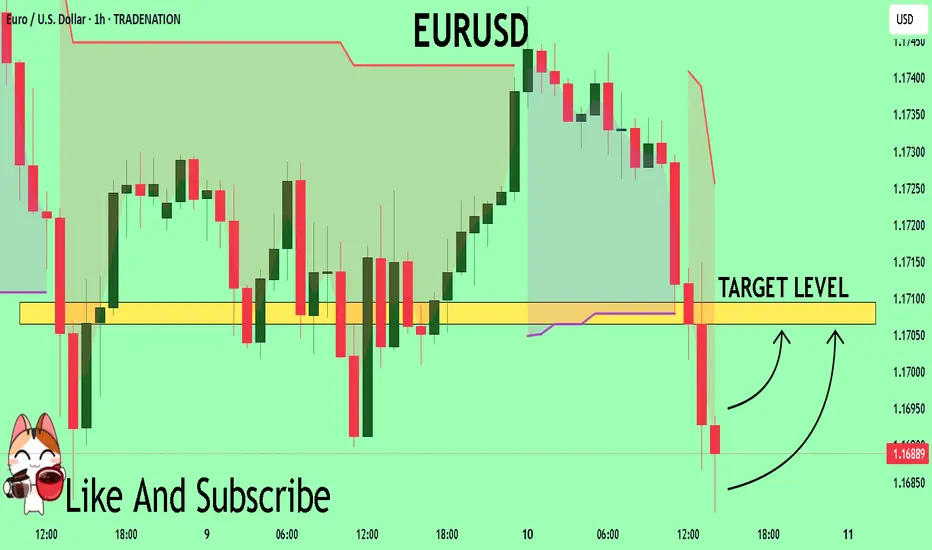
7.15 EUR/USD LIVE TRADE UPDATEWe took this trade yesterday based on the pullback followed by a strong engulfing candle. volume and momentum are strong. Currently looks like it is having a hard time getting out of the S/R zone which to me seems pretty strong. I still think this market is heading down. We will wait and let the market do it's thing.

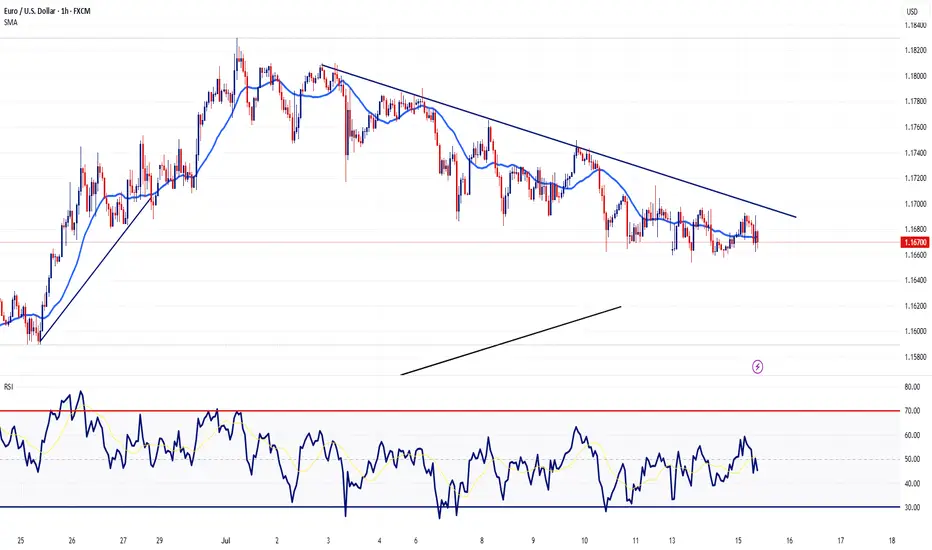
EURUSD Remains Under Pressure Following CPIThis morning, after the US CPI report was released at 8:30 AM EDT, EUR/USD surged briefly due to a slightly weaker-than-expected inflation reading. Despite this, signs of rising inflation persisted, leading EUR/USD to rise sharply before quickly retreating.
EUR/USD has seen an intermediate top at 1.1830 since early July. The euro is under pressure due to looming US tariffs (30% on EU imports, effective August 1) and mixed economic signals, like Eurozone industrial production rising 1.7% in May (vs. 0.9% expected). The pound (GBP) and other currencies are also reacting to tariff concerns.
Taking a look at the 1hour chart, you can see we are still trading below a descending trendline. Taking everything into consideration, I'm positioning short sells whenever we get bounce higher.
That's it - That's all - Trade Safe
#AN021: TRUMP Threats on Tariffs and FOREX Tensions
Global markets are waking up to a currency cold war. Hi, I'm Trader Andrea Russo, and today I want to share the latest news with you.
Donald Trump set the day alight, launching a barrage of threats from a rally in Ohio:
"If re-elected, I will impose 60% tariffs on all of China, 20% on Mexico, and 10% on the European Union. And I'm telling Putin clearly: if you continue to help China evade our embargoes, we will hit Russia too."
The words reverberated across global investment banks, triggering an immediate reaction in the dollar and emerging market currencies.
Markets React: USD Soars, GBP and NOK on Alert
The US dollar gained ground against nearly all major currencies, while the GBP collapsed under pressure from fears of a BoE rate cut and a slowing labor market.
The GBP/NOK pair, in particular, is showing signs of a structured bearish breakout: the pound is under dual pressure (domestic politics + trade war), while the Norwegian krone is indirectly benefiting from rising energy prices and pro-commodity sentiment.
US CPI at 2:30 PM: The Real Detonator
The US core inflation figure will be released at 2:30 PM Italian time. The consensus is for +3.4%, but a higher reading could push the Fed to remain more hawkish for longer. This would strengthen the dollar and create new shock waves in weak and emerging market currencies.
Specifically:
USD/JPY could break above 162.00 with strength.
GBP/USD risks a break below 1.29.
USD/SEK and USD/MXN are the key pairs to watch for explosive movements.
Trump vs. Powell: A Showdown
Meanwhile, fears are growing of a direct attack by Trump on the Fed. According to Deutsche Bank, markets are underestimating the possibility that Trump will attempt to remove Jerome Powell if he returns to the White House.
"The market is ignoring the Trump-Powell variance. If he really tries, the dollar could fall 4% in a week," – Deutsche Bank
We are about to enter the best time of the month for Forex. Those who get their timing wrong today will burn capital. Those who wait for the right signal can ride the trend arising from a predicted global crisis.

LONG EURUSD I am LONG on this pair at time of writing.
IT is important to adjust your paper profits NOT SO high that it will wipe you out and you need to restart at a higher buying price. Say you have 2 contracts and is in profits position, you can take 1 contract or 0.5 or 1.5 size and leave the remaining to run at breakeven SL position. That way, if you are riding on the market trend, then your remaining position be it 0.5 or 1.5 will still benefit and you can just accumulate as it trends up.
This works for me but may not be for everyone. Choose a strategy that fits you. Different folks, different strokes.


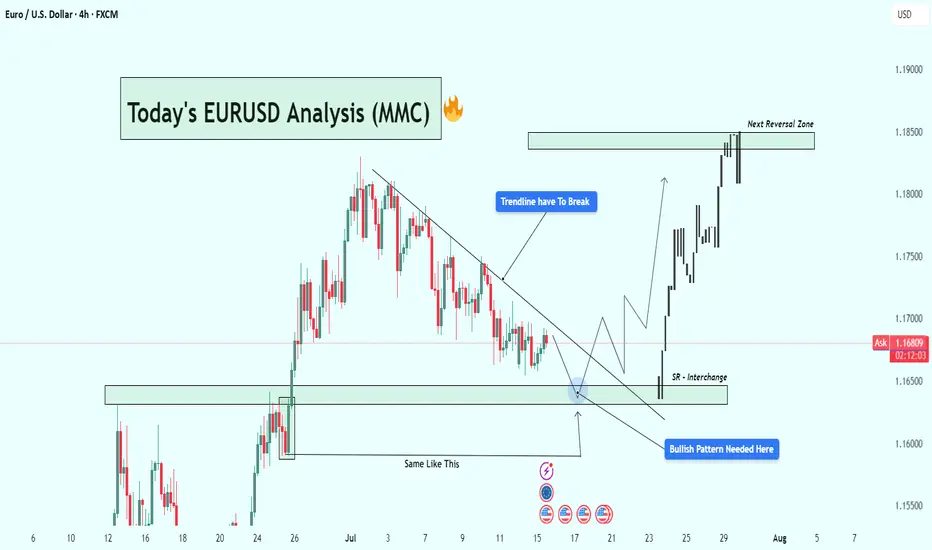
EURUSD Analysis : Eyes on Bullish Breakout Setup + Target🧭 Current Market Context:
The EURUSD pair is currently trading near 1.16765 on the 4H timeframe, displaying classic accumulation behavior at a key Support-Resistance Interchange Zone (SR Flip). After an extended bearish correction from the previous swing high, price has started compressing in a descending structure underneath a well-respected trendline. This tightening range near a historic support zone suggests that a major breakout could be on the horizon.
🧠 Technical Confluences:
🔹 1. Descending Trendline - Bearish Control Line:
The trendline drawn from the July highs has acted as a clear resistance line, rejecting multiple bullish attempts to break higher.
Price has failed to close above it on the 4H chart, showing sellers are still in control—but momentum is fading.
A breakout of this line is a crucial confirmation of buyer strength returning.
🔹 2. SR Flip Zone - Interchange Area:
This zone previously acted as resistance, capping the rally in June.
After price broke above it, the same area now acts as support, confirming its role as an SR flip zone—a textbook demand level.
Smart money often steps in at these interchange areas to accumulate long positions.
🔹 3. Re-accumulation Phase (Smart Money Behavior):
Market structure is showing a rounded bottom formation, hinting at possible absorption of sell-side liquidity.
Price action is compressing into the support zone, reducing volatility—a signal that a reversal or breakout is near.
The previous similar move ("Same Like This") from late June led to a strong bullish impulsive wave—this historical behavior adds confidence in the current bullish outlook.
🔹 4. Potential Bullish Pattern:
Price needs to develop a bullish reversal pattern (e.g., inverse head & shoulders, bullish engulfing, or a sweep of the low with rejection).
Only then will the setup be validated. This is not a blind buy zone, but a zone of interest for high-probability longs if price confirms.
🧨 Trade Plan Scenarios:
✅ Scenario 1 - Confirmation Breakout:
Wait for a clean breakout above the descending trendline.
Enter on breakout + retest structure.
Target the next major reversal zone at 1.18500.
🐢 Scenario 2 - Early Long Entry:
Enter on bullish confirmation (engulfing, pin bar, etc.) at the SR Interchange zone.
Stop loss below the support box.
Ride early for better R:R if the breakout confirms.
❌ Invalidation:
A clean breakdown below 1.1600 with momentum will invalidate the bullish bias.
In that case, reevaluate based on new structure.
📊 Projected Path:
If the trendline breaks, expect a bullish rally toward the next major resistance zone (1.18500).
That zone has historically acted as a major reversal and profit-taking level for bulls, and we expect price to react again if tested.
🔍 Macro View (Optional Insight):
USD may show weakness due to macro data (CPI/FED talks), helping EURUSD lift.
Eurozone data stability could further fuel demand for EUR.
📌 Final Thoughts:
This EURUSD setup is forming at a high-value area, backed by technical structure, historical behavior, and smart money positioning. If the price reacts positively from this zone and breaks the descending trendline, it could trigger a bullish leg toward 1.18500, offering a rewarding risk-to-reward opportunity for both swing and short-term traders.
Stay patient. Let the market confirm the direction before execution. 📈
EURUSD Good buy opportunityTime to buy EURUSD with CPI
EURUSD has broken the Trend Line liquidity and is ready to continue the upward trend.

EURUSD Bullish continuation supported 1.1640The EURUSD currency pair continues to exhibit a bullish price action bias, supported by a sustained rising trend. Recent intraday movement reflects a sideways consolidation breakout, suggesting potential continuation of the broader uptrend.
Key Technical Level: 1.1640
This level marks the prior consolidation range and now acts as pivotal support. A corrective pullback toward 1.1640 followed by a bullish rejection would reinforce the bullish trend, targeting the next resistance levels at:
1.1830 – Near-term resistance
1.1900 – Minor swing high
1.1940 – Longer-term bullish objective
On the other hand, a decisive daily close below 1.1640 would invalidate the bullish setup, shifting the outlook to bearish in the short term. This could trigger a deeper retracement toward:
1.1590 – Initial support
1.1530 – Key downside target
Conclusion:
As long as 1.1640 holds as support, the technical outlook remains bullish, favoring long positions on dips. A confirmed break below this level would signal a shift in sentiment and open the door to a corrective pullback phase.
This communication is for informational purposes only and should not be viewed as any form of recommendation as to a particular course of action or as investment advice. It is not intended as an offer or solicitation for the purchase or sale of any financial instrument or as an official confirmation of any transaction. Opinions, estimates and assumptions expressed herein are made as of the date of this communication and are subject to change without notice. This communication has been prepared based upon information, including market prices, data and other information, believed to be reliable; however, Trade Nation does not warrant its completeness or accuracy. All market prices and market data contained in or attached to this communication are indicative and subject to change without notice.
The Day AheadMacro Data Highlights
United States
June CPI – Crucial inflation gauge; likely to shape Fed rate expectations.
Empire Manufacturing Index (July) – Regional economic activity snapshot.
China
Q2 GDP – Key read on the health of the world’s second-largest economy.
June Retail Sales / Industrial Production / Home Prices – Important for tracking domestic demand and real estate trends.
Europe
Germany & Eurozone ZEW Surveys (July) – Investor sentiment indicators, especially relevant amid sluggish European growth.
Eurozone May Industrial Production – Tracks output momentum in manufacturing-heavy economies.
Italy May Government Debt – Sovereign debt level insights amid fiscal scrutiny.
Canada
June CPI – Important for BoC policy outlook.
Existing Home Sales / May Manufacturing Sales – Indicators of economic activity and housing market resilience.
Central Bank Speakers
Fed: Bowman, Barr, Collins, Barkin – Watch for comments on inflation and rate cut timing.
BoE: Governor Bailey – May impact GBP and UK rate expectations.
Earnings (Focus: Financials)
JPMorgan Chase, Wells Fargo, Citigroup, Bank of New York Mellon, BlackRock
Q2 results will offer insights into:
Net interest income trends
Credit quality & loan growth
Capital market activity (BlackRock focus on AUM and inflows)
Trading Takeaway
U.S. CPI and bank earnings are the top market movers – inflation print could shift rate cut expectations for September.
China data may influence commodity and EM sentiment.
Fed/BoE speakers may provide policy clarity amid disinflationary trends.
Financials earnings will be key to market tone, especially for value stocks and financial sector ETFs.
This communication is for informational purposes only and should not be viewed as any form of recommendation as to a particular course of action or as investment advice. It is not intended as an offer or solicitation for the purchase or sale of any financial instrument or as an official confirmation of any transaction. Opinions, estimates and assumptions expressed herein are made as of the date of this communication and are subject to change without notice. This communication has been prepared based upon information, including market prices, data and other information, believed to be reliable; however, Trade Nation does not warrant its completeness or accuracy. All market prices and market data contained in or attached to this communication are indicative and subject to change without notice.