USDEUX trade ideas

EURUSD Testing Patience – Bearish Trend Not Over YetEURUSD – Overview
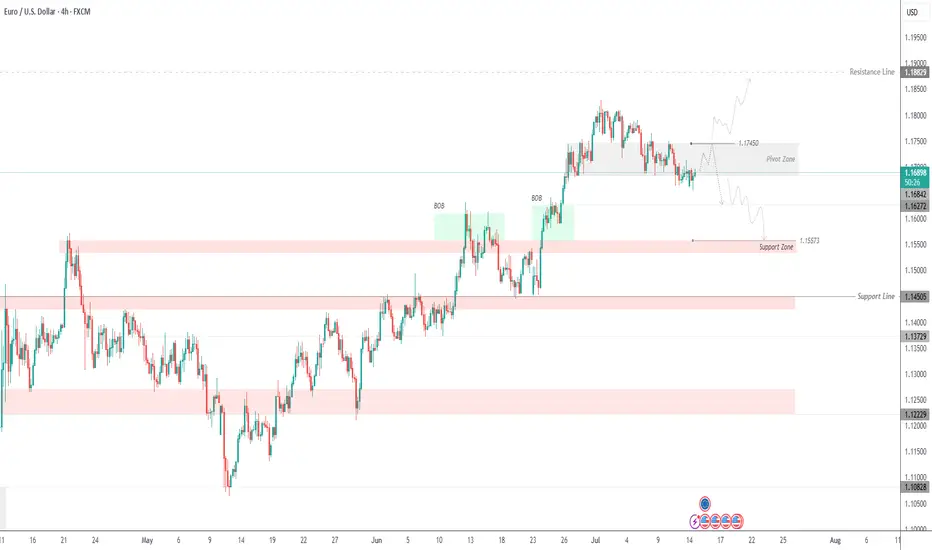
EURUSD continues to trade under pressure amid bearish momentum, respecting key technical levels.
The price maintains bearish momentum as long as it trades below 1.1745, with downside targets at 1.1627 and 1.1557.
A retest of 1.1745 is possible and considered normal in this structure. However, if the price stabilizes below 1.1684, it will likely continue dropping toward the support targets.
To shift back to a bullish bias, the pair must break and hold above 1.1745.
Pivot Line: 1.1695
Support Levels: 1.1627 – 1.1557
Resistance Levels: 1.1745 – 1.1810
previous idea:
EURUSD POTENTIAL BUY SETUP 4HLooking at EURUSD, Price is moving in a descending channel. EU on the high timeframe is bullish as Dollar is weak. I am expecting EU to fall into the marked FVG to clear the lows and take internal liquidity from the marked FVG before moving higher and take the Buyside Liquidity as marked.
Potential Entry= 1.6350
Stop loss= 1.15650
Take Profit = 1.18250
Please wait for price to come into the marked potential area to take this trade and manage your risk accordingly. Follow me for more updates and trades.


EUR/USD –Bullish Flag After Long Term Trend Shift: Is 1.20 Next?📌 In my previous EUR/USD analysis, I mentioned that the long-term trend likely reversed, and we could see a move toward the 1.23 zone in the medium to longer term.
That view is playing out.
Recently, the pair printed a new local high above 1.18, confirming the trend change.
📉 After this rise, EUR/USD pulled back –but the structure is clearly corrective: overlapping and a classic bullish flag formation.
What's next?
This correction looks close to completion, and bulls may soon return to push toward the key 1.20 level.
Trading Plan:
The 1.1620–1.1650 area stands out as a strong confluence zone – ideal for looking for buying opportunities.
The trend has changed. The setup is forming. Now it’s about timing.
Disclosure: I am part of TradeNation's Influencer program and receive a monthly fee for using their TradingView charts in my analyses and educational articles.

EURUSD is close to the end of its correctionEURUSD is consolidating in a wedge. The trend is bullish, with the correction reaching the 0.7 Fibonacci zone and making a false breakout, which generally changes the market imbalance.
All attention is on the wedge resistance (red line) and the 1.17000 level. A breakout of the resistance and consolidation of the price above this level will confirm the end of the correction and send the price higher.

EURUSD and GBPUSD Analysis todayHello traders, this is a complete multiple timeframe analysis of this pair. We see could find significant trading opportunities as per analysis upon price action confirmation we may take this trade. Smash the like button if you find value in this analysis and drop a comment if you have any questions or let me know which pair to cover in my next analysis.

EURUSD LONG TRADE PLANThe pair is trading in a global bullish trend supported by the rising trendline on D1. On the intraday view, the pair is currently trading on a minor bearish trend looking to test the trendline. In my view, the pair will eventually break above the falling channel which will indicate a bullish rally again.
Please do your own analysis before placing any trades.
Cheers and Happy Trading.

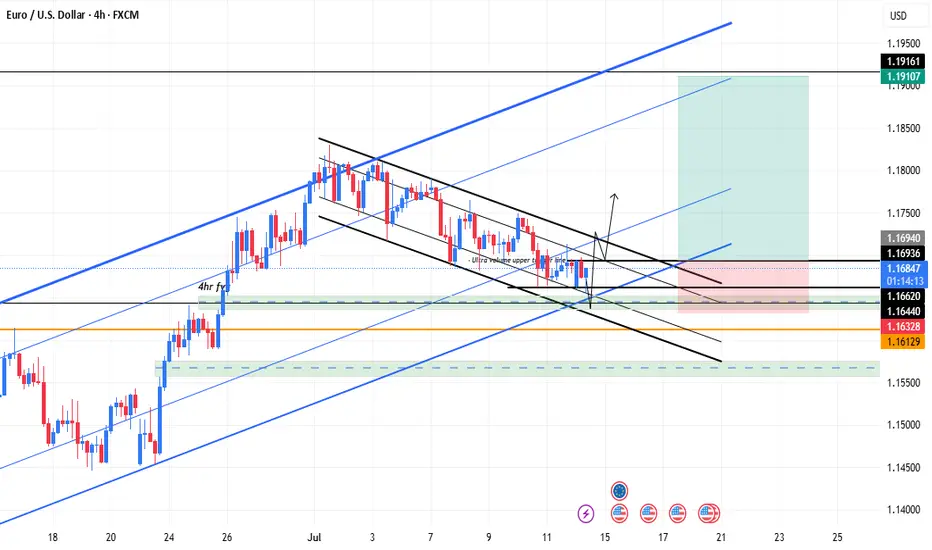
My Take on the EURUSD H1 Setup (July 14, 2025)
This is a classic textbook-quality TCB setup forming right at a critical confluence zone. Here's a full breakdown from a trader's lens:
🔵 1. Trend
Bias: Bullish
The macro structure from June shows a strong uptrend, and the most recent impulse was explosive — indicating active buyers.
H4 and D1 show no trend break yet.
🔵 2. Countertrend
The descending channel is neat and controlled — no erratic spikes or liquidity wicks that signal confusion.
Compression into the demand zone (gray box) around 1.1652–1.1710 shows sellers are weakening.
This is typical of pre-breakout structure when buyers are loading up under the radar.
🔵 3. Breakout
Price just broke cleanly above the channel and is sitting slightly above the horizontal resistance (1.1710).
A retest and bullish candle confirmation would be ideal — don't rush in yet, let the market prove its intent.
🧠 Strategic Entry Zone (My Plan)
EP: 1.1710–1.1720 (after bullish retest candle)
SL: 1.1650 (just below demand and structure low)
TP: 1.1840 zone (clean R:R ≈ 1:2)
⚠️ Risk Watch
DXY inverse correlation should support this (if DXY is breaking lower, that adds confidence).
Make sure there's no high-impact news within next 4–6 hours (like US CPI, FOMC).
Session timing is favorable — NY open approaching, which brings momentum.
✅ Verdict
High-probability long setup (TCB Score: 8/10).
Wait for a bullish retest candle on the 1H or even 15M before entry. If that happens, the probability of hitting 1.1840 is strong — particularly if volume confirms.

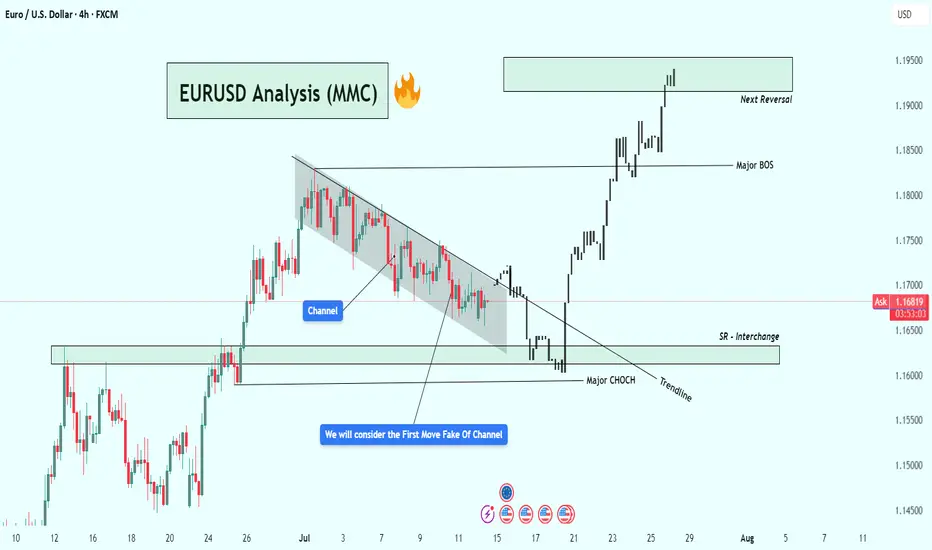
EURUSD Analysis – Smart Money Breakout + Reversal Zone in Play🔹 1. Bearish Channel & Liquidity Trap Setup
Price action from late June into mid-July formed a clearly defined descending channel, with consistent lower highs and lower lows. This structure likely attracted retail traders into short positions, expecting continued downside.
💡 Key Insight: The initial breakout of the channel was a fake move — often referred to as a liquidity grab or inducement. This is typical in smart money models where institutions trap early traders before the real move begins.
🔹 2. Major CHoCH (Change of Character)
Shortly after the fakeout, price sharply reversed and broke a major internal structure level, giving us our first CHoCH confirmation. This is a critical event in SMC, signaling a possible trend reversal from bearish to bullish.
Why it matters: A CHoCH after a channel + fakeout combo is a strong reversal signal, especially when supported by volume and aggression.
Visual cue: Look at the bullish engulfing momentum candle post-fakeout — this was the moment smart money entered.
🔹 3. Trendline Break + SR Interchange (Support/Resistance Flip)
Following the CHoCH, price broke the trendline and came back down to test a high-probability SR Interchange Zone — an area where previous resistance turned into fresh support.
This zone also aligns with the order block and inefficiency area, making it a premium entry for institutions.
Notice how price respected the zone before launching aggressively upward.
🧠 Note: This was the cleanest entry point in this setup — combining structure break, liquidity, and a demand zone.
🔹 4. Major BOS (Break of Structure)
After the retest, EURUSD broke the last major lower high, confirming a Bullish BOS (Break of Structure). This is where many traders realized the trend had shifted.
Market sentiment flipped from bearish to bullish.
Momentum increased, indicating institutional buying pressure.
🔹 5. Next Target: Reversal Zone (Supply Area)
Price has now reached a critical supply zone (1.1930 – 1.1970) where the next major reaction is likely to occur. This area was previously a strong rejection point, and it aligns with a potential higher timeframe supply zone.
⚠️ Watch for:
Bearish rejection wicks
Liquidity sweeps above highs
Bearish engulfing or mitigation patterns
CHoCH on lower timeframes (1H, 15m)
✅ Key Trading Takeaways:
Liquidity Trap: Retail was trapped inside a clean channel.
Fakeout Move: Induced shorts were wiped out.
CHoCH & BOS: Clear reversal pattern with momentum.
Perfect Retest Entry: Price retested demand and launched.
Current Area = Supply/Distribution: Great place to look for shorts or take profits.
📌 Possible Trading Plans:
🔸 Plan A: Reversal Short (Countertrend)
Entry: Inside 1.1930–1.1970 zone
Confirmation: Bearish PA + LTF CHoCH
TP1: Previous BOS (~1.1830)
TP2: Demand zone retest (~1.1650)
SL: Above 1.1980–1.2000
🔸 Plan B: Continuation Long (Breakout Bias)
Entry: Break + Retest above 1.2000 psychological level
SL: Below breakout wick
TP1: 1.2100
TP2: 1.2200+
🔖 Concepts Applied:
Smart Money Concepts (CHoCH, BOS, liquidity sweep)
Price Action Structure
Trendline break and retest
Supply & Demand Zones
Support/Resistance Flip (SR Interchange)
Volume + Momentum Confirmation
🔄 Conclusion:
This chart demonstrates a classic Smart Money narrative:
“Trap the retail, shift the structure, drive price into premium, then reverse.”
We're now at a make-or-break supply zone. Watch price behavior carefully — this is where smart traders either secure profits or prepare for the next leg.
EURUSD Will Go Down From Resistance! Short!
Here is our detailed technical review for EURUSD.
Time Frame: 2h
Current Trend: Bearish
Sentiment: Overbought (based on 7-period RSI)
Forecast: Bearish
The market is trading around a solid horizontal structure 1.177.
The above observations make me that the market will inevitably achieve 1.172 level.
P.S
We determine oversold/overbought condition with RSI indicator.
When it drops below 30 - the market is considered to be oversold.
When it bounces above 70 - the market is considered to be overbought.
Disclosure: I am part of Trade Nation's Influencer program and receive a monthly fee for using their TradingView charts in my analysis.
Like and subscribe and comment my ideas if you enjoy them!

EURUSD and GBPUSD are preparing to continue the upward trendAfter a significant rise in the EURUSD and GBPUSD, they have formed a descending price channel, and it is expected that this channel will be broken to complete the upward trend, because there is no sign of weakness yet, and the Main Lows have not yet been broken.

Eurusd Potential LongEurusd is pulling back slowly and nicely and we anticipate price to Pull to 1.16000 for a potential longs

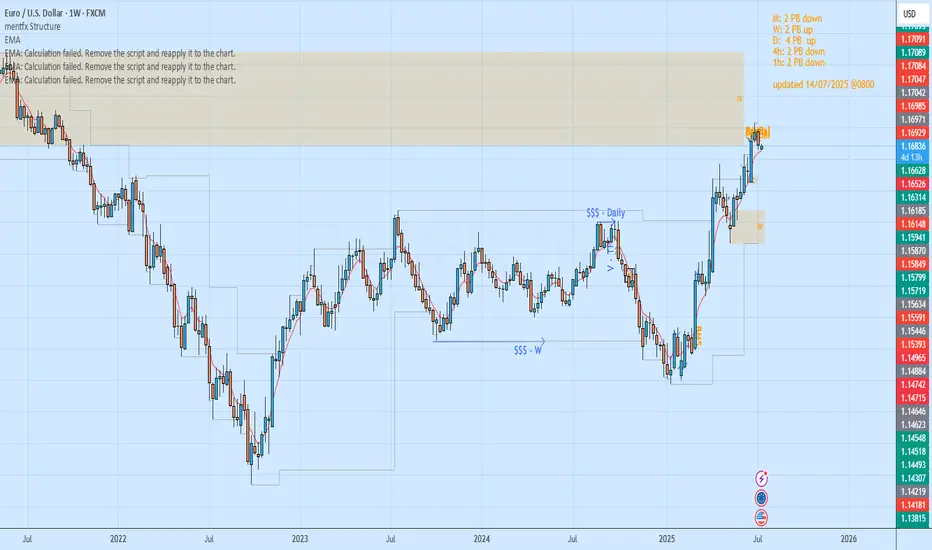
Which Way to GoHello students and traders, let us jump into a quick top down analysis of the EURUSD.
On the Monthly, we see that price is in a down swing. We have seen price recently go bullish, all the way into the Monthly zone, from where it has begun to reverse bearish. We expect price to hold bearish and continue to melt towards our Monthly liquidity target.
Weekly & Daily:
On the weekly and daily Time frames, we have a bullish setup. This bullish setup is what has helped in driving prices all the way up and into the Monthly refined reversal zone. The weekly timeframe is curently seeing a bearish reversal. With the price hitting the monthly zone, there is a low likelihood of price continuing bullish. The bearishness might just continue for a while.
4 hour and 1 Hour
On the smaler timeframes of the 1 and 4 hour timeframe, market is in a bearish swing. We see prices making lower highs and lower lows, a clear sign of a downtrend. We expect this bearishness to hold. Where that happens, we will see market in the longrun and on the lower time frames experience bearish reversals, with price untimately targetting the Monthly liquidity target.
Bearish Trend in the Euro USD PairTheir is bearish trend in the EUROUSD chart and making rectengal channel, I am taking my trade using SIP pattern

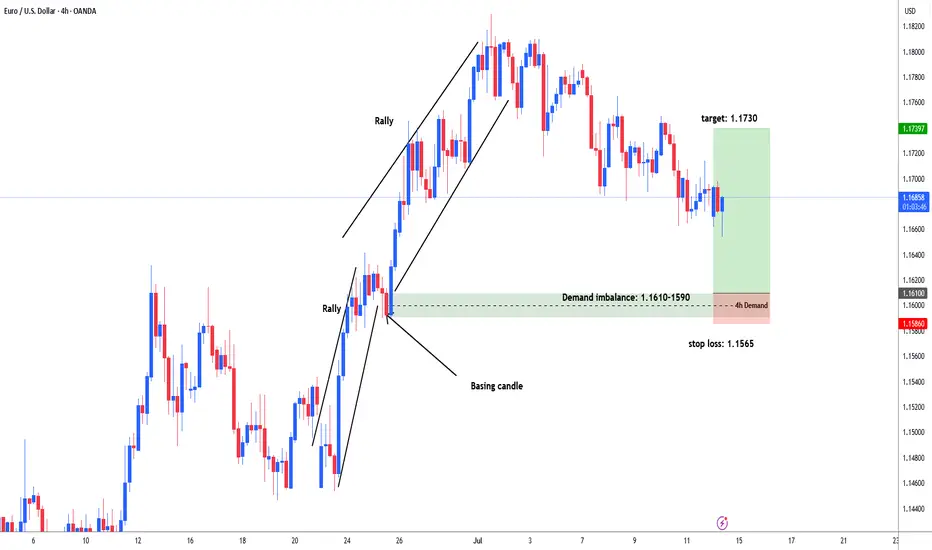
EURUSD possible long from 1.1610 area for 1.1730#eurusd market rallied 1.1450 - 1.1640. then consolidation between 1.1580-1640 area. Institutions put more buy orders and price rallied again after bases out and reached upto 1.1830 area. Now market sell off / retracement to test demand area to fill the remaining unfilled order for another leg higher. Demand zone: 1.1610-1.1590. stop loss: 1.1565, target: 1.1730. in weekly and daily chart market forming distribution shape for big sell opportunity.
Eurusd long setupEurusd strong Bullish(M,W,D)
Daily Bullish trend channel
1:4hr fvg +fib level(50%)
2:1hr ultra volume candle or bar (selling climax) break up side then go for buy trade
3: According to seasonality :Eur is Bullish(July)
4:According to seasonality :Dollar is Bearish (July)
Long-Term Opportunity: Euro’s Resilience Can Drive Bullish MovesCurrent Price: $1.16822
Direction: LONG
Targets:
- T1 = $1.1785
- T2 = $1.1830
Stop Levels:
- S1 = $1.1660
- S2 = $1.1625
**Wisdom of Professional Traders:**
This analysis synthesizes insights from thousands of professional traders and market experts, leveraging collective intelligence to identify high-probability trade setups. The wisdom of crowds principle suggests that aggregated market perspectives from experienced professionals often outperform individual forecasts, reducing cognitive biases and highlighting consensus opportunities in Euro.
**Key Insights:**
The Euro continues to show resilience despite broader market challenges, presenting selective bullish opportunities. Germany's industrial production recovery and the Euro's strength against weaker currencies like the Japanese Yen and New Zealand Dollar reinforce the potential for upward pressure. However, critical upcoming events such as CPI and retail sales data could serve as catalysts for significant price movement. A data-driven approach remains crucial, with an eye on key support and resistance levels to validate bullish momentum.
Euro sentiment has also been influenced by global interest rate dynamics and the Federal Reserve’s hawkish stance, which impacts the US Dollar. Still, the Euro has found footing as investors weigh potential policy shifts from the European Central Bank (ECB) later in the year.
**Recent Performance:**
The Euro has defended against broader weakness in regional European markets while managing to sustain strength against select global currencies. Recently, EUR/USD experienced a steady recovery from critical multi-week lows at $1.1650 as traders focused on better-than-expected German industrial production of +1.2%. However, softer retail sales (-0.7%) and export data (-1.4%) have tempered some of the optimism.
**Expert Analysis:**
Analysts highlight that while weak macroeconomic data out of Europe remains a drag, selective trades offer strong upside potential for the Euro. Germany's industrial production continues to underpin sentiment, with analysts recommending long positions after confirming swing lows and bullish patterns. Technical setups focusing on Fibonacci retracement levels provide critical entry points, which suggest limited downside risk relative to the potential upside reward.
**News Impact:**
Key developments such as renewed tariff tensions and slower global economic momentum continue to shape Euro outlooks. The upcoming release of UK CPI on Wednesday and Eurozone retail sales updates may spark additional volatility. Professional traders emphasize careful monitoring of headline risk, with potential for surprising bullish catalysts that would justify higher pricing levels in the near term.
**Trading Recommendation:**
The Euro is poised for a potential rebound in the coming weeks, with technical and fundamental indicators aligning to suggest a bullish trajectory. Current price levels offer attractive entry points, provided stop-loss levels are respected to mitigate downside risk. Focus on a long-term perspective, leveraging data-driven insights to capture potential gains toward $1.1785 and beyond.
EURUSD - OPPORTUNITY TO PLAY BOTH SIDES OF DESCENDING CHANNEL CMCMARKETS:EURUSD
TRADING IDEA - EURUSD MOVES WITHIN A DESCENDING CHANNEL - OPPORTUNITY TO PLAY BOTH SIDES
EURUSD has been trading within a descending channel since the beginning of the month. Nearby the upper border of the channel there is SMA200 on a 30-m timeframe, pushing on the pair. Generally speaking, all major moving averages are pushing on the EURUSD, the short-term bearish trend continues, so I decided to open
🔽 a market sell order at 1.16688 with
❌a stop loss at 1.16985 and
🤑a take profit at 1.16324
Later I expect a rebound from the lower border with a potential uprise towards upper border of the descending channel.

Fundamental Market Analysis for July 14, 2025 EURUSDThe euro remains under pressure: on Monday the pair slipped to 1.16750 after the European Commission extended its pause on retaliatory tariffs against the United States until 1 August. With no resolution in sight, the trade dispute keeps European exporters on edge and turns the dollar into a safe-haven choice for investors looking to limit risk.
Additional support for the greenback comes from rising real yields. The 10-year U.S. Treasury rate is holding above 4.40 %, locking in a wide spread over German Bunds. That has led futures traders to price in just one 25 bp Federal Reserve rate cut for the rest of the year, reducing the euro’s relative appeal.
Macro data from the euro area offer little relief. German industrial production rose only 0.2 % m/m in May, while the July ZEW expectations index slid back into negative territory. With the ECB having already delivered a June cut and projecting lower inflation ahead, inward capital flows to the eurozone remain subdued.
Trading recommendation: SELL 1.16750, SL 1.17050, TP 1.16200

Eurousd techinical analysis.This chart is for EUR/USD on the 1-hour timeframe, showing a harmonic pattern (likely a bullish Gartley or Bat) identified between points A-B-C-D, along with trendlines, consolidation zones, and measured move annotations. Here’s a breakdown:
---
🔍 Key Observations:
1. Harmonic Pattern (ABCD or Gartley/Bat):
Points A → B → C → D are marked.
B retraces to 1.117 (likely 61.8%-78.6% Fibonacci).
C retraces to 0.93 (possibly 88.6% or 61.8%).
The full pattern suggests a potential bullish reversal from point D.
2. Descending Trendline (Pink):
A clear downtrend line intersects the chart.
Price recently broke above this trendline, indicating a potential breakout.
3. Support & Resistance Zones (Purple Rectangles):
Support around 1.1610–1.1630 (bottom zone).
Resistance at 1.1690–1.1710 (top zone).
Price is currently at 1.16676, right between zones.
4. Measured Move (Green Arrow):
Shows a projected upside move of 36.1 pips (0.31%) from D to the top resistance.
This suggests a target area if the bullish pattern plays out.
---
✅ Potential Setup:
Bullish Bias due to:
Harmonic pattern completion at D.
Break above descending trendline.
Holding near midrange with room to 1.1700+.
Confirmation Needed:
Strong bullish candlestick or volume at D.
Break and close above 1.1690 for continuation.
Invalidation:
Break below the purple support zone (~1.1610).
---
📌 Summary:
This chart illustrates a potential **bull

EURUSD InsightHello to all our subscribers.
Please share your personal thoughts in the comments. Don't forget to like and subscribe!
Key Points
- Attacks on Fed Chair Jerome Powell are intensifying, mainly from President Trump and his close aides. Analysts say the tension between the White House and the Federal Reserve has reached a serious level.
- President Trump announced on Truth Social that starting next month, a 30% reciprocal tariff will be imposed on both the EU and Mexico.
- Canada added 83,100 jobs in June compared to the previous month, in line with market expectations. The unemployment rate came in at 6.9%, slightly below the forecast of 6.9%. The strong labor market data likely reduced the chances of a rate cut by the Bank of Canada in July.
This Week’s Key Economic Events
+ July 15: U.S. June Consumer Price Index (CPI)
+ July 16: U.K. June Consumer Price Index, U.S. June Producer Price Index (PPI)
+ July 17: Eurozone June Consumer Price Index
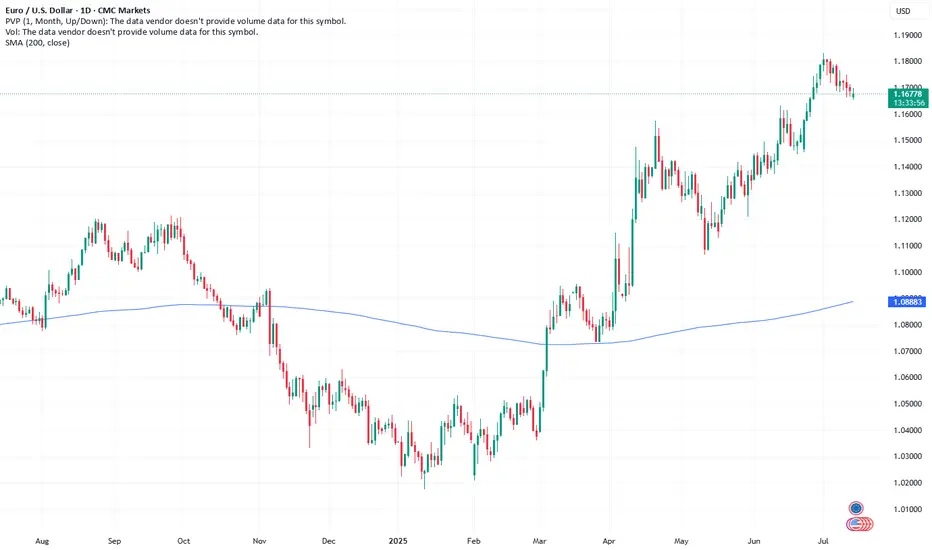
EURUSD Chart Analysis
The price has broken below the trend channel and is now forming under the 1.17000 level. The downside appears more likely than an upward move. The expected support level is around 1.15000. Whether the price bounces from this area or breaks further downward will likely determine the future direction.

EUR/USD Breaks Major Trendline Support – Bearish Continuation In🔍 EUR/USD Technical Breakdown – Bearish Structure Confirmed
The EUR/USD pair has officially broken below a well-established ascending trendline that supported the bullish structure since early May. This technical break is a strong bearish signal, suggesting a potential shift in market sentiment as the pair loses upward momentum.
The pair is now trading around 1.16760, with sellers gaining control after failing to sustain above the 1.1700 region. The breakdown aligns with classic market structure principles, where a clean trendline violation often leads to a continuation move toward the next key support zone.
📍 Target Zone:
The identified downside target is around 1.1500, a critical demand zone that aligns with previous consolidation and potential liquidity pools. This area may act as a magnet for price before any significant reversal occurs.
📘 Trader's Insight:
This setup presents a clear example of a trendline break leading to a bearish continuation pattern. Professional traders may look for retests of the broken trendline for confirmation entries, or short-term rallies to add positions, while maintaining disciplined risk management.
✅ Technical Summary:
Structure: Bearish Breakout
Resistance: 1.1700
Support/Target: 1.1500
Bias: Bearish below trendline
