EUR/USD Bullish Continuation SetupMarket Structure Overview:
The market remains in a clear higher timeframe bullish trend, consistently forming higher highs and higher lows. Recently, price has entered a descending channel, resembling a bull flag formation — a classic continuation pattern that typically precedes a strong bullish breakout.
Key Observations:
✅ Descending Channel (Bull Flag): Price is respecting a downward-sloping channel while remaining above key demand zones.
💧 Liquidity Pools: Multiple liquidity highs have been left untouched above — suggesting fuel for a potential impulsive move upward.
🧹 Liquidity Sweep: On both H4 and H1, we see a clear sweep of previous equal lows, tapping into a significant demand zone.
📈 Reaction from Demand: Strong reaction from the demand zone suggests institutional buying interest.
🔵 Projection: A bullish breakout from the flag could target the liquidity above 1.1800, with immediate resistance near 1.1740–1.1760.
Bias:
🔼 Bullish — as long as price holds above the most recent demand zone (~1.1649), the bias remains bullish with expectations of a breakout and continuation toward previous highs.
Note: We must see how the market opens on Sunday night going into Monday. Based on the initial price action, we can determine the best trading opportunities and direction for the upcoming week.
USDEUX trade ideas

eur usd possible scenario for eur usd if it is to repeat the last swing pattern it can be a viable trade

eur usd bullish ideahope you have a green portfolio this is an idea based on trending lines and bullish flag pattern there is possibility that this happen today

eur usd bullish flag scenarioas it seem we may have a bullish flag today or tomorrow lets see.
for break out confirmation use 15 min chart, use candle stick patterns and avoid trades on major news out come cuase they can to lead unpredictable result so every analyze can go wrong.. good luck

Two Brains, One Trade: Why You Freeze Under PressureBy MJTrading:
In trading, your biggest opponent isn’t volatility.
It’s your own neural wiring.
Every trader operates with two main systems:
🧠 System 2 – Rational, deliberate, planning (Prefrontal Cortex)
🧠 System 1 – Emotional, instinctive, fast (Amygdala & Limbic Brain)
Before entry, System 2 is in control. You feel calm, logical.
But the moment money is at risk—especially in drawdown or after a missed TP—System 1 takes over.
💥 Stress hormones spike
💥 Focus narrows
💥 Long-term thinking disappears
💥 You freeze, or act impulsively
You knew what to do.
But you didn’t do it.
Because in that moment, your rational mind wasn’t driving anymore.
⚖️ Set & Forget vs. Floating Managers
Different trading personalities react differently under pressure:
🔹 Set & Forget Traders
Rely on automation or predefined exits to bypass emotional hijack.
They reduce cognitive load, but often feel regret when price goes “a little more.”
🔹 Floating Management Traders
Rely on intuition and live feeling. They stay with the chart, adjusting based on flow.
When calm and trained, they shine.
But under pressure, they’re more vulnerable to emotional loops:
– hesitation
– premature exits
– revenge tweaks
– system betrayal
🧘♂️ What can you do?
✔️ Pre-plan decisions
Make the hard calls before emotions kick in.
✔️ Mental rehearsal
Visualize trade management scenarios—yes, like athletes do.
✔️ Create fallback protocols
So if you freeze, your system still knows what to do.
🧠 For Those Who Want to Go Deeper:
“Thinking, Fast and Slow” by Daniel Kahneman
Understand System 1 & 2 thinking—and how cognitive bias shapes all decisions, not just trades.
“The Hour Between Dog and Wolf” by John Coates
A stunning look at how biology, hormones, and risk-taking collide in traders' brains.
🔓 Final Thought:
If your strategy works in theory, but breaks in real-time—
It’s time to work on your neural execution layer.
Because in trading, you don’t rise to your level of analysis—
you fall to your level of emotional wiring.
— MJTrading
#NeuroTrading #TraderTypes #TradingPsychology #SetAndForget #FloatingManagement #MindOverMarkets #EURUSD #MJTrading
Previous psychology Ideas:

EURUSDEUUSD bouncing of a nice 4hr trendline for few days already. its time to break from the curse and move in a direction. Could it be bearish or bullish?
if the elliot wave is accurate, seems like to have a correction for the begining of next week. Let us know what you think?

EURUSD LONG TERM UPEURUSD Live Trading Session/ EURUSD analysis #forex #forextraining #forexHello Traders
In This Video EURUSD HOURLY Forecast By World of Forex
today EURUSD Analysis
This Video includes_ (EURUSD market update)
EURUSD Analysis today | Technical and Order Flow
#usdjpy #usdchftechnicalanalysis #usdjpytoday #gold
What is The Next Opportunity on EURUSD Market
how to Enter to the Valid Entry With Assurance Profit?
This Video is For Trader's that Want to Improve Their Technical Analysis Skills and Their Trading By Understanding How To Analyze The Market Using Multiple Timeframes and Understanding The Bigger Picture on the Charts.
Disclaimer: Financial Trading Has Large Potential Rewards, But Also Large Potential Risk. You must be aware of the Risk and Be Welling to Accept Them in order to Trade the Financial Market . Please be Carefully With Your Money.
We are talking about future market, anything can Happen,Markets are Always like that.dnt Risky more Than 2% of your account
Now you can join with our "vip premium" service
Join us and let's make trading together

EURUSD Daily: More trouble ahead or ready to recover?The last Friday NY bearish closed sited at Fibo(38.2) and still showing a strong bullish move since last March we may see a bit more downward move to test the Fibo(50) at 1.16388 before start another bullish leg up again. While the price stays above the 1.5956 level I will look for any price action towards 1.18298 but with all chaos caused by this tariff war we need to be careful.
As a technical reference, Resistance at 1.182998, Support at 1.14522 and RSI(14) at 58 that seems to be heading to test the 50 level.

EURUSD Trade idea for 14th - 118th July 2025For next week, I am expecting bullish moves on EURUSD with a target at 1.18297. The trigger for this trade will be a CISD at 1.17071. I expect to cascade this trade with FVGs setups on the 4HR timeframe.

EURUSD: Detailed Support & Resistance Analysis 🇪🇺🇺🇸
Here is my latest structure analysis and important
supports and resistances for EURUSD for next week.
Consider these structures for pullback/breakout trading.
❤️Please, support my work with like, thank you!❤️
I am part of Trade Nation's Influencer program and receive a monthly fee for using their TradingView charts in my analysis.

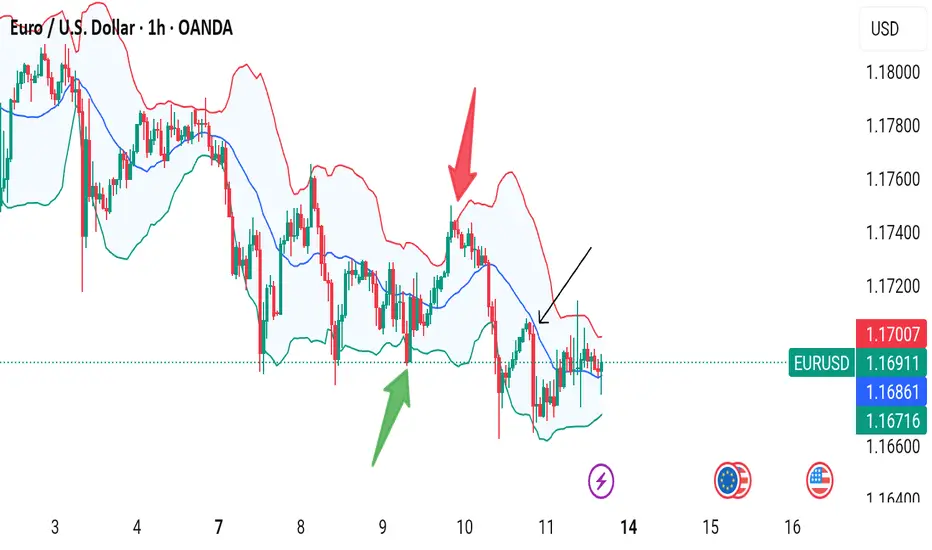
What Are Bollinger Bands? How to use it.✅ What Are Bollinger Bands?
Bollinger Bands are a volatility-based technical analysis tool developed by John Bollinger. They consist of three lines:
1. Middle Band: 20-period Simple Moving Average (SMA)
2. Upper Band: Middle Band + 2 standard deviations
3. Lower Band: Middle Band - 2 standard deviations
The bands expand and contract based on price volatility.
📊 What Bollinger Bands Tell You
Contraction (Squeeze): Low volatility, possible breakout coming
Expansion: High volatility, breakout in progress or exhausted
Price Touches Band: Doesn’t mean reversal—it's a sign of strength or weakness
🎯 Mastering Strategies with Bollinger Bands
1. Bollinger Band Squeeze (Breakout Strategy)
Setup: Bands are very close together (low volatility)
Signal: Wait for breakout and volume spike
Action: Enter in direction of breakout
Tip: Combine with MACD or RSI for confirmation
> 🔍 Example: If the price breaks above the upper band with strong volume after a squeeze → potential long entry.
2. Mean Reversion (Reversal Strategy)
Setup: Price touches or exceeds upper/lower band
Signal: Look for RSI divergence, candlestick reversal patterns
Action: Fade the move back to the 20 SMA (mean reversion)
Tip: Works best in ranging markets
> ⚠️ Warning: Don’t short just because price touches the upper band. Look for confluence.
3. Trend Riding with Bands
Setup: Price rides upper/lower band
Signal: Pullbacks to the 20 SMA in a strong trend
Action: Enter on bounce near SMA if the trend is strong
Tip: Use higher timeframes to confirm the trend
> 🟢 In an uptrend, buy near the 20 SMA when price pulls back but doesn’t break lower band.
📌 Key Tips for Mastery
1. Adjust settings for asset/timeframe (e.g., crypto might need a 10 or 14 SMA)
2. Never use Bollinger Bands alone – combine with:
RSI (for overbought/oversold confirmation)
MACD (trend confirmation)
Volume (for breakout confirmation)
3. Use multiple timeframes – e.g., 4H for trend, 15m for entry
4. Avoid chasing band breakouts without confirmation
5. Backtest strategies with your preferred asset
🧠 Advanced Concepts
Double Bottoms Outside Band: When price forms a W-bottom with the second low outside the lower band bullish reversal setup.
Walking the Band: In strong trends, price can "walk" along the band don’t fade too early.
Band Width: Track the width of bands to detect upcoming breakouts.
⚠️ Disclaimer
This guide is for educational purposes only and does not constitute financial advice. Trading involves risk, and past performance does not guarantee future results. Always do your own research (DYOR) and consult with a financial advisor before making any investment decisions.
EUR/USD - Potential TargetsDear Friends in Trading,
How I see it,
PIVOT AREA @ 1.16630 - 1.17160
1) Rangebound at this time between support and resistance.
2) We need a strong breach above or below PIVOT area.
Keynote:
1.16420 - 1.16300 = 50% retracement area from
23rd of June on 1D Time Frame Correction path.
I sincerely hope my point of view offers a valued insight.
Thank you for taking the time to study my analysis.

continue example 1 how to identify direction of the marketeurussd replicated on w d 4 Today 1220254
join the bullies

EURUSDEURUSD appears to be running SSL. 4H levels identified. Looking for Break & retest. If support does not hold on to any level, expect the bulls to return and take over.

EURUSD EU has been bearish from last week as we can see..
We expect further drop from next week after a small rally to to resistance
I will update the analysis depending on price action ..
Kindly and support for and follow more setups

direction example 1 finding directionbullish mostly
market reading saturday 12 25
2 ways to identify which direction its going
