EURUSD: POTENTIAL SELLING OPPORTUNITYThe EURUSD pair rebounded from the 1.160 resistance level after the NFP report last Friday, forming a Double Top pattern on the 4-hour chart. This pattern is a strong indication of a potential bearish reversal. With the price having broken below the neckline, it's now approaching a retest of this level and the previously broken trendline.
Key areas to watch include:
1. The neckline around 1.1600, which is expected to act as resistance.
2. The trendline between 1.1670-1.1700, which could provide additional resistance to confirm the bearish outlook.
Possible scenarios include:
Bearish Outlook (Preferred): If the price encounters resistance at these levels and fails to break higher, it may lead to a decline.
This setup suggests a potential selling opportunity, with traders looking to short the pair near the resistance zones.
USDEUX trade ideas

EURUSD Will Go Lower! Sell!
Here is our detailed technical review for EURUSD.
Time Frame: 1h
Current Trend: Bearish
Sentiment: Overbought (based on 7-period RSI)
Forecast: Bearish
The market is on a crucial zone of supply 1.158.
The above-mentioned technicals clearly indicate the dominance of sellers on the market. I recommend shorting the instrument, aiming at 1.153 level.
P.S
Please, note that an oversold/overbought condition can last for a long time, and therefore being oversold/overbought doesn't mean a price rally will come soon, or at all.
Disclosure: I am part of Trade Nation's Influencer program and receive a monthly fee for using their TradingView charts in my analysis.
Like and subscribe and comment my ideas if you enjoy them!

EURUSDEUR/USD is the most traded currency pair in the world, representing the exchange rate between the euro (EUR) and the US dollar (USD). It reflects how many US dollars are required to purchase one euro. Introduced in 1999 with the launch of the euro, this pair has become a global benchmark due to the economic size and influence of both the Eurozone and the United States. It is highly liquid and closely watched by traders, investors, and policymakers, with its value shaped by monetary policy, interest rate differentials, macroeconomic indicators, and geopolitical developments.
Historically, EUR/USD has seen major swings. In the early 2000s, the pair fell to around 0.82 before rallying to a peak above 1.60 in 2008 during a period of dollar weakness. It then declined sharply during the European debt crisis. In 2022, amid aggressive interest rate hikes by the US Federal Reserve and rising global uncertainty, the pair briefly fell below parity, trading under 1.00 for the first time in nearly two decades. However, as inflation in the US began to ease and expectations of rate cuts grew, the euro gradually strengthened through 2023 and 2024.
As of August 2025, EUR/USD is trading around 1.15800. This reflects a moderate recovery of the euro from its lows, supported by a more stable Eurozone economy and a softer US dollar. The pair remains sensitive to central bank signals, particularly from the European Central Bank and the Federal Reserve, and is likely to continue reacting to shifts in monetary policy, inflation data, and global risk sentiment. EUR/USD remains a cornerstone of the forex market, widely used by traders for both short-term strategies and long-term positioning.


EURUSD targeting 1.10 after breaking key supportEURUSD has finally broken below the key 1.15 level, triggering a move lower in line with earlier expectations. The drop follows the US imposing fresh tariffs on European goods, a move that traditionally strengthens the currency of the tariff-imposing nation.
Supporting the dollar further, the latest ADP and GDP reports came in stronger than forecast, while the Fed remains hawkish despite pressure from President Trump to cut rates. Inflation is expected to rise as tariffs take effect, giving the Fed reason to stay firm.
Technically, EURUSD may still bounce short term but the overall bias is lower. As long as it stays below 1.1653, the bearish case holds. Target zones include 1.10 or even 1.0950, offering a risk-reward ratio close to 3 to 1.
This content is not directed to residents of the EU or UK. Any opinions, news, research, analyses, prices or other information contained on this website is provided as general market commentary and does not constitute investment advice. ThinkMarkets will not accept liability for any loss or damage including, without limitation, to any loss of profit which may arise directly or indirectly from use of or reliance on such information

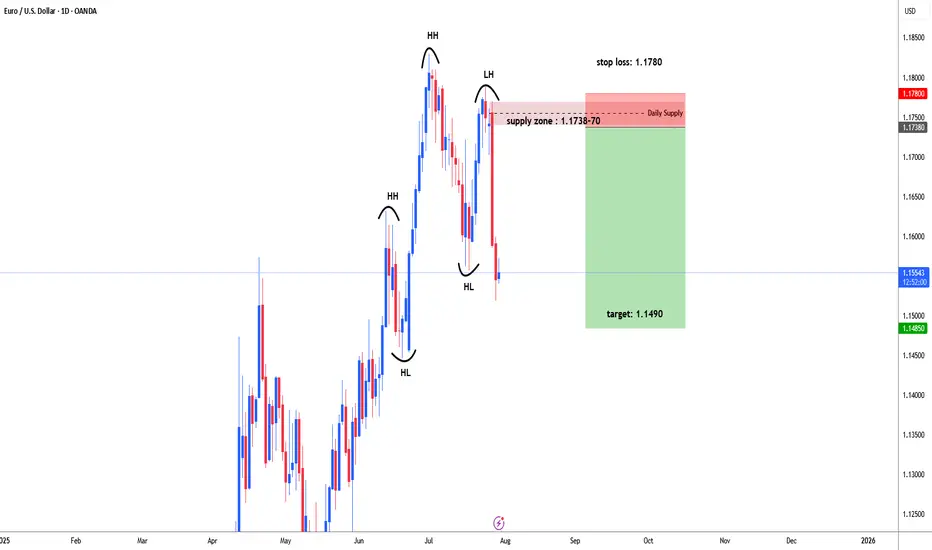
EURUSD possible bearish for 1.1490#EURUSD failed to form higher high and higher low to continue bullish trend. eurusd made a high on 1st July 1.1830, then price started retrace downside. 7th July daily bearish engulfing candle formed , early indication for selling. 23rd July price moved up side to test supply zone. Price did not break high of bearish engulfing candle and fall back. Price started heavily fall and broke recent supply level 1.1557 and form Lower High that is indication for trend reversal.
1.1738-70 ideal level for selling which is daily supply zone. stop loss above 1.1770 i.e. 1780-1.1800. target: 1.1490 and even may expect further down.
EURUSD | H4 Bullish bounce offBased on the H4 chart analysis, the price is reacting off the support level, which is a pullback support, and could rise higher.
Buy entry is at 1.1535, which is a pullback support.
Stop loss is at 1.1453, which is an overlap support that is underneath the 138.2% Fibonacci extension.
Take profit is at 1.1616, which is a pullback resistance that aligns with the 38.2% Fibonacci retracement.
High Risk Investment Warning
Trading Forex/CFDs on margin carries a high level of risk and may not be suitable for all investors. Leverage can work against you.
Stratos Markets Limited (tradu.com ):
CFDs are complex instruments and come with a high risk of losing money rapidly due to leverage. 65% of retail investor accounts lose money when trading CFDs with this provider. You should consider whether you understand how CFDs work and whether you can afford to take the high risk of losing your money.
Stratos Europe Ltd (tradu.com ):
CFDs are complex instruments and come with a high risk of losing money rapidly due to leverage. 66% of retail investor accounts lose money when trading CFDs with this provider. You should consider whether you understand how CFDs work and whether you can afford to take the high risk of losing your money.
Stratos Global LLC (tradu.com ):
Losses can exceed deposits.
Please be advised that the information presented on TradingView is provided to Tradu (‘Company’, ‘we’) by a third-party provider (‘TFA Global Pte Ltd’). Please be reminded that you are solely responsible for the trading decisions on your account. There is a very high degree of risk involved in trading. Any information and/or content is intended entirely for research, educational and informational purposes only and does not constitute investment or consultation advice or investment strategy. The information is not tailored to the investment needs of any specific person and therefore does not involve a consideration of any of the investment objectives, financial situation or needs of any viewer that may receive it. Kindly also note that past performance is not a reliable indicator of future results. Actual results may differ materially from those anticipated in forward-looking or past performance statements. We assume no liability as to the accuracy or completeness of any of the information and/or content provided herein and the Company cannot be held responsible for any omission, mistake nor for any loss or damage including without limitation to any loss of profit which may arise from reliance on any information supplied by TFA Global Pte Ltd.
The speaker(s) is neither an employee, agent nor representative of Tradu and is therefore acting independently. The opinions given are their own, constitute general market commentary, and do not constitute the opinion or advice of Tradu or any form of personal or investment advice. Tradu neither endorses nor guarantees offerings of third-party speakers, nor is Tradu responsible for the content, veracity or opinions of third-party speakers, presenters or participants.

Hold off on EURUSD for nowYesterday, EURUSD dropped over 150 pips following the trade agreement between the US and the European Union.
Tomorrow, the Fed is expected to announce interest rates, which could bring further volatility.
Avoid entering new positions at the moment and don’t overdo it with your lot sizes.
Once the news is out, there will be clearer and more confirmed trade opportunities.

EURUSD Wave Analysis – 28 July 2025- EURUSD reversed from the resistance level 1.1775
- Likely to fall to support levels 1.1555 and 1.1460
EURUSD recently reversed down from the resistance zone between the resistance level 1.1775 (which stopped the previous impulse wave 3 at the start of July, as can be seen below) and the upper daily Bollinger Band.
This resistance zone was further strengthened by the lower trendline of the recently broken up channel from May (acting as resistance after it was broken earlier).
Given the strongly bullish US dollar sentiment, EURUSD can be expected to fall to the next support levels 1.1555 and 1.1460 – the low of waves 4 and iv.

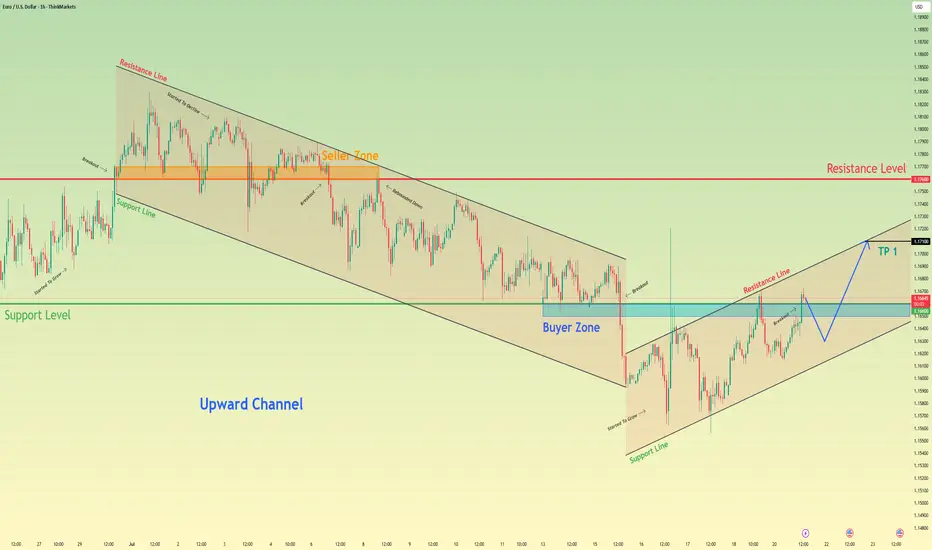
Euro may correct a little and then continue to rise in channelHello traders, I want share with you my opinion about Euro. Observing the recent price action, we can map out a clear transition in market structure. Previously, the pair was contained within a well-defined downward channel, where the seller zone around the 1.1760 resistance level consistently capped rallies, leading to multiple breakdowns and correctional movements. However, after a final push lower, the dynamic shifted, with the price action showing a clear downtrend-to-uptrend reversal. Currently, the euro has established a new upward channel, finding solid ground in the buyer zone around the 1.1660 support level. The price is now engaged in a constructive upward movement within the boundaries of this new channel. The prevailing hypothesis is that after a potential minor correction towards the channel's support line, the pair will resume its ascent. Therefore, the take-profit target for this scenario, tp 1, is strategically placed at 1.1710, as this level directly corresponds with the resistance line of the current upward channel, representing a logical point for price to react. Please share this idea with your friends and click Boost 🚀
Disclaimer: As part of ThinkMarkets’ Influencer Program, I am sponsored to share and publish their charts in my analysis.
EURUSD Outlook – From Bias to Execution Previous day closed bearish, leading to a sell bias, on the 45M, I marked my possible entry and exit area.


EUR/USD - Bullish parallel channel formation!The EUR/USD currency pair is currently exhibiting a bullish market structure on the 4-hour timeframe, moving steadily within a well-defined ascending parallel channel. Price action has consistently bounced between the lower and upper boundaries of the channel, with each dip finding support at the lower trendline and each rally meeting resistance near the upper trendline. This ongoing pattern suggests a strong and orderly bullish trend as the pair continues to make higher highs and higher lows within the channel.
The Market’s Upward Momentum
One notable feature of this trend is the recurring formation of 4-hour Fair Value Gaps (FVGs) during each upward leg. These FVGs act as temporary inefficiencies in the price movement, which the market consistently returns to fill before resuming its bullish momentum. As shown in the chart, the EUR/USD has filled multiple FVGs over the past week. Today, the pair once again retraced to fill a newly formed 4H FVG and has since continued its move higher. This repeated behavior reinforces the strength of the uptrend, as the market efficiently corrects itself and then propels further in the direction of the overall trend.
Bullish Outlook
From a bullish perspective, the key level to watch is the horizontal resistance zone around 1.1766. A confirmed break and hold above this level would signal a strong continuation of the current uptrend. Should the price sustain itself above this level, it could initiate a renewed push toward the upper boundary of the ascending channel, potentially targeting levels near 1.1820 and beyond. This scenario would confirm market confidence and open the door for further gains.
Bearish Risk
On the flip side, the bearish case would involve a false breakout above the 1.1766 resistance level, followed by a sharp rejection and a break below the rising lower trendline of the channel. Such a move would invalidate the current structure and shift the bias to the downside. In that case, the 4-hour FVG located between approximately 1.1710 and 1.1740 will act as a critical support zone. If this area fails to hold, it could trigger a deeper retracement and potentially lead to a more prolonged bearish correction.
Final thoughts
In summary, the EUR/USD is currently respecting a bullish parallel channel on the 4-hour timeframe, with upward moves consistently leaving and then filling 4H FVGs before continuing higher. The 1.1766 level is pivotal, a sustained break above it favors continued bullish momentum, while a rejection and breakdown from the channel could signal a bearish reversal. Traders should closely monitor price behavior around this key level and the integrity of the ascending channel to anticipate the next significant move.
-------------------------
Disclosure: I am part of Trade Nation's Influencer program and receive a monthly fee for using their TradingView charts in my analysis.
Thanks for your support. If you enjoyed this analysis, make sure to follow me so you don't miss the next one. And if you found it helpful, feel free to drop a like 👍 and leave a comment 💬, I’d love to hear your thoughts!

EURUSD Buy Limit Order Opportunity You Can’t MissAnalyzing market structure and liquidity using Price Action and Smart Money Concepts. Focused on key supply/demand zones and institutional order flow

EURUSD Analysis – Supply Zones & Reversal Opportunities (MMC)Today’s EURUSD analysis focuses on identifying major supply zones, potential reversal points, and directional bias using the Mirror Market Concept (MMC) on the 8-hour timeframe.
1️⃣ Market Structure & Channel Supply Zone
The market recently formed a descending channel 📉, acting as a full supply zone where sellers dominated.
Every time price touched the upper boundary of this channel, we saw bearish reactions, proving this zone as a strong liquidity grab area.
Breakdown from the channel: After repeated attempts to break the channel to the upside, sellers regained control, pushing EURUSD lower and confirming bearish momentum.
2️⃣ Central Reversal Zone (Decision Point) ⚖️
Currently, price is consolidating around the Central Reversal Zone.
This zone is crucial because it can act as:
Reversal Point 🟢: If buyers step in aggressively, we might see a bullish leg toward previous swing levels, targeting resistance zones.
Continuation Zone 🔻: If sellers maintain pressure and break below this level, momentum will shift strongly bearish, aiming for deeper support.
Price behavior here will define short-term direction. Traders must wait for confirmation before committing to large positions.
3️⃣ Next Major Reversal Zone (High-Probability Demand) 🟩
Marked in green, this zone is expected to attract buyers if the current level fails.
Historically, these areas show high liquidity grabs and institutional activity.
If price reaches this zone, we expect significant bullish interest, making it a high-probability reversal area for medium-term buy setups.
4️⃣ Trade Scenarios
Scenario 1 (Bullish Reaction 🟢):
Price bounces from the Central Reversal Zone.
Possible targets: Previous structure highs inside the channel break zone.
Scenario 2 (Bearish Continuation 🔻):
Price fails to hold above and breaks lower.
Target: Next Major Reversal Zone for fresh liquidity accumulation.
5️⃣ Trading Approach & Risk Management 🛡️
Aggressive Approach: Intraday traders can scalp inside the Central Reversal Zone but must keep tight stop-losses to avoid fake-outs.
Conservative Approach: Wait for a clean break and retest confirmation, especially near the Next Reversal Zone for high-probability trades.
Maintain risk-to-reward (RR) ≥ 1:2 and avoid emotional trading during reversal attempts.
Summary:
EURUSD is at a critical juncture. The current market structure shows a bearish tone, but the Central Reversal Zone can still cause a temporary bullish reaction. A failure to hold will open the path toward the green reversal demand zone, where major buyers are likely to appear.

EUR/USD Technical Analysis📈 EUR/USD Technical Analysis
🔍 1. Market Structure
⚙ Trend Context
• The overall trend since mid-July has been bullish, with higher highs and higher lows forming after a bounce from a key demand zone (around 1.15380).
• However, recent candles show indecision and a potential reversal, suggesting weakening momentum.
⸻
🧱 2. Volume Profile Insight (VRVP)
• High Volume Nodes (HVNs):
• Significant trading activity occurred between 1.172–1.176, now acting as resistance.
• Low Volume Gaps:
• Thin liquidity zones exist between 1.165–1.158, which could result in swift price movement if selling pressure increases.
📘 Educational Insight: Thin volume areas on a profile typically allow for faster price transitions due to lack of order density.
⸻
📊 3. Envelope Indicator – Nadaraya-Watson (8,3)
• A mean-reversion tool estimating dynamic overbought and oversold areas.
• Price recently rejected the upper boundary, reinforcing the bearish outlook.
• The lower envelope, around 1.158–1.160, aligns with the projected bearish target.
⸻
🟫 4. Demand Zone Analysis
• Labeled “DEMAND ZONE” at 1.15380–1.15830
• Previously caused a strong bullish reversal, marking it as an area of institutional interest.
• A re-test of this zone may attract buyers once again, presenting a key support area.
📘 Educational Insight: Demand zones reflect

Sell eurusdBearish wave expected now
Daily support trend already breaks
Still monthly overbought pair
Strong bearish correction expected

EURUSD Long Trade - Bounce Back from Monthly SupportFX:EURUSD Long Trade.
EURUSD is Bouncing Back from Monthly Support.
Note: Manage your risk yourself, its risky trade, see how much your can risk yourself on this trade.
Don't be greedy.
Use proper risk management
Looks like good trade.
Lets monitor.
Use proper risk management.
Disclaimer: only idea, not advice

EURUSD InsightWelcome, everyone.
Please share your personal opinions in the comments. Don’t forget to hit the boost and subscribe buttons.
Key Points
- The U.S. and the EU have reached a trade agreement to impose a 15% tariff on EU goods, including automobiles. However, President Trump stated that pharmaceuticals, steel, and aluminum would be exempt from the 15% tariff. Both sides also agreed to mutually waive tariffs on "strategic items" such as aircraft and semiconductor equipment. Additionally, the EU has agreed to purchase $750 billion worth of U.S. energy and to invest an additional $600 billion in the U.S.
- High-level trade talks between the U.S. and China will be held on July 28–29, with the market expecting an extension of the current trade truce.
- Ahead of the FOMC meeting scheduled for July 29, markets are projecting an interest rate cut more likely in September rather than July.
Key Economic Events This Week
+ July 29: U.S. Department of Labor JOLTS
+ July 30: Germany Q2 GDP, U.S. July ADP Non-Farm Employment Change, U.S. Q2 GDP, Bank of Canada interest rate decision, FOMC meeting outcome
+ July 31: Bank of Japan interest rate decision, Germany July CPI, U.S. June Core PCE Price Index
+ August 1: Eurozone July CPI, U.S. July Non-Farm Payrolls, U.S. July Unemployment Rate
EURUSD Chart Analysis
The pair is showing an upward trend after finding support near the 1.16000 level. However, with resistance at the 1.18000 level—where the price previously faced rejection—the overall bias still appears bearish. That said, a breakout above this resistance line could signal a continuation of the uptrend, warranting close monitoring. For now, the outlook remains bearish toward the 1.15000 level. Should a breakout be confirmed, we will promptly revise our strategy.

EURUSD plunges without brakes – The bears take full control!EURUSD continues its steep decline as both macroeconomic and technical pressures mount. A trade deal unfavorable to the EU, combined with the Fed’s hawkish stance, has fueled USD strength and dragged the euro sharply lower. At the same time, strong U.S. labor data and rising employment costs further reinforce the bearish outlook.
On the H1 chart, EURUSD is clearly moving within a descending channel. Key price zones have been broken with no significant bullish reaction, indicating that sellers remain firmly in control. The market is heading toward a psychological support area, with no signs of reversal as RSI stays weak.
I remain biased toward SELL setups on any short-term pullbacks, avoiding countertrend trades in this environment. If downside momentum continues, deeper targets may still be ahead.
In a market dominated by bearish sentiment, trading with the trend remains the smartest and safest approach.

EURUSD SELL SHORTEURUSD in Daily TF Market will bearish , In Daily TF mss in LTF after valid MSS then Entry short in LTF
Target to Monthly BISI / Monthly OBI / OB
enjoYYYYYYYYYYYYYYYYYYYYYYYYYYYYYYYYYYYYYYYYYYYYYYYYYYYYYYYYYYYYYYYYYYYY

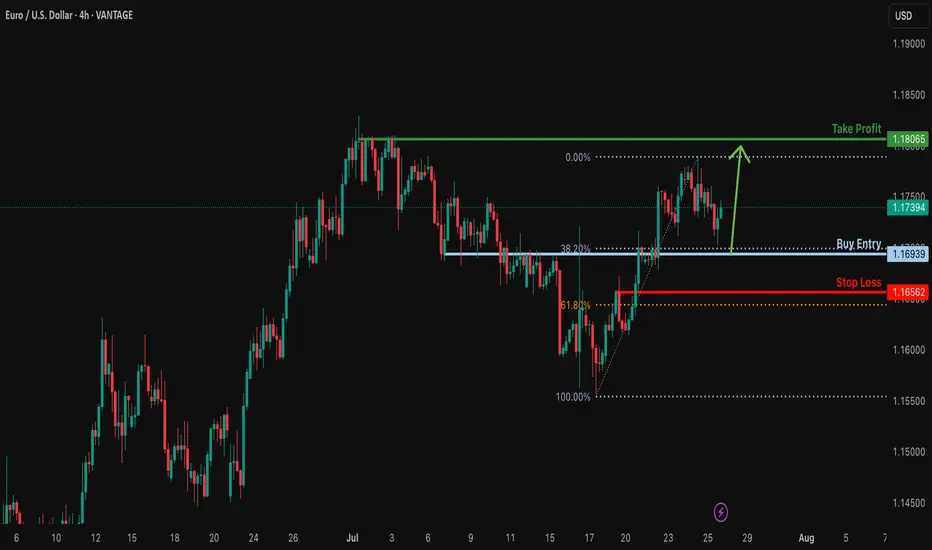
Bullish bounce off 38.2% Fibonacci support?EUR/USD is falling towards the support level, which is an overlap support that aligns with the 38.2% Fibonacci retracement and could bounce from this level to our take-profit.
Entry: 1.1693
Why we like it:
There is an overlap support that lines up with the 38.2% Fibonacci retracement.
Stop loss: 1.1656
Why we like it:
There is a pullback support that is slightly above the 61.8% Fibonacci retracement.
Take profit: 1.1806
Why we like it:
There is a swing high resistance.
Enjoying your TradingView experience? Review us!
Please be advised that the information presented on TradingView is provided to Vantage (‘Vantage Global Limited’, ‘we’) by a third-party provider (‘Everest Fortune Group’). Please be reminded that you are solely responsible for the trading decisions on your account. There is a very high degree of risk involved in trading. Any information and/or content is intended entirely for research, educational and informational purposes only and does not constitute investment or consultation advice or investment strategy. The information is not tailored to the investment needs of any specific person and therefore does not involve a consideration of any of the investment objectives, financial situation or needs of any viewer that may receive it. Kindly also note that past performance is not a reliable indicator of future results. Actual results may differ materially from those anticipated in forward-looking or past performance statements. We assume no liability as to the accuracy or completeness of any of the information and/or content provided herein and the Company cannot be held responsible for any omission, mistake nor for any loss or damage including without limitation to any loss of profit which may arise from reliance on any information supplied by Everest Fortune Group.
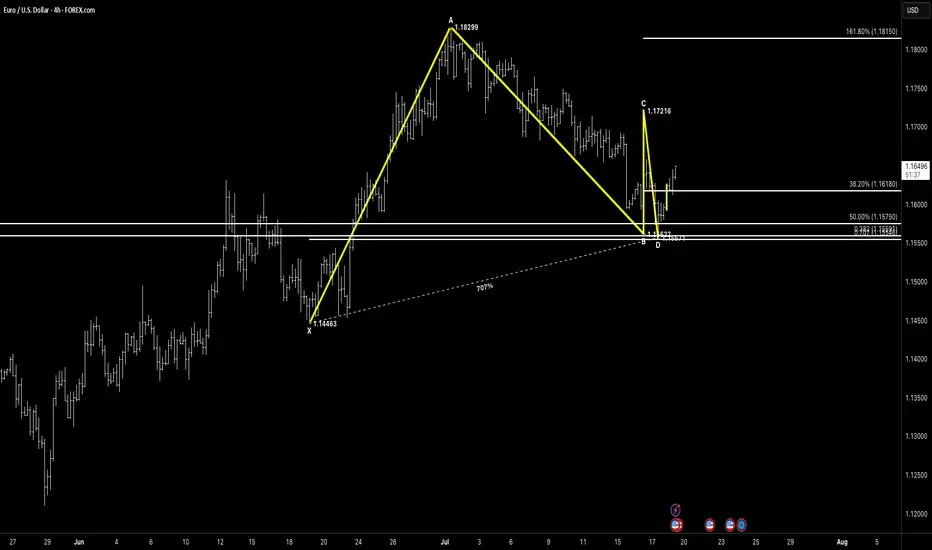
EURUSD / Euro – U.S. Dollar (4H) – ABC Bullish Structure EURUSD / Euro – U.S. Dollar (4H) – ABC Bullish Structure with Double Bottom Base
Pattern Overview:
Pattern Type: ABC Bullish + Corrective Double Bottom
Asset: EURUSD
Timeframe: 4H
Trade Type: Bullish Bias – Monitoring for continuation after rejection from cluster support
🔎 Key Levels
XA: 1.14663 → 1.18299
AB: 1.18299 → 1.16292
BC: 1.16292 → 1.17216
CD: Completion just under 1.15621 cluster
Major Fib Cluster: 0.707% XA, 0.886 AB, 50% CD, Prior Horizontal Support Zone
📐 Fibonacci Extensions & Key Ratios
38.2% retracement: 1.16180
50.0% retracement: 1.15750
161.8% extension: 1.18150
💡 Price Action & Setup
Price has completed an ABC corrective leg, forming a clean double bottom at the D point, hovering over the fib-rich support cluster.
The rejection candle shows buyer interest, and the recent higher low structure implies potential for continuation, especially if price reclaims and holds above 1.1650 short-term structure.
🧠 Market Sentiment
DXY easing slightly after strong dollar dominance
EUR macro calendar quiet – technicals may dominate next moves
Strong base = smart money accumulation likely underway
📊 Next Potential Movement
Break above 1.1675 opens path toward 1.1720, then possibly 1.1815
If 1.1575 cluster fails → risk of full XA retracement
🛡 Risk Management
Aggressive long entries already in play
Conservative entries should wait for higher low confirmation above 1.1650
Protective stop: under 1.1550 zone
📌 Conclusion
This is a bullish structure with a corrective double bottom base sitting right inside a dense confluence zone. Price is compressing between key fibs – expect a directional move next week. Keep your eye on the 1.1675 breakout or 1.1570 loss for next major decision.
“In the densest zones of indecision, patterns and confluence provide the clearest map.”