GBPUSDHello Traders! 👋
What are your thoughts on GBPUSD?
GBP/USD has broken below a trendline and has completed a retest (pullback) to the broken level.
The pair is now positioned for a potential downward move.
After some short-term consolidation, we expect price to drop at least toward the next identif
Related currencies
#GBPUSD: Going As Expected, Strong Move AheadHey Everyone,
We have a good opportunity coming up on gbpusd; since our last update on gbpusd, price went as expected. We will see huge increase in price in coming days. Good luck and take care!!
If you like our work then please like and comment.

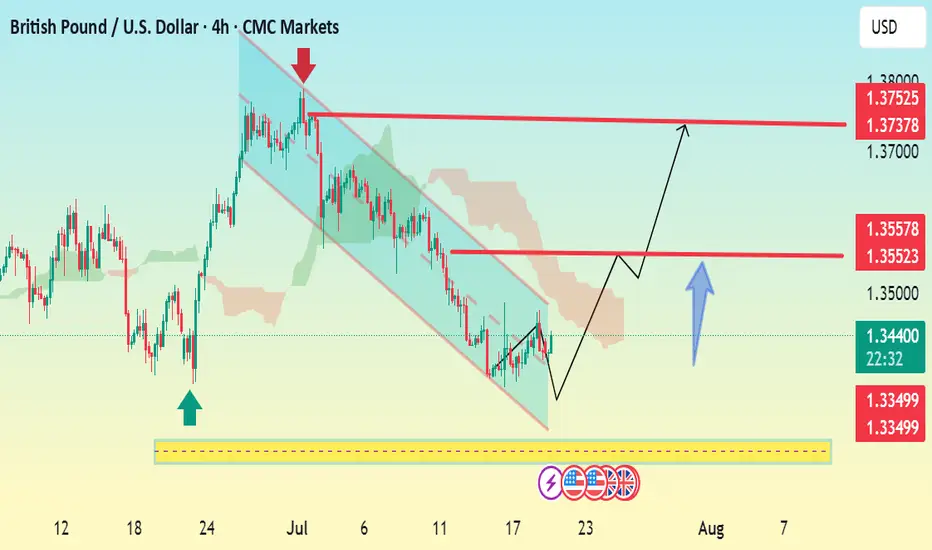
GBPUSD Breakout from descending channel bullish strong now 📊GBPUSD Bullish Forecast
4H Timeframe Analysis
GBPUSD has successfully broken out of the descending channel and is now turning bullish from the key demand zone at 1.33700 ✅
Momentum shift confirmed — buyers in control 📈
🎯 Next Target Zones:
🔹1.36000 – First Supply Zone
🔹1.37500 – Major Supply Z

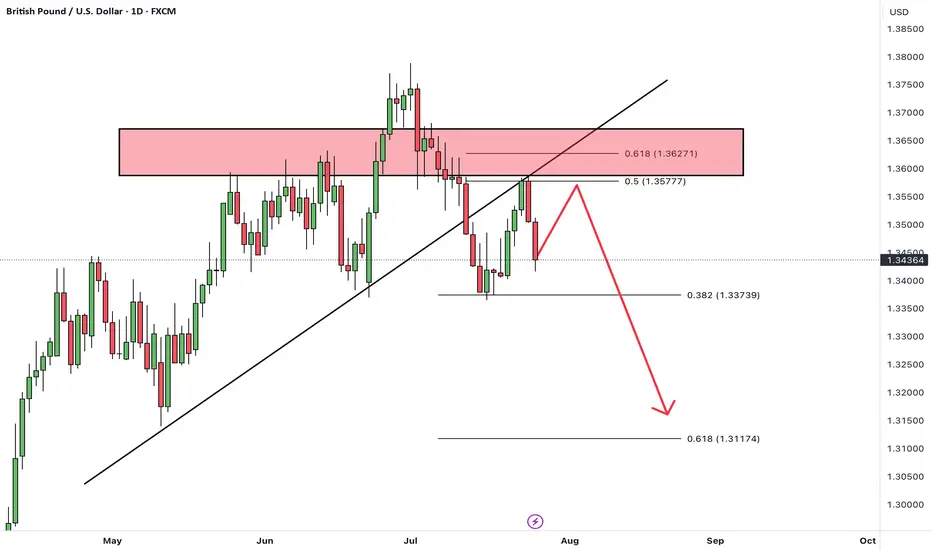
GBPUSD Traders Beware: A Major Drop Could Be ComingThe classic rule says what doesn’t go up must come down. After a failed breakout at 1.3439, GBPUSD is struggling. With longs sitting on big gains from January’s low, a drop toward 1.3361 or even lower looks likely. Watch this key level now.
This content is not directed to residents of the EU or

GBP/USD 4H Bearish Reversal Setup. GBP/USD 4H Chart Analysis (July 24, 2025):
Price is rejecting resistance near 1.35709, forming a bearish setup. A short position is highlighted with entry around 1.35067, stop loss above resistance, and target near the 1.33786 support zone. Bears aim for continuation toward 1.33745.

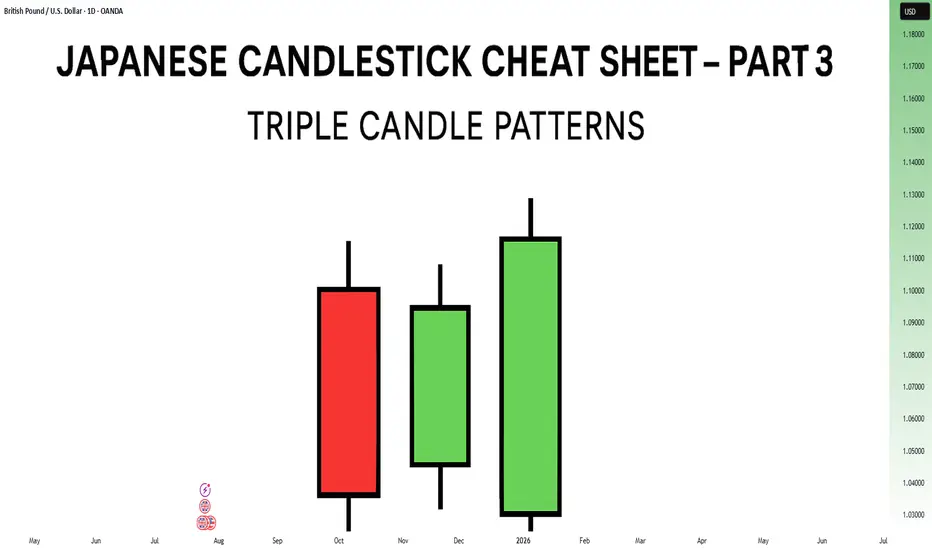
Japanese Candlestick Cheat Sheet – Part Three- 3 candle patternsSo far in this series, we've broken down single candle formations ( Part 1 ) and explored double candle signals ( Part 2 ) — the kind of patterns that give you quick, often powerful hints about the market’s mood.
But now it’s time to go a step further.
👉 In Part 3, we dive into triple candlestick
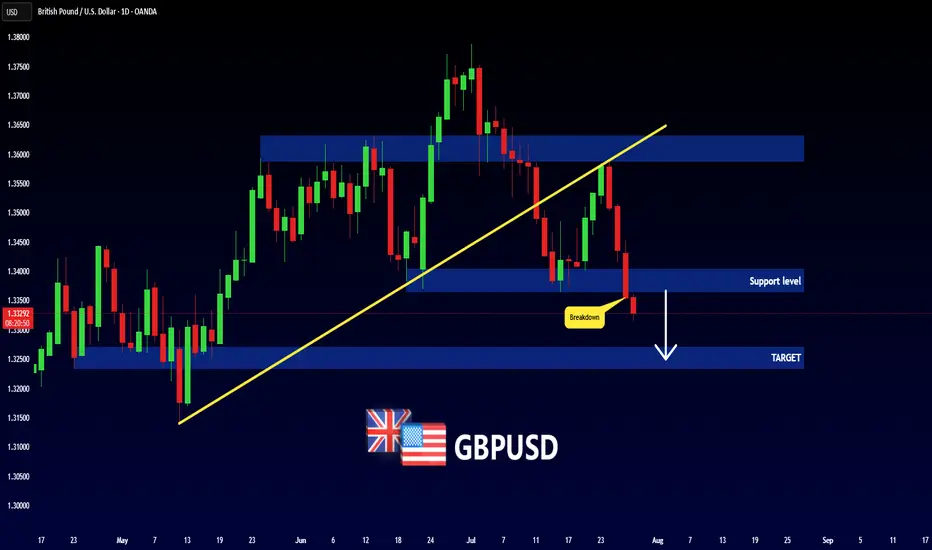
GBPUSD - NEW BREAKDOWN !Hello Traders !
The GBPUSD broke the support level (1.34037 - 1.33650).
This key level becomes new resistance!
So, I expect a bearish move📉
_______________
TARGET: 1.32710🎯
GBPUSD → Retest of previously broken resistance...FX:GBPUSD has entered a correction phase after breaking through the local downtrend. If the price remains in the 1.3450–1.346 zone, this will confirm the formation of a new trading range...
The market is entering a correction phase due to the dollar. A countertrend retest of the support zone i

GBP/USD 4H Bullish Reversal Setup Analysis:The chart shows GBP/USD breaking out of a descending channel, signaling a potential bullish reversal.
Price has bounced from a strong support zone (highlighted in yellow), with bullish momentum building.
The breakout is backed by a higher low structure, which often precedes an uptrend continuation
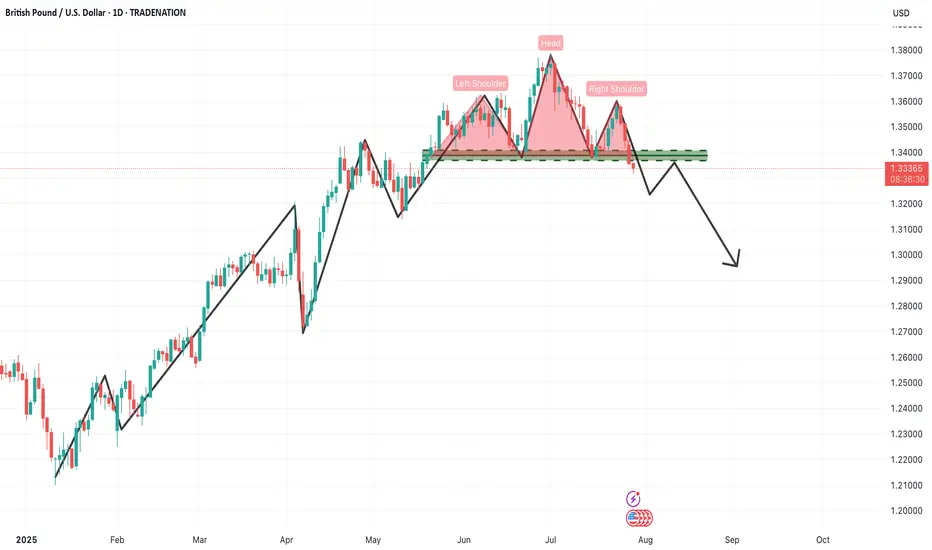
GBPUSD – Daily Timeframe Analysis: Head & Shoulders PatternThe GBPUSD daily chart is currently presenting a textbook Head & Shoulders reversal pattern, a powerful bearish signal that often marks the end of an uptrend and the beginning of a new downward cycle. This setup demands attention from swing and positional traders alike, especially considering the si
See all ideas
Summarizing what the indicators are suggesting.
Oscillators
Neutral
SellBuy
Strong sellStrong buy
Strong sellSellNeutralBuyStrong buy
Oscillators
Neutral
SellBuy
Strong sellStrong buy
Strong sellSellNeutralBuyStrong buy
Summary
Neutral
SellBuy
Strong sellStrong buy
Strong sellSellNeutralBuyStrong buy
Summary
Neutral
SellBuy
Strong sellStrong buy
Strong sellSellNeutralBuyStrong buy
Summary
Neutral
SellBuy
Strong sellStrong buy
Strong sellSellNeutralBuyStrong buy
Moving Averages
Neutral
SellBuy
Strong sellStrong buy
Strong sellSellNeutralBuyStrong buy
Moving Averages
Neutral
SellBuy
Strong sellStrong buy
Strong sellSellNeutralBuyStrong buy
Displays a symbol's price movements over previous years to identify recurring trends.
Frequently Asked Questions
The current rate of USDGBP is 0.75441 GBP — it has increased by 0.58% in the past 24 hours. See more of USDGBP rate dynamics on the detailed chart.
The value of the USDGBP pair is quoted as 1 USD per x GBP. For example, if the pair is trading at 1.50, it means it takes 1.5 GBP to buy 1 USD.
The term volatility describes the risk related to the changes in an asset's value. USDGBP has the volatility rating of 0.33%. Track all currencies' changes with our live Forex Heatmap and prepare for markets volatility.
The USDGBP showed a 1.91% rise over the past week, the month change is a 3.36% rise, and over the last year it has decreased by −3.18%. Track live rate changes on the USDGBP chart.
Learn how you can make money on rate changes in numerous trading ideas created by our community.
Learn how you can make money on rate changes in numerous trading ideas created by our community.
USDGBP is a major currency pair, i.e. a popular currency paired with USD.
Currencies are usually traded through forex brokers — choose the one that suits your needs and go ahead. You can trade USDGBP right from TradingView charts — just log in to you broker account. Check out the list of our integrated brokers and find the best one for your needs and strategy.
When deciding to buy or sell currency one should keep in mind many factors including current geopolitical situation, interest rates, and other. But before plunging into a deep research, you can start with USDGBP technical analysis. The technical rating for the pair is buy today, but don't forget that markets can be very unstable, so don't stop here. According to our 1 week rating the USDGBP shows the neutral signal, and 1 month rating is sell. See more of USDGBP technicals for a more comprehensive analysis.