GBP/USD Robbery: Can You Grab the Cash Before the Cops Arrive?🚨 GBP/USD "The Cable" forex bank Heist Alert: The Bullish Breakout Robbery Plan (Swing & Scalp Strategy) 🚨
🌟 Hi! Hola! Ola! Bonjour! Hallo! Marhaba! 🌟
Attention Money Makers & Market Robbers! 🤑💰💸
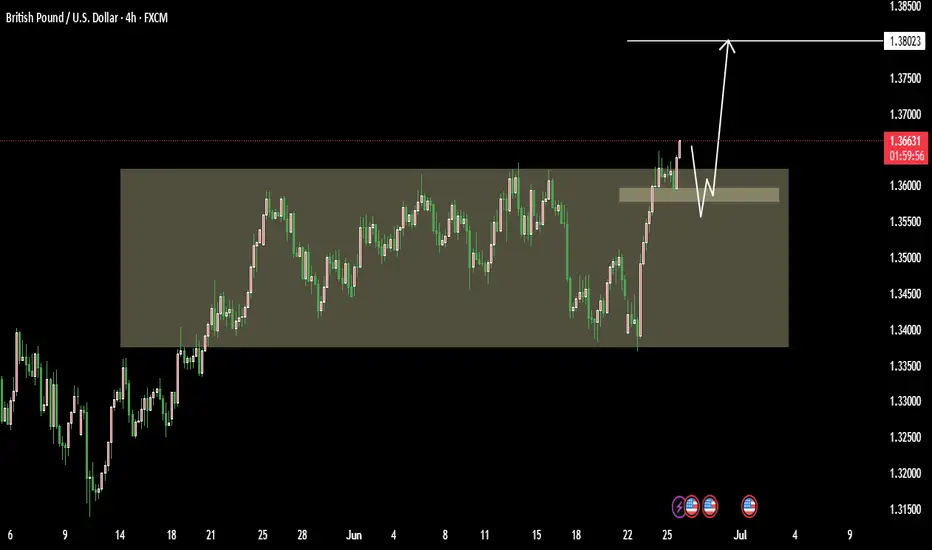
Based on the 🔥Thief Trading Style🔥, here’s our master plan to loot the GBP/USD "The Cable" forex bank. Follow the strategy on the chart—focusing on LONG entries—and escape near the high-risk Red Zone. This area is overbought, consolidating, and a potential reversal trap where bears lurk. 🏆 Take profits fast—you’ve earned it! 💪
🎯 Heist Entries:
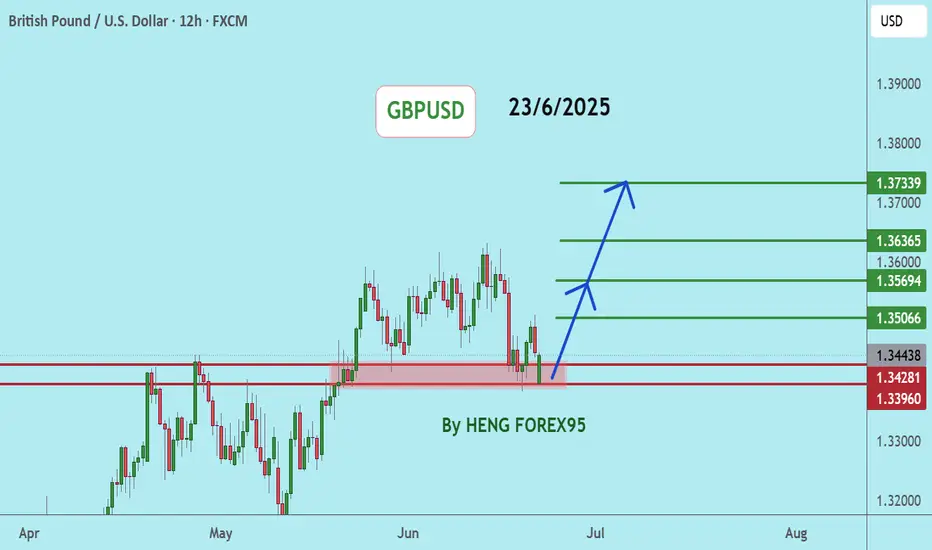
📈 Entry 1: "The Breakout Heist!" – Wait for Resistance (1.36200) to break, then strike! Bullish profits await.
📈 Entry 2: "Big Players’ Pullback!" – Jump in at 1.34000+ buy above at any price for a safer steal.
🔔 Pro Tip: Set a chart alert to catch the breakout instantly!
🛑 Stop Loss Rules:
*"Yo, listen! 🗣️ If you’re entering with a buy-stop, DON’T set your SL until AFTER the breakout. Place it at the nearest swing low (3H timeframe) or wherever your risk allows—but remember, rebels risk more! 🔥"*
🏴☠️ Target: 1.37500
🧲 Scalpers: Only play LONG! Use trailing SL to lock in profits. Big wallets? Go all in. Small stacks? Join the swing heist!
📊 Market Pulse:
The GBP/USD "The Cable" is neutral but primed for bullish momentum. Watch:
Fundamentals (COT, Macro, Geopolitics)
Sentiment & Intermarket Trends
Positioning & Future Targets & Overall score
📌 Check our bioo linkks for deep analysis! 🔗🌍
⚠️ Trading Alert:
News = Volatility! Protect your loot:
Avoid new trades during major news
Use trailing stops to secure profits
💥 Boost This Heist!
Hit 👍 & 🔄 to strengthen our robbery crew! Let’s dominate the market daily with the Thief Trading Style. 🚀💵
Stay tuned—another heist drops soon! 🎯🐱👤
USDGBP trade ideas

GBPUSDGBPUSD price is near the support zone 1.33917. If the price cannot break through 1.33917, it is expected that the price will have a chance to bounce back. Consider buying in the red zone.
🔥Trading futures, forex, CFDs and stocks carries a risk of loss.
Please consider carefully whether such trading is suitable for you.
>>GooD Luck 😊
❤️ Like and subscribe to never miss a new idea!
GBPUSD Will Move Lower! Short!
Please, check our technical outlook for GBPUSD.
Time Frame: 12h
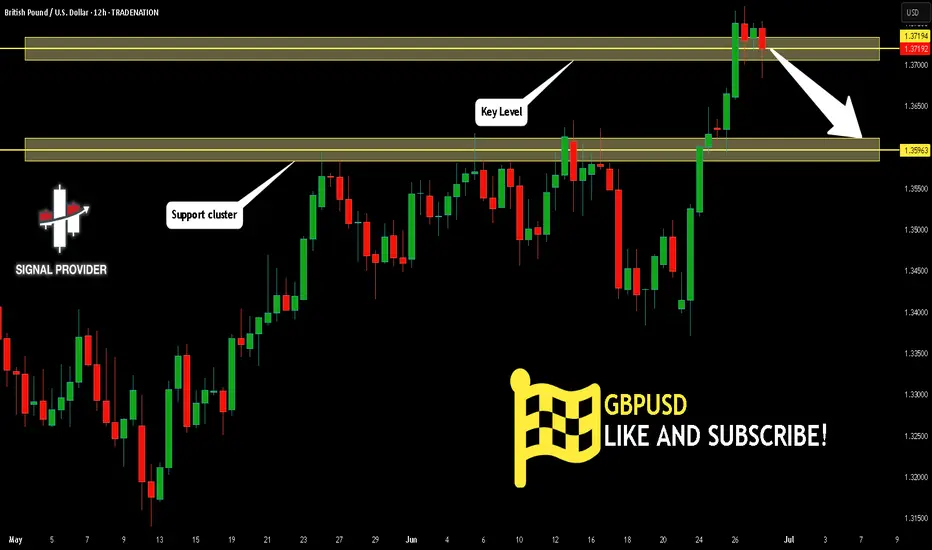
Current Trend: Bearish
Sentiment: Overbought (based on 7-period RSI)
Forecast: Bearish
The market is approaching a key horizontal level 1.371.
Considering the today's price action, probabilities will be high to see a movement to 1.359.
P.S
We determine oversold/overbought condition with RSI indicator.
When it drops below 30 - the market is considered to be oversold.
When it bounces above 70 - the market is considered to be overbought.
Disclosure: I am part of Trade Nation's Influencer program and receive a monthly fee for using their TradingView charts in my analysis.
Like and subscribe and comment my ideas if you enjoy them!
GBPUSD SCENARIo 26/06/2025English : According to our analysis, we anticipate a bearish scenario.
Morocan Darija : kanchofo d'apres l'analyse dyalna antsanaw hboot
ATENTION : I only share my ideas, not signals

GBPUSD Selling From Bearish Order Block At 1.36200GBPUSD Technical Breakdown
Timeframe: 1H
Price has officially broken out of the descending channel and is now reacting from the bearish Order Block around 1.36200. We're looking for short opportunities as momentum shifts.
🎯 Bearish Targets:
🔻 1st Target: 1.35500 – Key Demand Zone
🔻 2nd Target: 1.34700 – Deeper Demand Zone
🔻 3rd Target: 1.34000 – Bullish Order Block
📉 Setup looks clean – watching PA confirmation on each level.
👇 Like, follow, comment, and join us for more updates & smart trade setups.
Trade smart. Trade safe. 💼✨
— Livia 😜

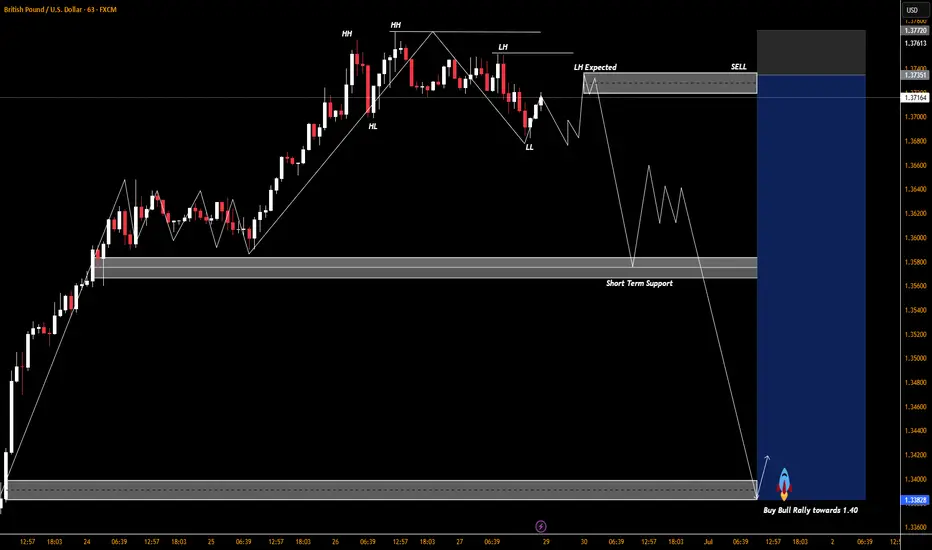
GBPUSD SOLID BEARISH OR CONTINUATION OF UPTREND ? A strong bullish trend, marked by a series of higher highs and higher lows. Price hits resistance around 1.37800 and fails to break higher. After that a range/consolidation forming with small candles between 1.37000 – 1.37800. Sellers start stepping in, and momentum shows weakens of the trend. Neutral to slightly bullish in the very short term due to the latest recovery ,
Resistance: 1.37400 and 1.37800 (need a break above this for bullish continuation).

Bullish Bias Holds for GBP/USD – Focus on 1.37500 BreakHi everyone,
A strong push up from our highlighted support level at 1.33800 toward 1.36850 saw GBP/USD enter a brief period of consolidation. During the week, price action ranged between this newly established support and the 1.37500 resistance level.
Looking ahead, we anticipate a decisive break above 1.37500, which could open the way for further upside.
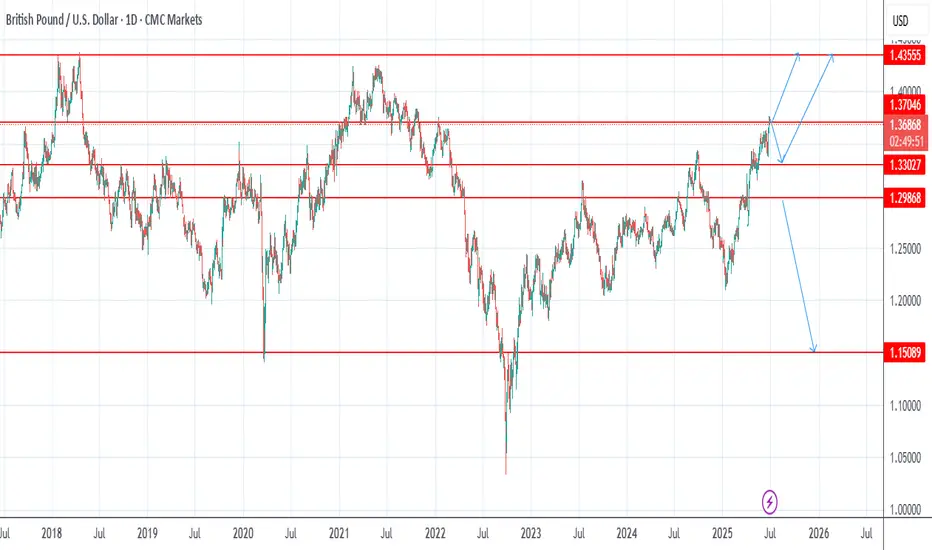
As previously noted, the clearance of these levels strengthens our expectation for further upside, with the next key level of interest around 1.38400. We'll be watching to see how price action develops from here.
We’ll continue to provide updates on the projected path for GBP/USD as price approaches this target.
The longer-term outlook remains bullish, and we expect the rally to continue extending further from the 1.20991 January low towards 1.40000 and 1.417000.
We’ll be keeping you updated throughout the week with how we’re managing our active ideas. Thanks again for all the likes/boosts, comments and follows — we appreciate the support!
All the best for the week ahead. Trade safe.
BluetonaFX

GBPUSD GBPUSD has completed its bullish leg, reaching our previously identified target zone.
Current price action indicates potential exhaustion, and we are now actively monitoring for a short setup, targeting the 1.37200 level, which aligns with a minor inefficiency and previous structural support turned resistance.
This move is supported by overextended intraday momentum on the 15-minute chart, along with bearish divergence forming against key price levels — suggesting a potential retracement phase.
Risk Management Strategy:
Entry: Upon confirmation of a bearish setup (e.g., rejection from a lower high or failure to break recent highs with strength).
Stop-Loss: Placed above the most recent swing high or invalidation level, ensuring protection against false breakouts.
Target: 1.37200, offering a favorable risk-to-reward ratio of at least 1:2.
We’ll continue to monitor price behavior closely and adjust if momentum shifts or invalidation levels are breached.

GBPUSD Boke trend line and retesting Recently GBPUSD is Trending upwards and now booke the trendline and is likely to go down now.
Super Sell!Hello all. as you see market reaches to an LOZ and it needs a historical low. As DXY will increasing, it it will falling. Effect of tariff started. be happy and have a super great week(wink)

GBPUSD → Pre-breakout consolidation. One step away from a rallyFX:GBPUSD is trading in consolidation. Against the backdrop of the falling dollar index, the currency pair is testing resistance at 1.3632 but is not yet ready to bounce down.
Against the backdrop of the dollar's decline due to fundamental reasons, the GBPUSD currency pair is strengthening. Technically, this could lead to the price breaking out of consolidation upwards. A pre-breakout base is forming relative to the upper boundary of consolidation. The price is compressing towards the level, volatility is decreasing, which in general could lead to a breakout of resistance - trigger 1.3632. The exit from consolidation may be accompanied by distribution. The liquidity zone with W1 can be considered as a target.
Resistance levels: 1.3632, 1.3743
Support levels: 1.3593, 1.3508
The global and local trends are bullish. After growth, consolidation is forming. Against the backdrop of the falling dollar, GBPUSD is testing resistance. The reaction to the false breakout of resistance is weak. The chances of a breakout are quite high.
Best regards, R. Linda!

GBPUSD Potential UpsidesHey Traders, in today's trading session we are monitoring GBPUSD for a buying opportunity around 1.37000 zone, GBPUSD is trading in an uptrend and currently is in a correction phase in which it is approaching the trend at 1.37000 support and resistance area.
Trade safe, Joe.

GBP/USD KILLEDGBP/USD milked using smart money concepts. us as displined traders we are patient we follow the rules of our trade setups harlemz fx

GBPUSD SHORT GBP/USD looks overextended and rejecting the 1.3750 level. At the same time, DXY is bouncing from the 97.00 support. This could suggest a possible pullback in GBP/USD.

GBPUSD Could Highly Step to MoonGBPUSD is showing strong potential for a bullish breakout, supported by the ongoing decline in the US Dollar Index. If current momentum holds, the pair could test the 1.3820 resistance level in the coming sessions.
📉 Dollar Weakness as Key Driver
The fundamental backdrop favours the British pound as the US dollar continues to weaken, influenced by: Trade wisely best of luck Buddies.
Ps Support with like and comments for more analysis Thanks.
GBPUSD: Not giving a clear direction Lets wait till Mon and Tue before taking action.........either to continue our up trend or not......
Market next move ⚠️ Disruption & Counterpoints:
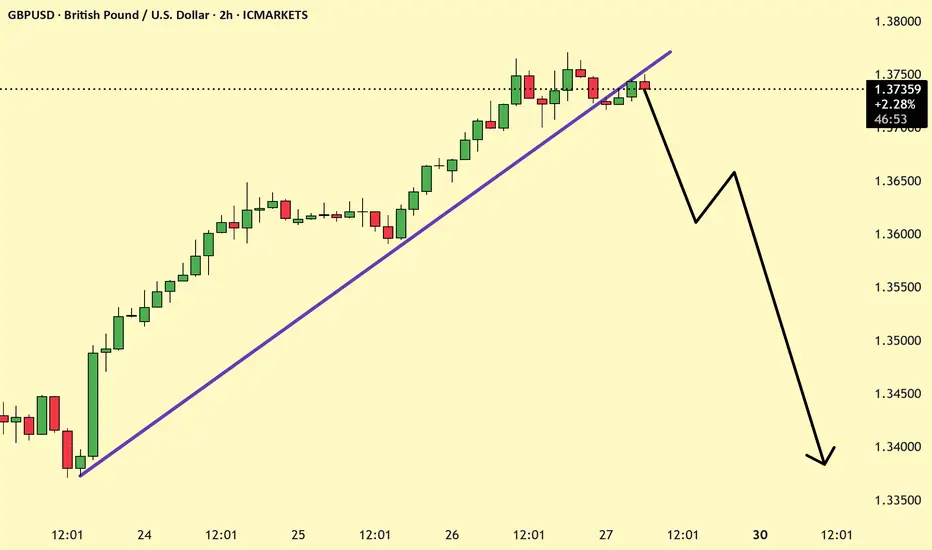
1. Labeling Error – "Bullish" in a Bearish Trend:
The chart clearly shows a strong downtrend starting after the peak on June 28.
Despite this, the word "Bullish" is used alongside a downward zigzag, which is misleading. This is not a bullish structure — it's a bearish continuation pattern or possibly a bear flag, which suggests further downside.
Using “Bullish” here may confuse traders into thinking a reversal is expected, while the actual trend favors further decline.
2. No Confirmed Reversal Pattern:
There's no double bottom, inverse head and shoulders, or any bullish candlestick formation (e.g., engulfing or hammer) to indicate a likely bullish reversal.
Without strong reversal signals, expecting a bullish move here lacks technical support.
3. Target Box Ambiguity:
The “Target” box is not clearly justified. There are no Fibonacci levels, previous support zones, or measured move explanations backing it.
A target should be based on a technical level — such as the bottom of a previous range, a support zone, or a projection from a pattern.

GBPUSD Sell analysis/ideaThis trade is based on the daily and 4-hour timeframes and executed using reversal trading and trend formation. Full explanation in the video!

GBPUSD | 26.06.2025SELL 1.37400 | STOP 1.38200 | TAKE 1.36400 | After consolidation around the medium-term highs, a corrective downward movement is likely and price consolidation under the level of 1.37000.

GBPUSD: Short Signal with Entry/SL/TP
GBPUSD
- Classic bearish pattern
- Our team expects retracement
SUGGESTED TRADE:
Swing Trade
Sell GBPUSD
Entry - 1.3710
Stop - 1.3765
Take - 1.3604
Our Risk - 1%
Start protection of your profits from lower levels
Disclosure: I am part of Trade Nation's Influencer program and receive a monthly fee for using their TradingView charts in my analysis.
❤️ Please, support our work with like & comment! ❤️

GU Bearish Friday ForecastHi everyone, hope we've all had a good week.
Here is my forecast for GBPUSD for today. After a fairly bullish week, I'm expecting some bearish price action to give us that top wick on the weekly candle close.
I'm looking at 2 price points, a pivot from 1.375 towards key level 1.37.
I'll post an update at the end of the day on how price ended up unfolding.
Regards,
Aman | SMC Wolf FX
1-1 student onboarding is currently open (website in my signature & profile)

GU-Fri-27/06/25 TDA-Good resistance area 1.37500, PCE news laterAnalysis done directly on the chart
Follow for more, possible live trades update!
I often share my live trades in Tradingview public chat in London session, stay tuned!
Have priorities in your life.
What are the things that you consider to be top
before anything else?
Do you consider trading as top priority?
When facing doubts and insecurities, if you have
set a list of priorities, you'll likely to be more
oriented and not get lost easily shifting your focus
with your own top priorities.
Active in London session!
Not financial advice, DYOR.
Market Flow Strategy
Mister Y
