GBP/USD Robbery: Can You Grab the Cash Before the Cops Arrive?🚨 GBP/USD "The Cable" forex bank Heist Alert: The Bullish Breakout Robbery Plan (Swing & Scalp Strategy) 🚨
🌟 Hi! Hola! Ola! Bonjour! Hallo! Marhaba! 🌟
Attention Money Makers & Market Robbers! 🤑💰💸
Based on the 🔥Thief Trading Style🔥, here’s our master plan to loot the GBP/USD "The Cable" forex bank. Follow the strategy on the chart—focusing on LONG entries—and escape near the high-risk Red Zone. This area is overbought, consolidating, and a potential reversal trap where bears lurk. 🏆 Take profits fast—you’ve earned it! 💪
🎯 Heist Entries:
📈 Entry 1: "The Breakout Heist!" – Wait for Resistance (1.36200) to break, then strike! Bullish profits await.
📈 Entry 2: "Big Players’ Pullback!" – Jump in at 1.34000+ buy above at any price for a safer steal.
🔔 Pro Tip: Set a chart alert to catch the breakout instantly!
🛑 Stop Loss Rules:
*"Yo, listen! 🗣️ If you’re entering with a buy-stop, DON’T set your SL until AFTER the breakout. Place it at the nearest swing low (3H timeframe) or wherever your risk allows—but remember, rebels risk more! 🔥"*
🏴☠️ Target: 1.37500
🧲 Scalpers: Only play LONG! Use trailing SL to lock in profits. Big wallets? Go all in. Small stacks? Join the swing heist!
📊 Market Pulse:
The GBP/USD "The Cable" is neutral but primed for bullish momentum. Watch:
Fundamentals (COT, Macro, Geopolitics)
Sentiment & Intermarket Trends
Positioning & Future Targets & Overall score
📌 Check our bioo linkks for deep analysis! 🔗🌍
⚠️ Trading Alert:
News = Volatility! Protect your loot:
Avoid new trades during major news
Use trailing stops to secure profits
💥 Boost This Heist!
Hit 👍 & 🔄 to strengthen our robbery crew! Let’s dominate the market daily with the Thief Trading Style. 🚀💵
Stay tuned—another heist drops soon! 🎯🐱👤
USDGBP trade ideas

GBPUSD Daily Timeframe Analysis – Bullish Continuation SetupTechnical Analysis:
On the daily timeframe, GBPUSD maintains a bullish bias in the long term.
During the previous week, price action formed an impulsive bullish leg, confirming continued demand and momentum to the upside.
Currently, I expect a retracement to a key support zone (previous resistance), which is marked on the chart (red rectangle)
This zone could act as a potential entry point for buyers targeting higher levels.
A short-term retracement is expected toward the highlighted zone (red rectangle).
---
📌 Trade Plan:
Entry Zone: 1.35900 – 1.36100
Take Profit (TP): 1.37500
Stop Loss (SL): 1.35250
---
🔎 Outlook Summary:
This setup aligns with the broader trend, and I’ll be watching price reaction at the retracement zone closely. A bullish confirmation (like a bullish engulfing candle or pin bar) could validate the entry.
📌 Conclusion
I’ll be watching the retracement closely for confirmation before entering. A bullish candlestick setup in this area will strengthen the bullish continuation outlook.

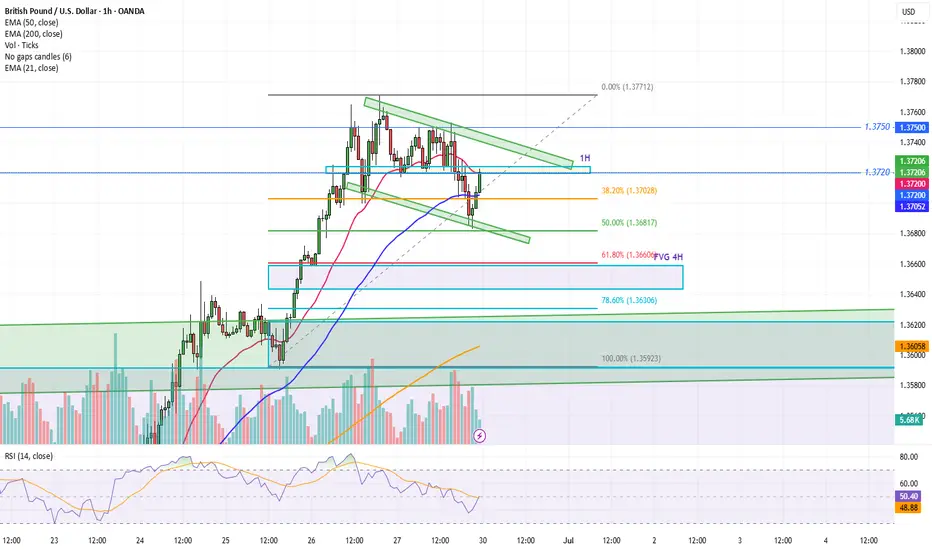
GBPUSD Trend IdeaThe Daily timeframe shows a strong engulfing bullish candle, indicating a bullish trend in building up.
at 1Hr timeframe, a bullish flag formation is creating a retracement, possibly till 50/61.8% Fib level, before breaking the flag and continue up.
Let's look at these AOIs and check for a candle confirmation to take long trade.
Good Luck!
GU Friday Bearish ReviewHi everyone,
GBP/USD played out exactly as per forecast (link below if you'd like to revisit):
It was fairly simple price action to forecast, price sweeped 1.375 initially, taking out the Asian highs and the similar equal highs (liquidity)
Before then creating its bearish leg towards the next liquidity zone of 1.37.
I was able to jump onto a few moves throughout both London & NY (have thrown in those screenshots onto the chart for you guys)
Regards,
Aman | SMC Wolf FX
1-1 student onboarding is currently open (website in my signature & profile)
Gbpusd Daily_TF Analysis within the bearish flag GBP/USD Daily Timeframe Analysis
1. The price is still trading within a bearish flag pattern on the daily chart.
2.Currently, the price is in a significant high on the higher timeframe.
3. There has been a recent breakout of resistance on the Daily Timeframe.
4. The breakout occurred at the same spot as the trendline breakout.
Expectation: We can anticipate a potential move to the downside for a retest of the previous resistance breakout level and the broken trendline. After a successful retest, the overall bullish trend may continue.

Fundamental Market Analysis for June 27, 2025 GBPUSDThe GBP/USD pair held positive momentum near 1.3735 during Asian trading on Friday.
Concerns over the Fed's future independence continue to undermine the US Dollar and create a tailwind for the major pair. U.S. President Donald Trump's announcement that he is considering selecting the next Fed chairman ahead of schedule, which has spurred fresh controversy over U.S. rate cuts. Trump said the list of potential successors to Powell had shrunk to “three or four people”, without naming any finalists.
In addition, weaker-than-expected US gross domestic product (GDP) data also sent the dollar lower. The U.S. economy contracted faster than expected in the first three months of this year, falling 0.5%, the U.S. Bureau of Economic Analysis (BEA) reported on Thursday. The figure was below the previous estimate and the market consensus of -0.2%.
Bank of England Governor Andrew Bailey warned earlier this week that interest rates are likely to continue to fall. At its June meeting, the UK central bank left interest rates unchanged at 4.25%, although three of the nine members of the Monetary Policy Committee (MPC) voted to cut interest rates.
Trading recommendation: BUY 1.3750, SL 1.3690, TP 1.3865

Possible GBPUSD LONG TradeTargeting bullish imbalance Order block for a long trade.
Expecting a sweep of the 4H CRT, then a reaction from the bullish order block.

GBPUSD Bullish SetupGBPUSD is currently bullish and printing a HH so we can take an instant buy entry by making last HL as SL, TP is also mentioned

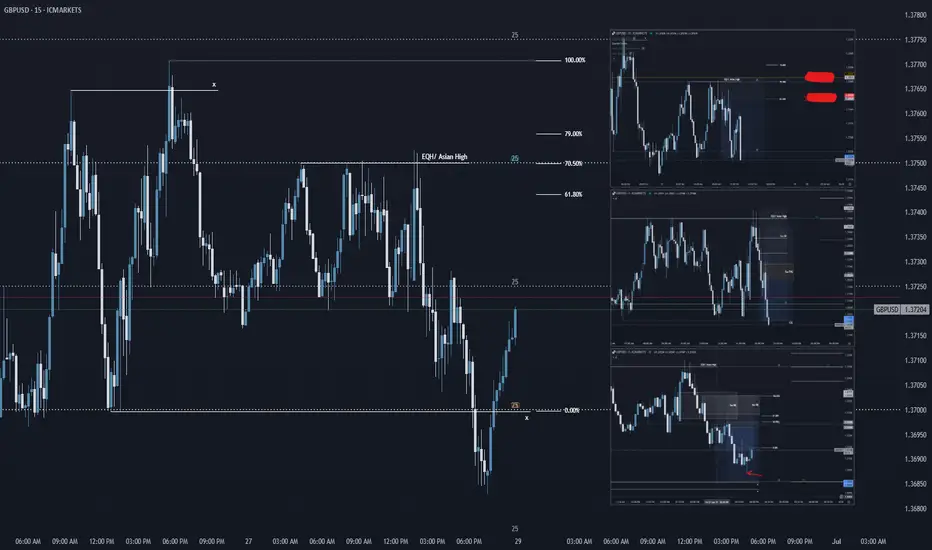
GBPUSD GBPUSD has completed its bullish leg, reaching our previously identified target zone.
Current price action indicates potential exhaustion, and we are now actively monitoring for a short setup, targeting the 1.37200 level, which aligns with a minor inefficiency and previous structural support turned resistance.
This move is supported by overextended intraday momentum on the 15-minute chart, along with bearish divergence forming against key price levels — suggesting a potential retracement phase.
Risk Management Strategy:
Entry: Upon confirmation of a bearish setup (e.g., rejection from a lower high or failure to break recent highs with strength).
Stop-Loss: Placed above the most recent swing high or invalidation level, ensuring protection against false breakouts.
Target: 1.37200, offering a favorable risk-to-reward ratio of at least 1:2.
We’ll continue to monitor price behavior closely and adjust if momentum shifts or invalidation levels are breached.

Market next target 🔁 Disruption of the Current Bullish Analysis
1. Resistance Rejection Likelihood
The chart suggests a breakout above resistance will turn the red box into support.
Disruption: The price is currently at a key resistance zone, and multiple rejections in this area previously suggest selling pressure.
We could see a double top formation or a false breakout trapping bulls.
Look for wicks or long upper shadows indicating weakness.
2. Volume Divergence
Recent bullish candles show declining or inconsistent volume.
Disruption: A strong bullish breakout requires rising volume. If volume doesn't confirm price action, this move may lack conviction and reverse sharply.
3. Overbought Conditions
After a strong uptrend, RSI or Stochastic indicators (not shown, but implied) could be entering overbought territory.
Disruption: This suggests limited upside and a potential for mean reversion or correction.
4. Bearish Candlestick Pattern Watch
Watch closely for a bearish engulfing, shooting star, or evening star at this resistance zone.
Disruption: Any bearish reversal pattern here would strongly contradict the bullish breakout thesis.

GBP/USD Surges to Three-Year Highs- PCE on tapSterling held slope resistance for more than three-weeks with a defense of support this week attempting to mark an outside-weekly reversal candle. The advance is testing resistance today at the 2022 swing high near 1.3749 and the focus is on the weekly close with respect to this pivot zone.
Initial weekly support now rests with the June opening-range highs near 1.3633 and is backed by the 78.6 % retracement of the 2021 decline at 1.3414. Broader bullish invalidation now raised to the April high-week close (HWC) at 1.3270- losses below this threshold would suggest a more significant high is in place / a larger reversal is underway towards the 2023 HWC at 1.3092.
A breach / weekly close above 1.3749 is needed to keep the immediate advance viable with subsequent resistance objectives eyed at the 61.8% extension of the 2022 advance at 1.4003 and the 2021 HWC at 1.4158- both levels of interest for possible topside exhaustion / price inflection IF reached.
Bottom line: A breakout of the monthly opening-range takes GBP/USD into initial resistance at the 2022 swing highs with weekly momentum pressing into overbought territory today. From at trading standpoint, a good zone to reduce portions of long-exposure / raise protective stops- losses would need to be limited to 1.3632 IF price is heading higher on this stretch with a close above 1.3749 needed to mark uptrend resumption.
-MB

GBP USD LONDON BREAKOUT as it was a war going on in my country iran i couldnt post till today ... this was the trade that i initiated eraly today fortunatly it hit the profit .. i try to analyse june at the end and post a sepreate analyse on lodon breakout strategy for now . be safe love you all from iran

Short #GBPUSD at 1.37489🚨 Shorting #GBPUSD at 1.37489 🚨
This is a financial freedom short. We're in the last quarter of the year, and it's time to move with precision. Every candle forms with the high, low, open, and close—the yearly candle is no exception. The endgame is near. 💼📉
#ForexTrading #FXMarket #YearlyCandle #ShortTrade #PipHunting #Q4Trading #GBPUSD #FinancialFreedom #TradingStrategy #MarketTrends #RiskManagement #ForexAnalysis

Riding the Wave or Facing a Pullback? Key Levels to WatchGBPUSD: Riding the Wave or Facing a Pullback? Key Levels to Watch!
Hello TradingView Community!
The GBPUSD pair is currently under the spotlight, experiencing significant movements driven by a mix of market sentiment and economic indicators.
🌍 Fundamental Snapshot: GBP's Lift vs. Underlying Pressures
The British Pound has seen a notable surge, climbing near 1.3765 against the US Dollar. This uplift is primarily fueled by market hopes for an imminent announcement of Fed Chair Powell's successor by President Trump, hinting at potential future dovish shifts in Fed policy. Such speculation could dampen USD's strength, benefiting GBPUSD.
However, the outlook isn't entirely clear-cut for the Pound. Fed Chair Powell has cautioned that tariff-induced inflation might prove persistent, adding a layer of complexity to the broader USD sentiment. Domestically, UK employers are reportedly planning workforce reductions to offset rising social security contributions, which could weigh on the GBP.
In essence, GBPUSD is benefiting from potential USD weakness linked to Fed policy expectations, but traders should remain vigilant about internal economic pressures within the UK.
📊 GBPUSD Technical Analysis (H4/M30 Chart):
Our technical analysis of the GBPUSD chart (image_b6d4de.png) reveals a clear uptrend, marked by consistent higher highs and higher lows. The EMAs are also in a bullish alignment, reinforcing this upward momentum.
Key Resistance (Potential Sell Zone): We identify significant resistance at 1.38366. This level could attract selling pressure, suggesting a potential price reversal or consolidation after hitting this mark.
Key Support Levels (Potential Buy Zones):
Initial support lies at 1.36648.
A stronger support area is at 1.36158. These levels could act as bounce points after any corrective moves.
🎯 GBPUSD Trading Plan:
BUY Zone 1 (Near Current Support):
Entry: Consider entries around 1.36648.
SL: 1.36500 (just below support).
TP: Target incremental gains towards 1.36800, 1.37000, 1.37200, 1.37400, 1.37600, 1.37800, 1.38000, and potentially 1.38300 (just shy of major resistance).
BUY Zone 2 (Stronger Support):
Entry: Look for entries around 1.36158.
SL: 1.36000 (below strong support).
TP: Target incremental gains towards 1.36300, 1.36500, 1.36700, 1.37000, 1.37300, 1.37600, 1.38000, and 1.38300.
SELL Zone (At Resistance):
Entry: Consider short entries around 1.38366.
SL: 1.38500 (just above resistance).
TP: Target incremental declines towards 1.38200, 1.38000, 1.37800, 1.37500, 1.37200, 1.37000, 1.36800, and 1.36648 (targeting support).
⚠️ Key Factors to Monitor:
Fed Leadership News: Any official announcement regarding the Fed Chair succession will trigger significant USD volatility.
UK Economic Data: Upcoming reports on employment, inflation, and GDP will directly impact the Pound.
BoE Statements: Monetary policy stances from the Bank of England.
US Inflation/Employment Data: Continues to influence overall USD strength.
Trade wisely and always prioritize robust risk management! Wishing everyone a successful trading day!

GBPUSD INTRADAY sideways consolidation breakoutThe GBPUSD currency pair continues to exhibit a bullish price action bias, supported by a sustained rising trend. Recent intraday movement reflects a sideways consolidation breakout, suggesting potential continuation of the broader uptrend.
Key Technical Level: 1.3600
This level marks the prior consolidation range and now acts as pivotal support. A corrective pullback toward 1.3600 followed by a bullish rejection would reinforce the bullish trend, targeting the next resistance levels at:
1.3825 – Near-term resistance
1.3865 – Minor swing high
1.3900 – Longer-term bullish objective
On the other hand, a decisive daily close below 1.3600 would invalidate the bullish setup, shifting the outlook to bearish in the short term. This could trigger a deeper retracement toward:
1.3550 – Initial support
1.3500 – Key downside target
Conclusion:
As long as 1.3600 holds as support, the technical outlook remains bullish, favoring long positions on dips. A confirmed break below this level would signal a shift in sentiment and open the door to a corrective pullback phase.
This communication is for informational purposes only and should not be viewed as any form of recommendation as to a particular course of action or as investment advice. It is not intended as an offer or solicitation for the purchase or sale of any financial instrument or as an official confirmation of any transaction. Opinions, estimates and assumptions expressed herein are made as of the date of this communication and are subject to change without notice. This communication has been prepared based upon information, including market prices, data and other information, believed to be reliable; however, Trade Nation does not warrant its completeness or accuracy. All market prices and market data contained in or attached to this communication are indicative and subject to change without notice.

GBPUSD Hits Channel Highs – Watch for Exhaustion or BreakoutGBPUSD continues its impressive rally, tapping into the upper boundary of a clean ascending channel across the 1D and 4H timeframes.
🔹 Daily:
Structure remains bullish with price pressing into long-term channel resistance near 1.3765. This is a key inflection point — bulls may need fresh momentum to break above.
🔹 4H:
Sharp impulsive move has stretched to the upside channel line. RSI likely overextended. Look for signs of exhaustion or bearish divergence here.
🔹 1H / 23m:
Lower timeframes show aggressive bullish control, but price is stalling near the highs. If we break structure or reject this zone, we could see a correction toward 1.3660 or deeper.
📉 If rejection occurs here, short opportunities may present toward mid-range or trendline support.
📈 If we break and close above 1.3780 with volume, continuation toward 1.3850 becomes likely.
💡Key Levels:
• Resistance: 1.3780, 1.3850
• Support: 1.3660, 1.3600

The Day Ahead Economic Data Highlights (US & Europe):
A busy day for economic indicators, particularly out of the US.
Durable Goods Orders (May): Markets will watch for signs of resilience or weakness in US manufacturing, with core capital goods orders acting as a proxy for business investment.
Chicago Fed National Activity Index: Could offer a broader snapshot of US economic momentum ahead of the July FOMC.
Pending Home Sales: Will shed light on housing market trends amid fluctuating mortgage rates.
Advance Goods Trade Balance & Wholesale Inventories: These will feed into Q2 GDP tracking estimates.
Kansas City Fed Manufacturing Activity (June): Regional data may add color to the broader ISM picture.
Initial Jobless Claims: As always, a key gauge of labor market tightness.
Germany GfK Consumer Confidence (July): Expected to reflect persistent economic pessimism, weighing on EUR sentiment.
Central Bank Speakers:
A full slate of Fed, ECB, and BoE commentary may offer insight into diverging policy paths.
Fed’s Barkin, Hammack, and Barr could provide updates on inflation dynamics and balance sheet strategy.
ECB’s Schnabel and Guindos may hint at the pace of further policy easing amid eurozone stagnation.
BoE’s Governor Bailey and Deputy Governor Breeden speak following recent UK inflation and growth data, with focus on the rate outlook into Q3.
Corporate Earnings:
Nike (NKE): Focus will be on forward guidance and China recovery amid margin pressure and inventory management.
H&M: May offer cues on European consumer demand and retail sector performance.
Other Key Events:
European Council Summit (Brussels, through June 27): Leaders gather to discuss key policy areas including fiscal rules, Ukraine aid, and EU top jobs. Potential EUR sensitivity depending on political developments.
US 7-Year Note Auction: Watch for demand and yield levels, as Treasury issuance remains in focus amid deficit concerns.
This communication is for informational purposes only and should not be viewed as any form of recommendation as to a particular course of action or as investment advice. It is not intended as an offer or solicitation for the purchase or sale of any financial instrument or as an official confirmation of any transaction. Opinions, estimates and assumptions expressed herein are made as of the date of this communication and are subject to change without notice. This communication has been prepared based upon information, including market prices, data and other information, believed to be reliable; however, Trade Nation does not warrant its completeness or accuracy. All market prices and market data contained in or attached to this communication are indicative and subject to change without notice.

GBPUSD Wave Analysis – 25 June 2025- GBPUSD broke resistance level 1.3590
- Likely to rise to resistance level 1.3880
GBPUSD currency pair recently broke the resistance level 1.3590, which is the upper border of the narrow sideways price range inside which the price has been moving from May.
The breakout of the resistance level 1.3590 accelerated the active intermediate impulse wave (3).
Given the clear daily uptrend and the strong US dollar sales seen today, GBPUSD currency pair can be expected to rise to the next resistance level 1.3880.

GBPUSD GBPUSD is currently exhibiting short-term bearish momentum, targeting the fresh demand zone at 1.36416.
This level aligns with a key order block that could act as a pivot for the next bullish leg.
As long as price holds above this zone, we anticipate a potential bullish reversal from 1.36416 on the 15-minute timeframe. We’ll be monitoring for confirmation and continuation to the upside from that level.

GBPUSD | 24.06.2025SELL 1.35900 | STOP 1.36500 | TAKE 1.35000 | Price movement in the range of the medium-term ascending channel.

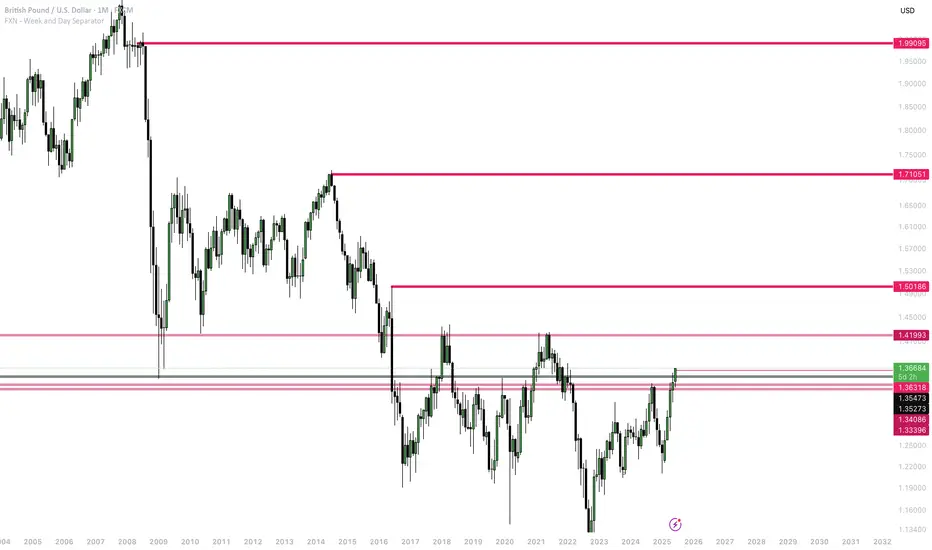
GBPUSD For A Long BuyDerived from the somewhat correlated nature of the EURUSD to the GBPUSD
Current level of resistance is 1.41993 (current buying objective)
Previous resistance 1.36318, now support. Price aiming for 1.41993.
Mid-term resistance level: 1.50186
Long-term resistance levels are 1.71051 and 1.99095
Mid-term and long-term levels will hold provided price breaks through the 1.41993 level, and the bullish bias remains the same.
GBP/USD Launch to Fresh 3-Year HighsGBP/USD had a mild pullback earlier in the morning until the 1.3593 level came in to help set the lows. I had looked at that price in yesterday's post and that's held the lows for today ahead of another strong breakout with the pair pressing into fresh three-year highs.
Chasing breakouts can be tough especially when they've already started, so at this point there's a couple of spots of support that bulls can defend to keep the door open for shorter-term trend continuation purposes.
The price of 1.3639 is an aggressive level of support potential, and below that is 1.3616. If bulls fail to hold support at those prices, the bullish momentum that's driving the current breakout would come into question and the door would open to deeper retracement potential. In that scenario, there may be more attractive options to work with USD-strength. - js

Short trade
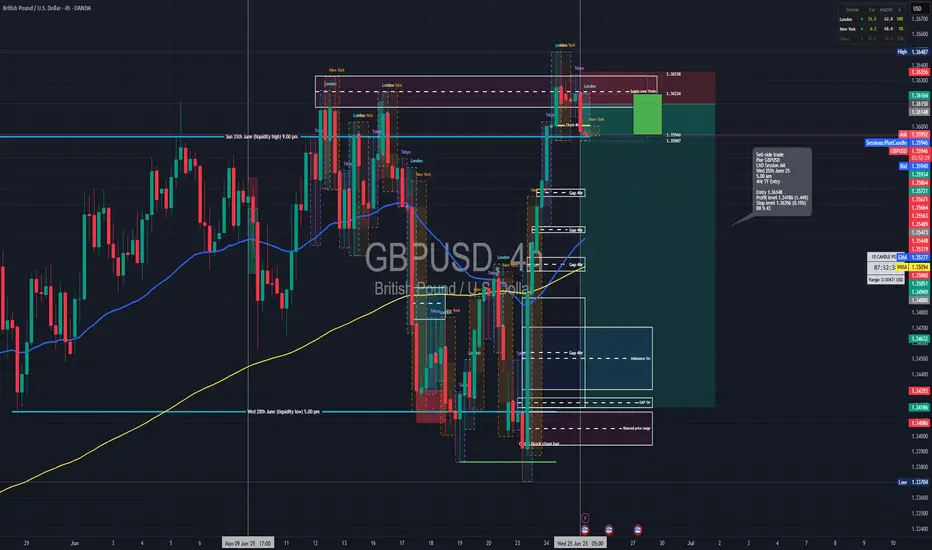
🔻 Trade Journal Entry – Sell-side Trade
📍 Pair: GBPUSD
📅 Date: Wednesday, June 25, 2025
🕒 Time: 5:00 AM (London Session AM)
⏱ Time Frame: 4 Hour
📉 Direction: Sell-side
📊 Trade Breakdown:
Metric Value
Entry Price 1.36148
Profit Level 1.34186 (−1.44%)
Stop Loss 1.36356 (+0.15%)
Risk-Reward
Ratio 9.43 : 1
🧠 Context / Trade Notes:
4HR OB Rejection in Premium Zone:
Entry taken off a confirmed bearish order block after price tapped into a premium zone at the top of the internal range.
London Session Liquidity Sweep:
Trade captured the classic London stop-hunt above a short-term high, initiating a sell-off and confirming smart money movement.