Waiting for Pullback at Green Support GBP/USD Forex Update – Waiting for Pullback at Green Support 📈
GBP/USD is currently in an uptrend. One option is to wait for a pullback to the green support zone level, where buyers could step in and push the price back up again. 📊
USDGBP trade ideas

High-Reward GBPUSD Setup: Entry 1.3598, TP 1.3867, SL 1.3478The GBP/USD pair has recently shown a clean bullish breakout from a short-term consolidation zone. Price has decisively moved above the 1.3478–1.3480 support-turned-resistance level, which previously acted as a ceiling within a rising channel. This breakout is meaningful—it comes after a retracement toward the lower boundary of the ascending structure, suggesting that buyers are once again gaining control.
The recent bullish candle has closed strong and full-bodied, indicating momentum. Historically, as you mentioned, GBPUSD tends to follow through for a few sessions once a bullish breakout begins. This is visible in prior moves throughout March and April, where an initial spike was often followed by two or three additional bullish candles. That behavior adds confluence to this setup.
Moreover, there is a clear path for price to move toward the long-term resistance near 1.3867, which aligns well with prior supply zones and the upper boundary of historical price reactions.
📈 Trade Idea
• Entry: 1.3598 (current price after breakout confirmation)
• Stop Loss: 1.3478 (just below the support flip and last swing low)
• Take Profit: 1.3867 (next major resistance level)
• Risk–Reward Ratio: ~2.24:1
This setup offers a clean bullish continuation pattern with room to run. If the pair maintains its current momentum, reaching the target in the next few trading days is entirely plausible. Any daily close above 1.3600 with volume would further validate the trend.

GBPUSD I H4 CLS I KL - DOB I Liquidity on TOPHey, Market Warriors, here is another outlook on this instrument
If you’ve been following me, you already know every setup you see is built around a CLS Footprint, a Key Level, Liquidity and a specific execution model.
If you haven't followed me yet, start now.
My trading system is completely mechanical — designed to remove emotions, opinions, and impulsive decisions. No messy diagonal lines. No random drawings. Just clarity, structure, and execution.
🧩 What is CLS?
CLS is real smart money — the combined power of major investment banks and central banks moving over 6.5 trillion dollars a day. Understanding their operations is key to markets.
✅ Understanding the behavior of CLS allows you to position yourself with the giants during the market manipulations — leading to buying lows and selling highs - cleaner entries, clearer exits, and consistent profits.
📍 Model 1
is right after the manipulation of the CLS candle when CIOD occurs, and we are targeting 50% of the CLS range. H4 CLS ranges supported by HTF go straight to the opposing range.
"Adapt what is useful, reject what is useless, and add what is specifically your own."
— David Perk aka Dave FX Hunter ⚔️
👍 Hit like if you find this analysis helpful, and don't hesitate to comment with your opinions, charts or any questions.

GBPUSD LONGS Price is forming higher highs and higher lows on the 15-minute timeframe, while 70% of retail traders remain positioned short

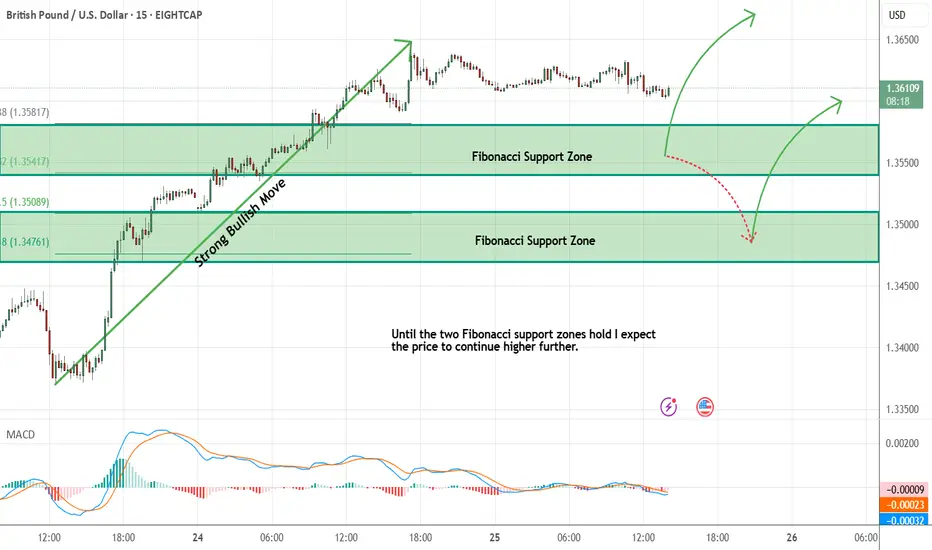
GBPUSD - Expecting Bullish Continuation In The Short TermM15 - Strong bullish momentum followed by a pullback.
No opposite signs.
Until the two Fibonacci support zones hold I expect the price to move higher further.
If you enjoy this idea, don’t forget to LIKE 👍, FOLLOW ✅, SHARE 🙌, and COMMENT ✍! Drop your thoughts and charts below to keep the discussion going. Your support helps keep this content free and reach more people! 🚀
--------------------------------------------------------------------------------------------------------------------
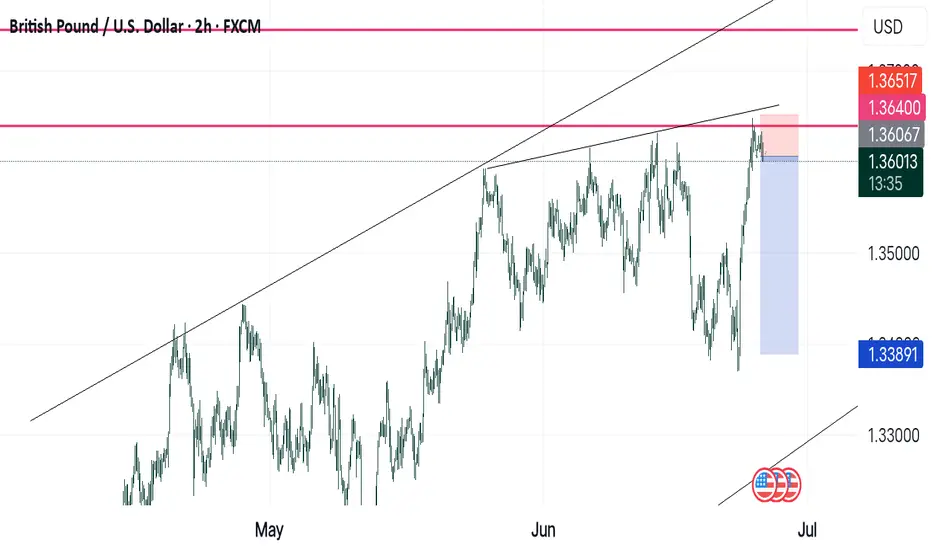
GBPUSD SHORTS Im shorting GBPUSD all the way down to at least 1.33900 or 1.34 flat cos price then just formes M formation on 1.36400 level on H2 timeframe which happened to be key area price respected in the past... DYOR
Four Ways to Improve Focus When Trading“Execution is everything.” It’s a phrase you’ll hear time and again in trading circles, and for good reason. Having a solid strategy is important, but it means very little if you can’t stay focused enough to follow through. One moment of hesitation, one distracted click, and the edge you worked so hard to find can vanish in an instant.
Focus is the gateway to execution. Without it, even the best setups fall apart. Yet in a world of constant noise with live charts, endless alerts, social media and background distractions it’s never been harder to stay present and in control. Here are four ways to improve your focus while trading. Two are grounded and practical. Two are a bit more unconventional. All of them can help you sharpen your focus where it really counts in the moment of decision.
1. Start with a Written Game Plan
This is the foundation. Before you even open your trading platform, write down your trade ideas, key levels, and any news or events that could impact your market. It doesn’t have to be elaborate. A simple list of “if this, then that” scenarios is enough.
By putting your plan on paper, you free up mental space and reduce emotional interference. You’re no longer reacting to every tick or candle. You’re tracking a few clear ideas and waiting for price to confirm your bias. That alone can dramatically improve focus. When your brain knows the plan, it doesn’t need to make it up on the fly.
More importantly, a written plan acts as an anchor when the session heats up. If you get shaken by a false breakout or tempted by something that wasn’t in your prep, it’s easy to refer back and reset. The best traders are those who execute simple ideas with discipline, not those who chase every signal that flashes across the screen.
2. Silence the Noise Around You
Multitasking is the enemy of trading. One browser tab for news, another for Twitter, five charts open, notifications popping up on your phone it all adds up to mental chaos.
Clean up your digital workspace before you start trading. Close all tabs that aren’t directly relevant to your session. Mute group chats. Set your phone to silent and put it face down, or better yet, in a drawer. Keep your trading screen as clean as possible. Use one or two key charts. Turn off indicators you don’t need.
If you trade in a noisy household or shared office space, noise-cancelling headphones can be a game changer. Some traders even use ambient sound apps like brain.fm or simple white noise to drown out distractions and stay locked in. A quiet mind is a focused mind.
3. Stand Up Before You Enter a Trade
Here’s something a little unorthodox, but surprisingly effective. Before you click the buy or sell button, physically stand up.
This small physical action creates a moment of separation between your thinking and your doing. It forces you to pause, breathe, and check in with yourself. Am I acting on plan or emotion? Is this trade aligned with my prep, or am I forcing it out of boredom?
We’ve all taken impulsive trades, only to regret them seconds later. Standing up adds a layer of intentionality. It breaks the rhythm of screen-staring and puts your brain back in the driver’s seat.
Think of it as your personal circuit breaker. It gives you a chance to double-check your logic and stops you from slipping into autopilot mode. Some traders even take it a step further and stretch or roll their shoulders before re-engaging with the screen. It might sound silly, but the effect on your mindset is real.
4. Use a ‘Focus Trigger’ to Prime Your Brain
Our brains love routines. You can use that to your advantage by building a simple ritual that tells your mind, “It’s time to trade.”
This doesn’t have to be anything elaborate. It might be playing a song you only use when trading or doing a brief breathing exercise. Some traders even use the act of cleaning their desk or making a fresh cup of coffee as a cue to shift into a focused state.
Over time, these small rituals become associated with mental readiness. They condition your brain to transition from passive scrolling or chatting into active concentration. That’s powerful, especially on days when you’re feeling a bit foggy or distracted.
The goal isn’t to create a superstition. It’s to build a reliable on-ramp into a focused headspace something that centres you and sets the tone for your session.
Disclaimer: This is for information and learning purposes only. The information provided does not constitute investment advice nor take into account the individual financial circumstances or objectives of any investor. Any information that may be provided relating to past performance is not a reliable indicator of future results or performance. Social media channels are not relevant for UK residents.
Spread bets and CFDs are complex instruments and come with a high risk of losing money rapidly due to leverage. 85.24% of retail investor accounts lose money when trading spread bets and CFDs with this provider. You should consider whether you understand how spread bets and CFDs work and whether you can afford to take the high risk of losing your money.

GBPUSD – Bullish Structure Holds, Waiting for a Clean RetestGBPUSD recently bounced strongly from the ascending trendline and hit resistance at 1.36300. The price is now slightly correcting, with a high probability of retesting the 1.35000 support zone – an area of FVG and technical confluence.
The bullish structure remains intact as long as price holds above this level. Positive UK Services PMI data further supports the medium-term uptrend.
Are you waiting for the pullback to jump in?

GBPUSD is in the Selling DirectionHello Traders
In This Chart GBPUSD HOURLY Forex Forecast By FOREX PLANET
today GBPUSD analysis 👆
🟢This Chart includes_ (GBPUSD market update)
🟢What is The Next Opportunity on GBPUSD Market
🟢how to Enter to the Valid Entry With Assurance Profit
This CHART is For Trader's that Want to Improve Their Technical Analysis Skills and Their Trading By Understanding How To Analyze The Market Using Multiple Timeframes and Understanding The Bigger Picture on the Charts

#GBPUSD #IDEA#GBPUSD #IDEA my idea on H1 looking for buy base on My Bias today but on friday we will trade scalping Buy

Risk Sentiment Improves, GBP/USD Nears 1.3650GBP/USD extended its rally for a third session, trading around 1.3620 and holding close to Tuesday’s high of 1.3648, its strongest level since February 2022. The pair continues to benefit from improved risk appetite as Middle East tensions ease following Trump’s announcement of a ceasefire between Iran and Israel.
Despite the initial increase, investors remain cautious as doubts persist over the ceasefire’s durability and potential nuclear negotiations with Iran. Focus is also on Iran’s enriched uranium stockpile, which continues to raise geopolitical concerns.
Meanwhile, Powell, in his congressional testimony, signaled that rate cuts are unlikely before Q4. He acknowledged that new tariffs could push inflation higher from June but maintained that the Fed is prepared to ease policy once conditions allow.
Resistance is seen at 1.3655, while support holds at 1.3540.

GBPUSD Price Action Analysis | Sell Setup Below 1.36106In this GBPUSD market overview, we break down recent price action following yesterday’s strong bullish rally from the momentum low. The session was highly emotional across major forex pairs, which is typical when a major wave structure reaches its end. This often results from incomplete auctions on one side of the market, causing order flow imbalances that drive sharp price movements.
The key price level we're watching on GBPUSD is 1.36326. Price approached this zone with momentum, and the rejection at 1.36267 triggered a classic TCP (Trend Changing Pattern), followed by a single upside break, confirming exhaustion at the highs.
📉 Sell Setup:
According to the Waves of Success execution model, the best short entry is below 1.36106, in alignment with the prevailing bearish structure.
⚠️ Alternative Scenario:
We are not looking for long setups on GBPUSD at this time — our bias remains bearish unless significant structure changes occur.
This analysis combines wave structure, trend confirmation patterns, and institutional price levels for a professional, risk-managed approach.
🔑 Key Levels:
Resistance: 1.36326
Rejection High: 1.36267
Sell Trigger: 1.36106

How I’m Planning My Next GBPUSD Trade Setup📉 GBPUSD Analysis Update
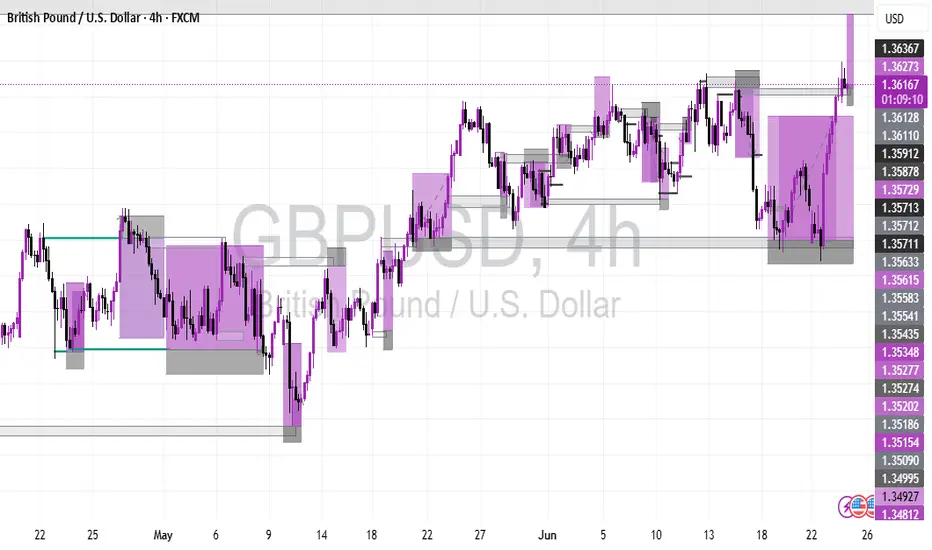
Currently keeping a close eye on GBPUSD 👀. On both the Daily and 4H charts, we’ve seen a strong bullish rally, driving price into a premium zone and tapping into key buy-side liquidity resting above previous highs 🔼💧.
The pair now appears overextended and is trading into a significant resistance level 🧱. Given this context, I’m anticipating a potential retracement. If we see a pullback followed by a clean bullish break in market structure, that’s when I’ll be looking to enter a long position 🎯📈.
⚠️ As always, this is not financial advice — just sharing my personal view of the markets.

GU-Wed-25/06/25 TDA-GU consolidating now!Analysis done directly on the chart
Follow for more, possible live trades update!
I often share my live trades in Tradingview public chat in London session, stay tuned!
Market is fractal, what happens in higher timeframe.
It repeats on lower timeframe but with more noise.
The lower timeframe we go the more technical
analysis is required as price in general is not
subjected to fundamental news as the higher
timeframe does. (Even though fundamental analysis,
is essential no matter what timeframe you trade)
Active in London session!
Not financial advice, DYOR.
Market Flow Strategy
Mister Y


GBPUSD SellDaily Cycle. Price should continue lower as a lot of liquidity as been built on the low. First TP is Asia low.

GBPUSD UPTRENDIn short words - Donald trump is crashing America Economy. I can see GBPUSD touching 1.40000 remember I said this!
^ is your fundements today.
Use technical charting to find your pricing. I found mine in this chart.

Bearish reversal off pullback resistance?The Cable (GBP/USD) is reacting off the pivot and could drop to the 1st support which is a pullback support.
Pivot: 1.3632
1st Support: 1.3533
1st Resistance: 1.2711
Risk Warning:
Trading Forex and CFDs carries a high level of risk to your capital and you should only trade with money you can afford to lose. Trading Forex and CFDs may not be suitable for all investors, so please ensure that you fully understand the risks involved and seek independent advice if necessary.
Disclaimer:
The above opinions given constitute general market commentary, and do not constitute the opinion or advice of IC Markets or any form of personal or investment advice.
Any opinions, news, research, analyses, prices, other information, or links to third-party sites contained on this website are provided on an "as-is" basis, are intended only to be informative, is not an advice nor a recommendation, nor research, or a record of our trading prices, or an offer of, or solicitation for a transaction in any financial instrument and thus should not be treated as such. The information provided does not involve any specific investment objectives, financial situation and needs of any specific person who may receive it. Please be aware, that past performance is not a reliable indicator of future performance and/or results. Past Performance or Forward-looking scenarios based upon the reasonable beliefs of the third-party provider are not a guarantee of future performance. Actual results may differ materially from those anticipated in forward-looking or past performance statements. IC Markets makes no representation or warranty and assumes no liability as to the accuracy or completeness of the information provided, nor any loss arising from any investment based on a recommendation, forecast or any information supplied by any third-party.

Nothing more beautiful than thisgbpusd has shown an uptrend for the past few months, did you get the picture?
gbpusdgbpusd short and long idea price has to come a retest the support zone and then continue to go up

GBP/USD Cable Launch from Fibo SupportThe Fibonacci level at 1.3414 has put in some work on GBP/USD over the past year. In Q3 of 2024 it held the highs over a two week period, leading into the sell-off in Q4. And then in April of this year, it once again held the highs, but this time, the pullback was brief and buyers were able to power through a month later.
And now, over the past two weeks, this has been support for the pair, coming into play after the FOMC rate decision last week and now leading to a push up to fresh multi-year highs.
The currently weekly candle is showing as a bullish engulf and this highlights a market that's tough to chase. But, shorter-term, there's higher-low support potential at both 1.3593 and 1.3500, which could function as support on shorter-term approaches in the pair. - js

Market next move ⚠️ Disruption Analysis of the Chart
1. False Breakout Risk
The price is currently within an ascending channel, which is often seen as bullish.
However, the recent candlesticks show smaller bodies with wicks on top, indicating buyer exhaustion.
A false breakout above the upper trendline or support around 1.3632 could trap buyers before a sharp reversal.
2. Low Volume Confirmation
Volume peaked earlier but has significantly decreased in the last few candles.
Weak volume during a price rise signals a lack of conviction, increasing the likelihood of a pullback.
3. Resistance Flip Not Confirmed
The level around 1.3600 is marked as resistance-turned-support, but there is no strong retest confirmation yet.
If price revisits this zone and fails to bounce, this support could break, leading to a downside reversal.
4. Divergence Watch
While not visible in this static image, if you overlay RSI or MACD, there could be signs of bearish divergence (price making higher highs while momentum indicators make lower highs).
This is often a leading indicator of trend weakening.

GBPUSD SHORT Market structure bearish on HTFs 3
Entry at Daily AOi
Weekly Rejection At AOi
Previous Weekly Structure Point
Daily Rejection At AOi
Previous Structure point Daily
Around Psychological Level 1.35000
H4 EMA retest
H4 Candlestick rejection
Rejection from Previous structure
Levels 4.52
Entry 110%
REMEMBER : Trading is a Game Of Probability
: Manage Your Risk
: Be Patient
: Every Moment Is Unique
: Rinse, Wash, Repeat!
: Christ is King.
