BUY GBPUSDFOMC moved the greenback positively yesterday by alot of pips, we anticipate a decent bullish move since price action touched an area of strong resistance basing on historical data.
USDGBP trade ideas

GBPUSDPresident Trump claims the war is over we will observe if this will make volatility stabilize, GU is aiming a Key level which might potentially create a new LL, lets see how it goes!

Bullish rise off pullback support?The Cable (GBP/USD) is falling towards the pivot which is a pullback support and could bounce to the 1st resistance.
Pivot: 1.3503
1st Support: 1.3455
1st Resistance: 1.3616
Risk Warning:
Trading Forex and CFDs carries a high level of risk to your capital and you should only trade with money you can afford to lose. Trading Forex and CFDs may not be suitable for all investors, so please ensure that you fully understand the risks involved and seek independent advice if necessary.
Disclaimer:
The above opinions given constitute general market commentary, and do not constitute the opinion or advice of IC Markets or any form of personal or investment advice.
Any opinions, news, research, analyses, prices, other information, or links to third-party sites contained on this website are provided on an "as-is" basis, are intended only to be informative, is not an advice nor a recommendation, nor research, or a record of our trading prices, or an offer of, or solicitation for a transaction in any financial instrument and thus should not be treated as such. The information provided does not involve any specific investment objectives, financial situation and needs of any specific person who may receive it. Please be aware, that past performance is not a reliable indicator of future performance and/or results. Past Performance or Forward-looking scenarios based upon the reasonable beliefs of the third-party provider are not a guarantee of future performance. Actual results may differ materially from those anticipated in forward-looking or past performance statements. IC Markets makes no representation or warranty and assumes no liability as to the accuracy or completeness of the information provided, nor any loss arising from any investment based on a recommendation, forecast or any information supplied by any third-party.

GBP USD LONG RESULT Price formed a falling closing wedge and then broke out holding Trendline and zones support, from where I took the long position and price moved even better than expected.
_THE_KLASSIC_TRADER_.

GBPUSD SHORTI'm seeing price come up towards the last point of supply I've got marked out so I'd like to see if the lower timeframes give me an entry to go as I do see some potential in this move.

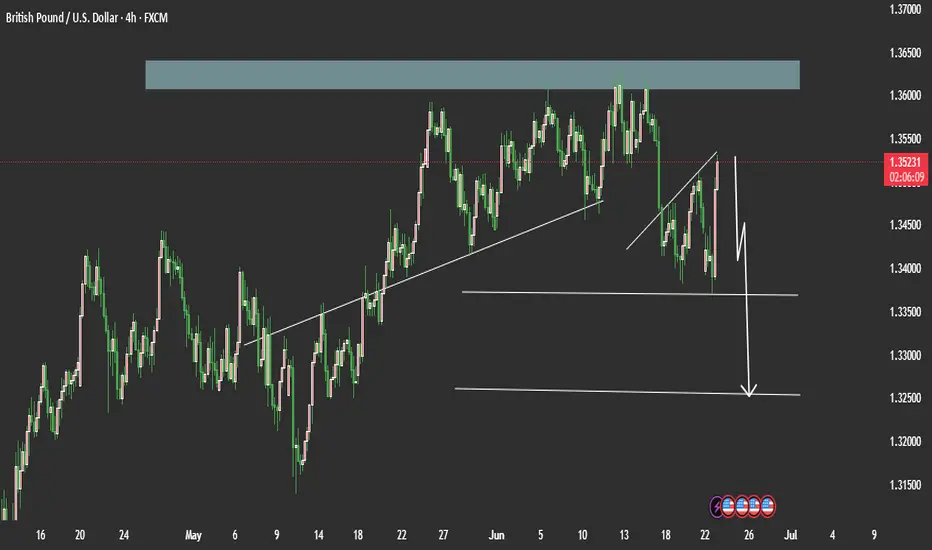
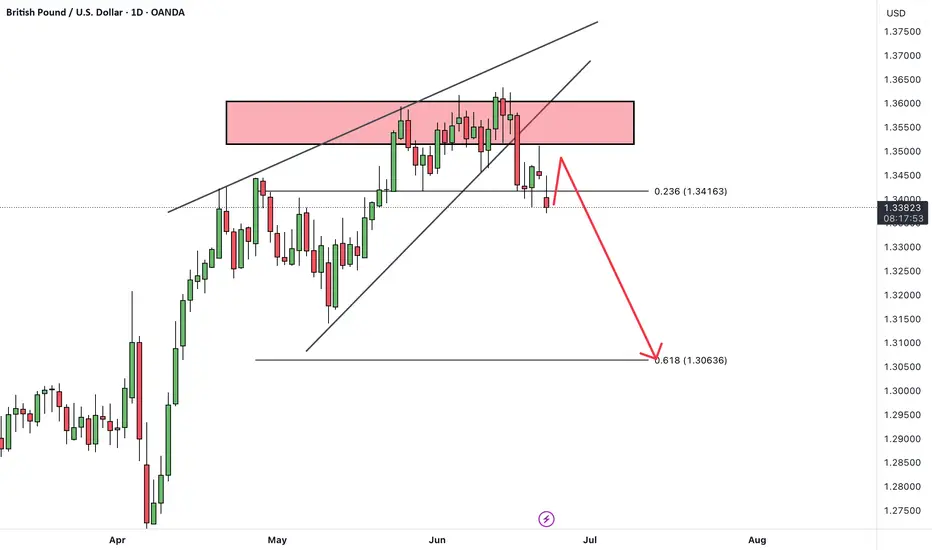
GBPUSD – Bearish Set-up Maintains Its GripGBPUSD – Bearish Set-up Maintains Its Grip
The bearish scenario for GBPUSD remains valid, aligning with our previous analysis. Despite expectations of a softer U.S. dollar, ongoing geopolitical tensions—particularly the escalating war—have sustained dollar strength. This resilience in the dollar undermines any near-term bullish recovery for GBPUSD.
Resistance zone 1.35500 / 1.36000
Support Levels 1.33500 / 1.32500
Technically, the pair continues to trade under key resistance zones, with lower highs confirming bearish momentum. Unless we see a decisive shift in the geopolitical narrative or major macroeconomic data supporting GBP recovery, the bearish bias remains intact.
you may find more details in the chart Ps Support with like and comments for more analysis.
GBPUSD (Daily + H4) – Bullish Symmetry with Shark Execution & El
Hello awesome traders!
I hope your trading week has been phenomenal. Let’s close out the week strong with this GBPUSD analysis combining Daily structure with lower-timeframe execution.
Main Chart: SYMMETRY (Daily) – Bullish Setup
Price has completed a perfect AB=CD symmetry structure with clear legs from the May rally. We now sit inside a strong PCZ (Potential Completion Zone) between the 78.6% and 100% projections, near a prior breakout zone. This type of measured pullback often sets the base for continuation when confirmed by lower timeframes.
Execution Chart: SHARK (H4) – Entry Strategy
On the 4H, we have a clean SHARK pattern terminating deep within the same PCZ as the daily symmetry. Price tagged 161.8% then immediately bounced, printing a bullish engulfing structure above the 127.2% fib. That’s our signal to focus long.
We define the entry above the minor high / 200 SMA retest — at 1.34450, with stops just below 1.33800 (under the wick and invalidation zone). Targets are aligned with fib retracement and extension zones, 61.8% first, 127% for the extended leg.
Elliot Context (H4 + Daily Overview)
On the H4, price completed a 5-leg Elliott drive with wedge structure and a sharp exhaustion push down to PRZ.
On the Daily, the Elliott overview shows price respecting impulsive wave alignment and now positioning for a corrective rally that aligns with our symmetry leg expectation.
Next Steps:
Execution: Enter long above 1.34450 only on confirmation.
First target: 1.34920 zone (61.8% fib).
Extended target: 1.36083 (127.2% fib).
Invalidation: Below 1.33800 — if price closes below the PRZ, setup is void.
Risk Management:
Clear stop placement and PRZ-based entry. Confluence from Daily + H4 structure + Elliott logic supports the long idea. No FOMO — only execute on confirmation. Let the market come to you.
Hope you all have a great weekend!
Let’s stay disciplined, trust the structure, and trade like the pros.
—Constantino DeLa
Tradechartpatternslikethepros.

Major resistance ahead?GBP/USD is rising towards the resistance level which is an overlap resistance and could reverse from this level to our take profit.
Entry: 1.3535
Why we like it:
There is an overlap resistance level.
Stop loss: 1.3449
Why we like it:
There is a pullback resistance level that lines up with the 161.8% Fibonacci extension.
Take profit: 1.3449
Why we like it:
There is a pullback support level.
Enjoying your TradingView experience? Review us!
Please be advised that the information presented on TradingView is provided to Vantage (‘Vantage Global Limited’, ‘we’) by a third-party provider (‘Everest Fortune Group’). Please be reminded that you are solely responsible for the trading decisions on your account. There is a very high degree of risk involved in trading. Any information and/or content is intended entirely for research, educational and informational purposes only and does not constitute investment or consultation advice or investment strategy. The information is not tailored to the investment needs of any specific person and therefore does not involve a consideration of any of the investment objectives, financial situation or needs of any viewer that may receive it. Kindly also note that past performance is not a reliable indicator of future results. Actual results may differ materially from those anticipated in forward-looking or past performance statements. We assume no liability as to the accuracy or completeness of any of the information and/or content provided herein and the Company cannot be held responsible for any omission, mistake nor for any loss or damage including without limitation to any loss of profit which may arise from reliance on any information supplied by Everest Fortune Group.

GBPUSD ZONE TO ZONE
Price is trading beneath the 1.35 level, which is likely to act as resistance. A downside move toward 1.33 remains the base case.

GBPUSD Trading Strategy for the WeekGBPUSD is reacting at the support zone of 1.34000. This is the last important support zone that the pair is facing. If this support zone is broken, the pair will enter a prolonged Downtrend phase. 1.325 could be the target for this decline.
If the 1.34000 zone is pushed up by buyers, the pair will touch the 1.35000 border zone. If this zone is broken, the pair will form a double bottom pattern and continue to increase back to the peak of last week around 1.36000. In case the buying force is not strong enough to break 1.35000, the pair will return to the sideway in the rectangular border.
Support: 1.32500
Resistance: 1.36000
Break out: 1.34000-1.35000
Recommended good trading strategy:
Trade when price confirms in Break out zone.
BUY 1.32600-1.32400 Stoploss 1.32000
SELL 1.35900-1.36100 Stoploss 1.36400

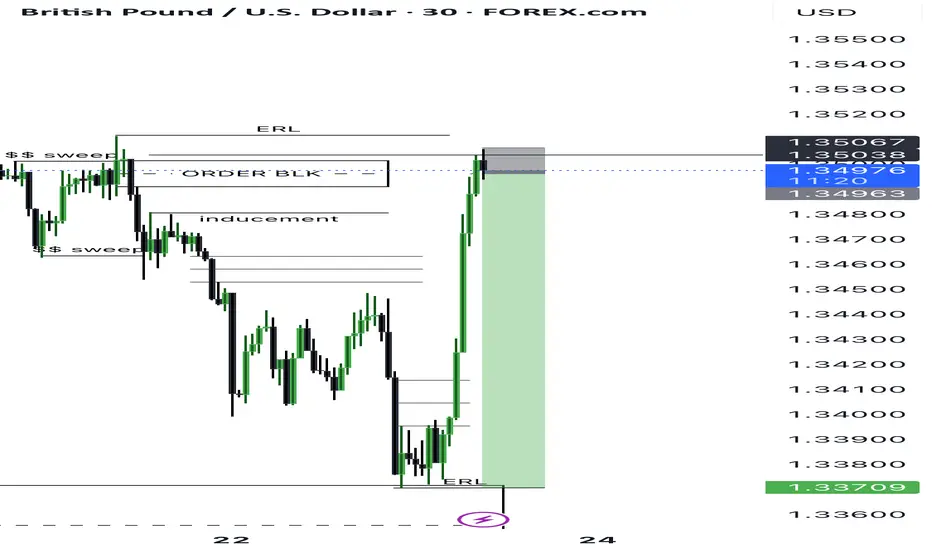
GBPUSD Buys from the weekly FVG.It is clear that weekly fvg, liquidity sweep and time macro are superior in regarding to quick profitability. Patience is the overall recipe. #ICT concepts.

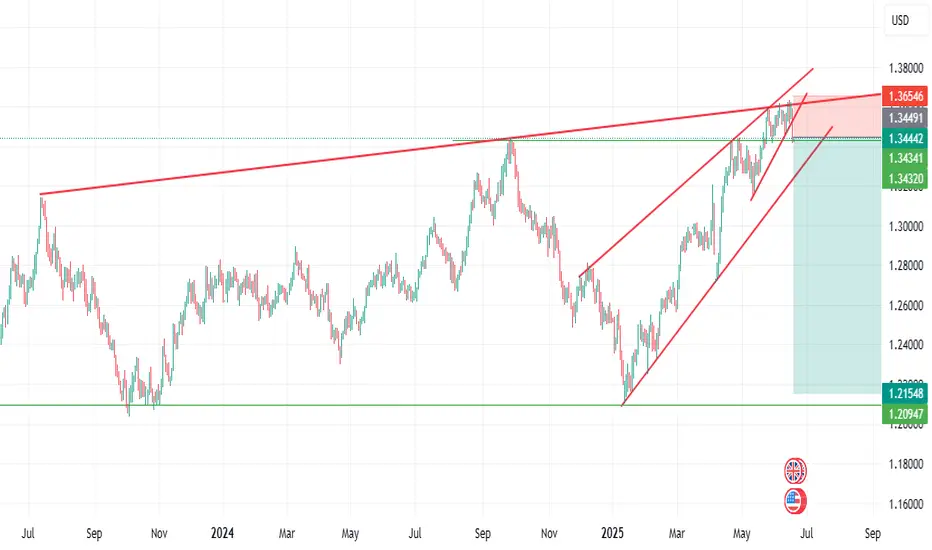
GBP/USD Downtrend Wedge Breakout Setup – Bullish Target AheadThe GBP/USD pair is currently displaying a downtrend wedge pattern, a structure that typically signals a bullish reversal when confirmed. The pattern is formed by a descending resistance trendline (in red) and a gradually sloping support line (in green), converging to a point. Price has bounced off the wedge’s support multiple times while forming lower highs, creating pressure that often leads to a breakout.
As seen in the chart, the pair recently surged toward the upper resistance line and is now attempting to break above it. A successful breakout with bullish candle confirmation could lead to a strong move upward.
📈 Breakout Scenario
If the price manages to close above the resistance zone (~1.3490–1.3500), it would confirm the wedge breakout. Based on the height of the pattern, the projected breakout target is around 1.3692. This target is calculated by measuring the vertical height of the wedge and adding it to the breakout point. Confirmation of breakout should ideally include a retest of the broken resistance acting as new support.
📉 Rejection Scenario
However, if the breakout attempt fails and the price gets rejected again from the red resistance line, the pair could retest the wedge’s support area around 1.3360. A breakdown below the green zone would invalidate the bullish outlook and suggest continued bearish pressure.
⚙️ Strategy Tips
Buy Setup: Enter after breakout candle closes above 1.3500 with stop loss just below breakout zone.
Take Profit: Use the 1.3692 level as the primary target or scale out on the way up.
Confirmation: Always wait for breakout confirmation before entering; avoid false breakouts.
✅ Conclusion
This wedge breakout setup offers a bullish trading opportunity if confirmed. The clear structure, repeated tests of both support and resistance, and recent momentum build a strong technical case. Still, confirmation is key before initiating any positions.
=================================================================
Disclosure: I am part of Trade Nation's Influencer program and receive a monthly fee for using their TradingView charts in my analysis.
=================================================================

GBPUSD is bearishFrom the chart, you will see that gbpusd is a long term bearish trade.
Reason;
1, In the bigger picture of the chart, you can an uptrend confirmation after the third touch
2, in the smaller picture you will see an ascending triangle
Wait for second trendline breakout for more confirmation and entry
GBPUSDHello Traders! 👋
What are your thoughts on GBPUSD?
On the GBPUSD chart, we can see that the price has repeatedly tested a key resistance zone but failed to break above it, resulting in multiple rejections.
After forming a rising wedge pattern, the pair has broken down below the wedge, and is now completing a pullback toward the broken trendline.
We expect that after some consolidation in this area and completion of the pullback, the price will likely resume its decline toward lower targets.
As long as price remains below the resistance zone and broken trendline, the bearish scenario remains valid.
Is the pullback complete and ready for the next leg down? Share your view below! 🤔👇
Don’t forget to like and share your thoughts in the comments! ❤️
GBPUSD - Technical Outlook (Long + Short Term)In this article, I’ll share my current outlook on GBPUSD, highlighting both higher time frame (HTF) and intraday considerations.
Higher Time Frame Analysis
The overall trend remains bearish. Price is still trading within the previous structural leg, with the key level at 1.42500. Unless we see a decisive break above this level, my bias will remain bearish for this pair.
Recently, we’ve witnessed what looks like institutional manipulation to the upside, followed by a sharp bearish reaction from the weekly supply zone. This price action aligns with a classic Wyckoff distribution cycle, which often signals that the prevailing trend is likely to continue.
Intraday Advice
For short-term traders, it’s best to wait for lower time frame (LTF) pullbacks and signs of manipulation before considering short positions. If price continues to push lower, there should be opportunities to ride the trend down over the coming weeks, with multiple entry points along the way.
Trading Considerations
If this analysis plays out, there’s potential to maximize gains through both swing and intraday trades. However, patience and risk management are key. Losses are inevitable - what matters is managing risk and staying disciplined.
Key Points to Remember:
Wait for clear pullbacks before entering trades.
Stick to your risk management plan.
Stay patient and let the market come to you.
This is an exciting time to trade FX:GBPUSD , but always assess if the risk is worth the reward before entering any position.
Happy hunting predators...
Apex out!

GBPUSD Will Fall! Sell!
Here is our detailed technical review for GBPUSD.
Time Frame: 6h
Current Trend: Bearish
Sentiment: Overbought (based on 7-period RSI)
Forecast: Bearish
The market is approaching a significant resistance area 1.349.
Due to the fact that we see a positive bearish reaction from the underlined area, I strongly believe that sellers will manage to push the price all the way down to 1.341 level.
P.S
The term oversold refers to a condition where an asset has traded lower in price and has the potential for a price bounce.
Overbought refers to market scenarios where the instrument is traded considerably higher than its fair value. Overvaluation is caused by market sentiments when there is positive news.
Disclosure: I am part of Trade Nation's Influencer program and receive a monthly fee for using their TradingView charts in my analysis.
Like and subscribe and comment my ideas if you enjoy them!

GBPUSD Supply and Demand AnalysisPrice still looking bearish, if we are to pull back we a strong area of supply higher up that could be mitigated to fuel the move back to the downside.
GBPUSD Is Very Bearish! Sell!
Take a look at our analysis for GBPUSD.
Time Frame: 5h
Current Trend: Bearish
Sentiment: Overbought (based on 7-period RSI)
Forecast: Bearish
The market is testing a major horizontal structure 1.357.
Taking into consideration the structure & trend analysis, I believe that the market will reach 1.351 level soon.
P.S
The term oversold refers to a condition where an asset has traded lower in price and has the potential for a price bounce.
Overbought refers to market scenarios where the instrument is traded considerably higher than its fair value. Overvaluation is caused by market sentiments when there is positive news.
Disclosure: I am part of Trade Nation's Influencer program and receive a monthly fee for using their TradingView charts in my analysis.
Like and subscribe and comment my ideas if you enjoy them!

GBP/USD BEARS ARE STRONG HERE|SHORT
Hello, Friends!
We are going short on the GBP/USD with the target of 1.344 level, because the pair is overbought and will soon hit the resistance line above. We deduced the overbought condition from the price being near to the upper BB band. However, we should use low risk here because the 1W TF is green and gives us a counter-signal.
Disclosure: I am part of Trade Nation's Influencer program and receive a monthly fee for using their TradingView charts in my analysis.
✅LIKE AND COMMENT MY IDEAS✅

GBPUSDit’s a clear sign that this pair is selling for now.
We just have to get good entries at a correct time. In bearish move

GBP/USD Breakout Done , Best Place To Get 150 Pips Clear !Here is my opinion on GBP/USD On 2H T.F , We have a very good breakout now clear not as the old one and we have a very good bearish price action , so i think it will be a good entry if the price go back to retest my res with the news today and give us a good touch and go to downside , and also we might see a random move and fake wicks to take all stop losses before going down or even back to upside so be careful today and use a good risk , i`m waiting the price to back to retest the broken support and new res and then i will enter a sell trade with a very small lot size .
