GBPUSD: The Bearish Setup Remains IntactGBPUSD: The Bearish Setup Remains Intact
From our previous analysis we can see that GBPUSD remains bearish despite not having broken down yet.
The war is not affecting the strength of the US dollar and may perhaps become stronger at a time when we expected the US dollar to show slight weakness given that the war could become more serious.
However, as I have explained before, this is not the first time that the US has been involved in a war.
You may watch the analysis for further details
Thank you and Good Luck!
❤️PS: Please support with a like or comment if you find this analysis useful for your trading day❤️
Disclosure: I am part of Trade Nation's Influencer program and receive a monthly fee for using their TradingView charts in my analysis.
USDGBP trade ideas

Market Analysis: GBP/USD Dips Below SupportMarket Analysis: GBP/USD Dips Below Support
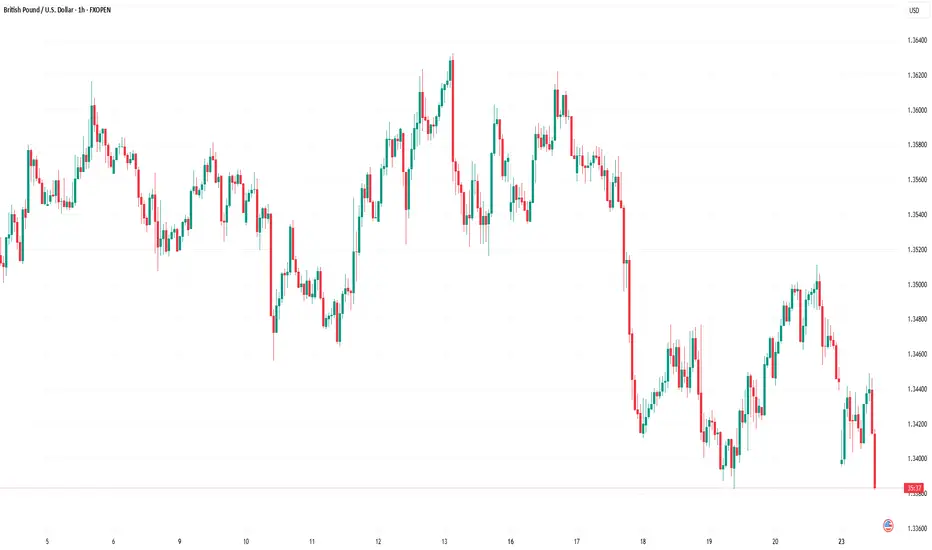
GBP/USD started a fresh decline below the 1.3620 zone.
Important Takeaways for GBP/USD Analysis Today
- The British Pound started another decline from the 1.3620 resistance zone.
- There was a break below a connecting bullish trend line with support at 1.3460 on the hourly chart of GBP/USD at FXOpen.
GBP/USD Technical Analysis
On the hourly chart of GBP/USD at FXOpen, the pair struggled to continue higher above the 1.3620 resistance zone. The British Pound started a fresh decline and traded below the 1.3550 support zone against the US Dollar, as discussed in the previous analysis.
The pair even traded below 1.3500 and the 50-hour simple moving average. Finally, the bulls appeared near the 1.3380 level. There was a recovery wave above the 1.3450 level and the 23.6% Fib retracement level of the downward move from the 1.3622 swing high to the 1.3382 low.
However, the bears were active near the 1.3500 zone and the 50% Fib retracement level. As a result, there was a fresh bearish reaction below a connecting bullish trend line with support at 1.3460.
Initial support on the GBP/USD chart sits at 1.3380. The next major support is at 1.3350, below which there is a risk of another sharp decline. In the stated case, the pair could drop toward 1.3200.
Immediate resistance on the upside is near 1.3440. The first major resistance is near the 1.3500 zone. The main hurdle sits at 1.3530. A close above the 1.3530 resistance might spark a steady upward move. The next major resistance is near the 1.3565 zone. Any more gains could lead the pair toward the 1.3620 resistance in the near term.
This article represents the opinion of the Companies operating under the FXOpen brand only. It is not to be construed as an offer, solicitation, or recommendation with respect to products and services provided by the Companies operating under the FXOpen brand, nor is it to be considered financial advice.
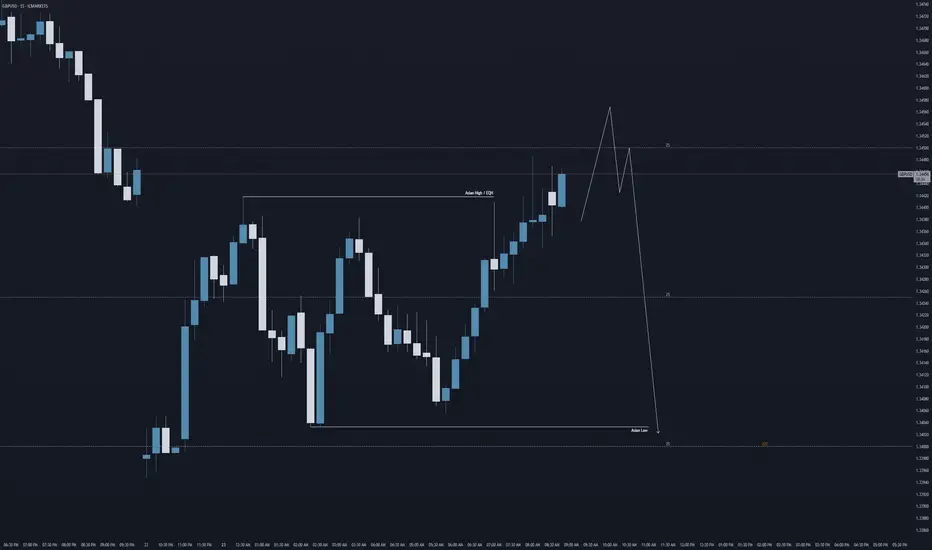
GU = Asian Highs > Asian LowsAs per my morning forecast on GU shared this morning. Price action did exactly that. Sweeped the Asian highs and plummeted towards the Asian lows at around 1.34.
- Aman

GBPUSD LONG FORECAST Q2 W26 D23 Y25GBPUSD LONG FORECAST Q2 W26 D23 Y25
Professional Risk Managers👋
Welcome back to another FRGNT chart update📈
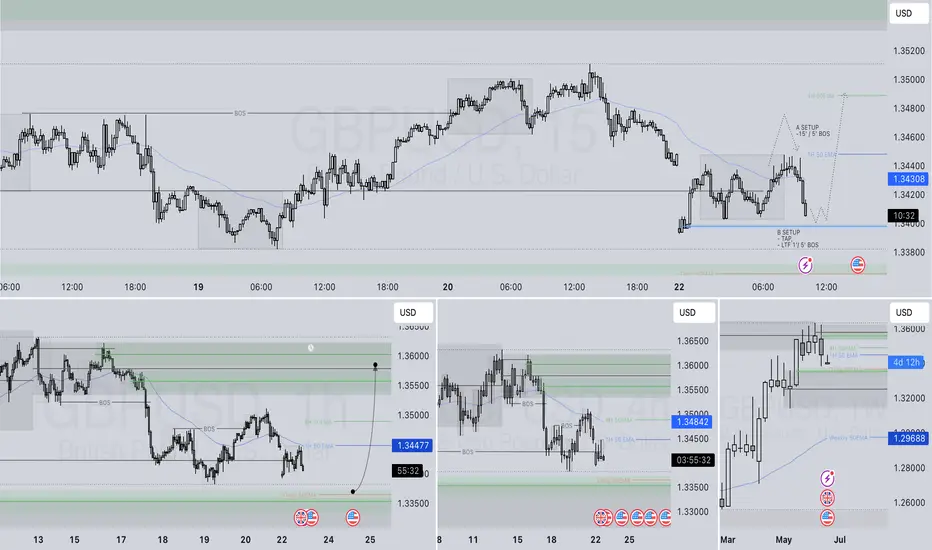
Diving into some Forex setups using predominantly higher time frame order blocks alongside confirmation breaks of structure.
Let’s see what price action is telling us today!
💡Here are some trade confluences📝
✅Daily order block
✅15' order block
✅Intraday breaks of structure
✅4H Order block
🔑 Remember, to participate in trading comes always with a degree of risk, therefore as professional risk managers it remains vital that we stick to our risk management plan as well as our trading strategies.
📈The rest, we leave to the balance of probabilities.
💡Fail to plan. Plan to fail.
🏆It has always been that simple.
❤️Good luck with your trading journey, I shall see you at the very top.
🎯Trade consistent, FRGNT X
GBPUSD short re-entryGBPUSD – I Got Clipped. Now I’m Coming Back With Intent.
📅 Monday | June 23, 2025
Yes — I got stopped out. That’s execution, not failure.
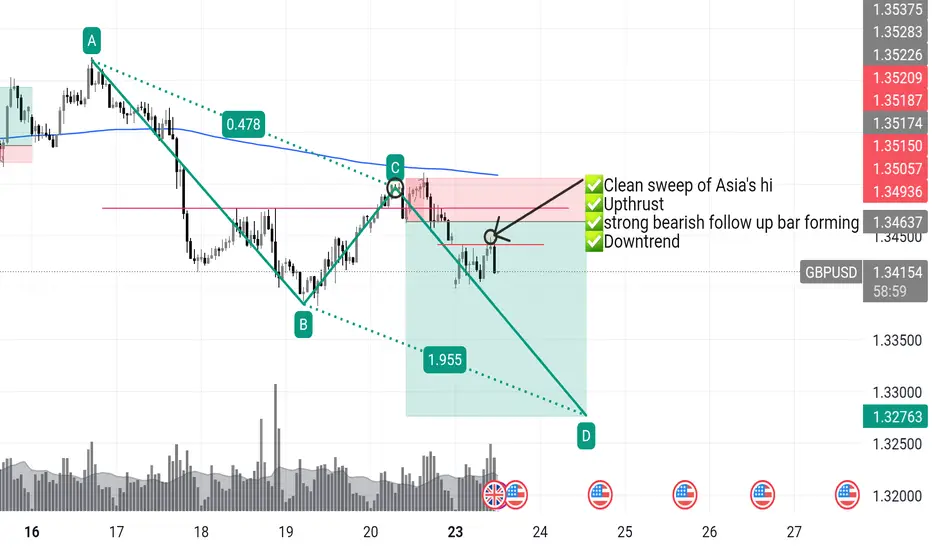
Clean sweep of Asia’s high. Textbook.
Liquidity taken. Weak hands shaken. Now the real move can begin.
🔁 This 1H close is my greenlight for re-entry.
I don’t hesitate when the market gives me the same setup twice —
It’s still:
✅ Downtrend dominant
✅ Upthrust confirmed
✅ Sellers stepping back in
✅ Price under key rejection zone
If this bar closes bearish, I’m short again — this time with full intent.
📉 Target: 3r+ and beyond
🔥 London
GBPUSD MARKET STRUCTURE CHANGED FROM DOWNTREND TO UPTREND.GBPUSD MARKET STRUCTURE CHANGED FROM DOWNTREND TO UPTREND.
Market started forming higher high, which shows Bullish trend.
Market may Hit the Target of 1.35000 in upcoming trading sessions.
on lower side market may test the level of 1.33800

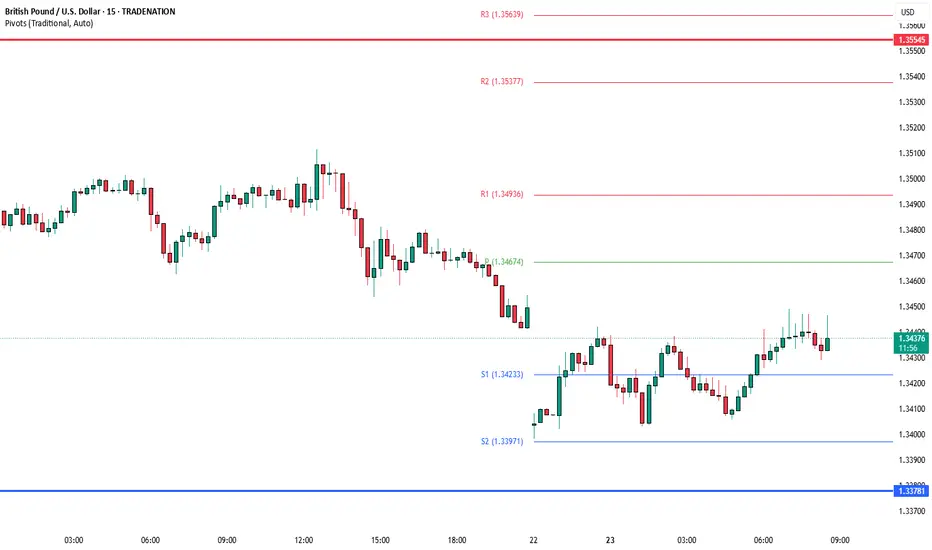
GBPUSD INTRADAY bullish consolidation supported at 1.3380The GBPUSD currency pair maintains a bullish price action structure, supported by the ongoing rising trend. Current intraday movement appears to be a corrective pullback within a consolidation phase, potentially offering a buying opportunity within the broader uptrend.
Key Technical Levels:
Support (Key Trading Level): 1.3380 (prior consolidation zone)
Additional Support: 1.3340 and 1.3300
Upside Resistance Targets:
1.3480
1.3550
1.3600 (longer-term target)
Bullish Scenario:
A bounce from the 1.3380 support would confirm the continuation of the bullish trend. Sustained upside momentum could then target 1.3480, with further extensions toward 1.3550 and 1.3600 over the medium term.
Bearish Alternative:
A confirmed daily close below 1.3380 would invalidate the bullish outlook and suggest deeper downside retracement. In that case, the next support levels to monitor would be 1.3340 and 1.3300.
Conclusion:
The bias remains bullish while GBPUSD holds above 1.3380. A rebound from this level supports long positions toward higher resistance zones. However, a break and close below 1.3380 would shift the outlook to neutral-to-bearish, favouring further downside correction. Traders should watch price action around 1.3380 for directional confirmation.
This communication is for informational purposes only and should not be viewed as any form of recommendation as to a particular course of action or as investment advice. It is not intended as an offer or solicitation for the purchase or sale of any financial instrument or as an official confirmation of any transaction. Opinions, estimates and assumptions expressed herein are made as of the date of this communication and are subject to change without notice. This communication has been prepared based upon information, including market prices, data and other information, believed to be reliable; however, Trade Nation does not warrant its completeness or accuracy. All market prices and market data contained in or attached to this communication are indicative and subject to change without notice.

The Day Ahead Economic Data:
Markets will focus on early June PMI data from the US, UK, Japan, Germany, France, and the Eurozone, giving a snapshot of global economic health. The US May existing home sales report will show how housing is holding up under high mortgage rates.
Central Banks:
Several Fed officials (Waller, Bowman, Goolsbee, Williams, Kugler) will speak—investors will watch for hints on rate cuts. From the ECB, speeches by President Lagarde and Nagel may offer insight into the pace of European rate cuts.
Other:
The EU-Canada summit may highlight cooperation on trade, clean tech, and key resources, though it's unlikely to move markets much.
This communication is for informational purposes only and should not be viewed as any form of recommendation as to a particular course of action or as investment advice. It is not intended as an offer or solicitation for the purchase or sale of any financial instrument or as an official confirmation of any transaction. Opinions, estimates and assumptions expressed herein are made as of the date of this communication and are subject to change without notice. This communication has been prepared based upon information, including market prices, data and other information, believed to be reliable; however, Trade Nation does not warrant its completeness or accuracy. All market prices and market data contained in or attached to this communication are indicative and subject to change without notice.
GU: Trading back towards 1.34 today?Hi everyone, hope you've all had a nice weekend.
Looking at GBP/USD this morning, keeping the forecast and analysis simple, but looking at a further bearish run today if we get the right lower time frame price action to confirm...
Looking at a sweep into 1.345 before trading lower, potentially towards 1.34.
Aman
The 3 Step Rocket Booster Strategy – Bullish Setup BreakdownHey traders!
Here’s a trade idea on GBP/USD using a multi-timeframe trend strategy I call the Rocket Booster Strategy. It’s based on trend strength, oscillator signals, and price action confirmation.
---
📊 Weekly Chart – The Big Picture
The Stochastic RSI on the weekly chart recently pulled back near the 80 zone. This isn’t a reversal — it’s a healthy pause in a strong uptrend. I’m watching for a breakout continuation as momentum builds up.
---
📉 Daily Chart – Oversold Alert
On the daily chart, the Stochastic RSI dropped below 20, signaling that GBPUSD might be ready for a bullish reversal. It’s setting the stage for a solid long opportunity — as long as the trend agrees.
---
🕯 4H Chart – Bullish Engulfing Entry
This is where it gets exciting — a clear Bullish Engulfing pattern has formed on the 4-hour chart. That’s my entry trigger. This confirms the reversal idea with a strong price action signal.
---
✅ Rocket Booster Strategy Criteria
To take a long trade using this strategy, I require all 3 of the following:
1. ✅ Price is above the 50 EMA
2. ✅ Price is above the 200 EMA
3. ✅ A breakout or gap-up is either happening or imminent
All three conditions are currently aligning on GBPUSD — this is a potential high-probability setup.
---
💡 Optional Tip for Automation
If you’d like to automate this entry using alerts on TradingView, you’ll need a paid monthly plan to unlock multiple alerts and advanced conditions like candlestick detection or EMA confirmation.
---
⚠️ Disclaimer
Trading is risky. Always use:
Proper risk management
Well-placed stop-losses
A demo account to test your strategy
And take profits with discipline 🧠💰
---
🔚 Final Thoughts
This is a clean example of trend trading with structure and precision.
I used multi-timeframe analysis, the Stochastic RSI, and price action to time the entry. If you're learning trading, this is a great case to study or test in your journal.
Let me know what you think or how you'd manage this trade.
Happy trading! 📈💥
---

GU-Mon-23/06/25 TDA-Lots of PMI news incoming today!Analysis done directly on the chart
Follow for more, possible live trades update!
Middle east tensions intensify, follow closely
what's happening as it might influence hugely
on price movement, volatility, fluctuation.
Active in London session!
Not financial advice, DYOR.
Market Flow Strategy
Mister Y

GBPUSD London Session | Live Forex Analysis & Trade ideasIn today’s London session, we conducted a detailed intraday analysis on the GBPUSD currency pair using wave structure analysis on the 5-minute (M5) timeframe.
Price action confirmed a break below bullish market structure that had previously formed the Asian session high, signalling a potential shift in market sentiment to the downside. This breakdown confirmed short-term bearish momentum shift.
Following the completion of the bearish wave, the price retraced to form a structural pullback (trend reset), providing a discounted price zone for new short positions and offering profit-taking opportunities for earlier sellers.
Our trading plan for this session is to sell GBPUSD at 1.3488, anticipating a move below the midline (ML) support at 1.3462. The technical target for this trade, based on our London-New York session projection, is set at 1.3417.
The stop-loss for this setup is placed above MH of the bearish structure at 1.3505, maintaining proper risk management.
This trade idea aligns with our trend-following strategy and is supported by real-time price action analysis.
📉 Short Bias Confirmed
🎯 Entry: 1.3488
🛑 Stop Loss: 1.3505
✅ Take Profit: 1.3417
Trade safe, manage your risk, and stay blessed.

GBPUSD DID YOU KNOW THAT YOUR COUNTRY CENTRAL BANKS HAVE ANOTHER
CENTRAL BANK AND IS CALLED BIS(BANK OF INTERNATIONAL SETTLEMENTS )???
The Bank for International Settlements (BIS) was established in 1930 at the Hague Conference, making it the world's oldest international financial institution. Its initial purpose was to facilitate the settlement of World War I reparations and to promote cooperation among central banks.
The BIS trading market refers to the role of the Bank for International Settlements (BIS) as a key intermediary and facilitator in global financial markets, particularly in foreign exchange (FX) and central bank transactions
BIS is a secretive institution with sovereign immunity that can move trillions without oversight. aka central bank of central banks in Basel Swissland with over 63 members in the world which are centrals banks of countries that make up 95% of world GDP.
Key Points about BIS and Its Trading Market Role:
Central Bank’s Central Bank: BIS acts as a bank for central banks and international organizations, providing banking services such as accounts, gold and currency transactions, asset management, and short-term collateralized loans.
Market Intermediary: BIS frequently conducts large-scale transactions on behalf of central banks in the foreign exchange and gold markets. These trades are often substantial, reflecting central banks’ reserve management or monetary policy operations.
Avoiding Market Misinterpretation: When BIS buys or sells currencies or assets, it is usually acting for a central bank, not itself, helping avoid markets mistaking these large trades for speculative or official government interventions.
Forum for Cooperation: BIS provides a platform for central banks to exchange information, coordinate policies, and cooperate on monetary and financial stability, which indirectly influences market dynamics.
Research and Statistics: BIS publishes data and analysis on global banking, FX, derivatives markets, and financial stability, supporting informed decision-making in the trading community.
Summary
The BIS trading market is not a public exchange but a specialized, high-level market where BIS facilitates and conducts financial transactions for central banks, particularly in foreign exchange and gold. Its activities help central banks manage reserves and implement monetary policy while fostering international financial cooperation.
if you know you know because BOE (BANK OF ENGLAND ) and FED (FEDERAL RESERVE ) are members .
GBPUSD 10 YEAR BOND YIELD ,INTEREST RATE ,INTEREST RATE DIFFERENTIAL AND CARRY TRADE ADVANTAGE .
1. Current Rates and Yields
Metric United Kingdom (GBP) United States (USD) Differential (UK - US)
10-Year Bond Yield 4.54% 4.38% +0.16% (16 bps)
Policy Interest Rate 4.25% 4.25%–4.50% -0.25% to -0.01%
UK Context: The Bank of England (BoE) held rates at 4.25% amid sticky inflation (3.4% YoY in May ) but signaled potential cuts in August.
US Context: The Federal Reserve held rates at 4.25%–4.50%, prioritizing inflation control despite slowing growth .
2. Interest Rate Differential and Carry Trade Advantage
Yield Spread: The UK 10-year gilt yields 0.16% more than the US 10-year Treasury, creating a modest yield pickup for GBP-denominated bonds .
Policy Rate Spread: The USD offers a 0.25% higher short-term rate (using the Fed’s 4.50% upper bound vs. BoE’s 4.25%) .
Carry Trade Mechanics:
GBP-USD Strategy: Borrow USD at 4.50% and invest in GBP assets at 4.54% (10-year gilt) for a net carry of +0.04%.
USD-GBP Strategy: Borrow GBP at 4.25% and invest in USD assets at 4.38% (10-year Treasury) for a net carry of +0.13%.
Key Risks:
Currency Volatility: GBP/USD at 1.34–1.35 could erase gains if the dollar strengthens.
Policy Shifts: BoE rate cuts (expected August 2025) may narrow the yield spread , while Fed cuts could reduce USD rate advantages .
3. Market Outlook
UK Focus: Inflation persistence may delay BoE cuts, supporting GBP yields near-term .
US Focus: Fed’s "higher for longer" stance and tariff-related inflation risks could sustain USD yield appeal .
Carry Viability: The USD-GBP strategy offers a slight edge (0.13% carry) but requires hedging against GBP appreciation risks.
Summary
Yield Advantage: UK 10-year gilts yield 0.16% more than US Treasuries, but USD short-term rates are 0.25% higher.
Optimal Carry: Borrowing GBP to invest in USD assets (0.13% carry) is marginally favorable, though policy uncertainty warrants caution.
Critical Factors: Monitor BoE/Fed rate decisions and GBP/USD trends for carry trade adjustments.

GBPUSD BUY OPPORTUNITY Am seeing a buy Opportunities on GBPUSD
ENTRY: 1 .33900
Sl: 1.33800
TP: 1.35180
Comment your opinion pls 🙏
For Account management. Contact me via X @shajudeakinoba1

How to trade GAPS in the market, SELL GBPUSD!!!!All the information you need to find a high probability trade are in front of you on the charts so build your trading decisions on 'the facts' of the chart NOT what you think or what you want to happen or even what you heard will happen. If you have enough facts telling you to trade in a certain direction and therefore enough confluence to take a trade, then this is how you will gain consistency in you trading and build confidence. Check out my trade idea!!
www.tradingview.com

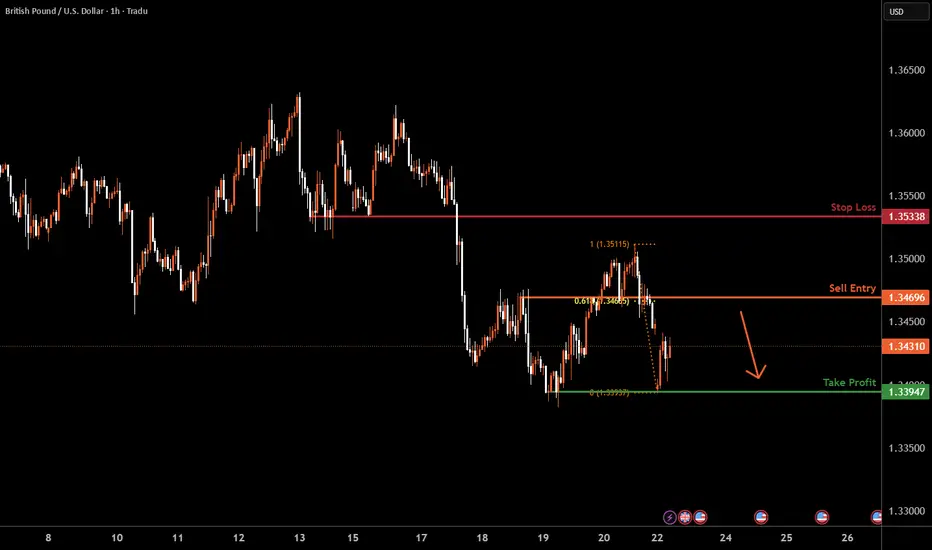
GBPUSD H1 I Bearish Reversal Based on the H4 chart, the price is rising our sell entry level at 1.3469, a pullback resistance that aligns with the 61.8% Fib retracement.
Our take profit is set at 1.3394, a swing low support.
The stop loss is set at 1.3533, a pullback resistance.
High Risk Investment Warning
Trading Forex/CFDs on margin carries a high level of risk and may not be suitable for all investors. Leverage can work against you.
Stratos Markets Limited (tradu.com ):
CFDs are complex instruments and come with a high risk of losing money rapidly due to leverage. 63% of retail investor accounts lose money when trading CFDs with this provider. You should consider whether you understand how CFDs work and whether you can afford to take the high risk of losing your money.
Stratos Europe Ltd (tradu.com ):
CFDs are complex instruments and come with a high risk of losing money rapidly due to leverage. 63% of retail investor accounts lose money when trading CFDs with this provider. You should consider whether you understand how CFDs work and whether you can afford to take the high risk of losing your money.
Stratos Global LLC (tradu.com ):
Losses can exceed deposits.
Please be advised that the information presented on TradingView is provided to Tradu (‘Company’, ‘we’) by a third-party provider (‘TFA Global Pte Ltd’). Please be reminded that you are solely responsible for the trading decisions on your account. There is a very high degree of risk involved in trading. Any information and/or content is intended entirely for research, educational and informational purposes only and does not constitute investment or consultation advice or investment strategy. The information is not tailored to the investment needs of any specific person and therefore does not involve a consideration of any of the investment objectives, financial situation or needs of any viewer that may receive it. Kindly also note that past performance is not a reliable indicator of future results. Actual results may differ materially from those anticipated in forward-looking or past performance statements. We assume no liability as to the accuracy or completeness of any of the information and/or content provided herein and the Company cannot be held responsible for any omission, mistake nor for any loss or damage including without limitation to any loss of profit which may arise from reliance on any information supplied by TFA Global Pte Ltd.
The speaker(s) is neither an employee, agent nor representative of Tradu and is therefore acting independently. The opinions given are their own, constitute general market commentary, and do not constitute the opinion or advice of Tradu or any form of personal or investment advice. Tradu neither endorses nor guarantees offerings of third-party speakers, nor is Tradu responsible for the content, veracity or opinions of third-party speakers, presenters or participants.

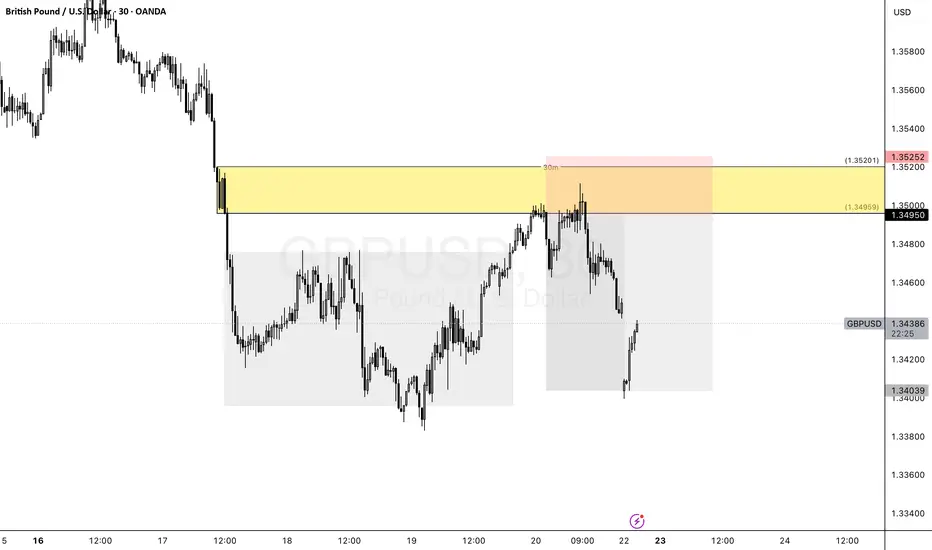
gbpusd 30 supply great example on the 30 min timeframe.
drop base drop , fair value. supply identified for a one to three risk to reward.
GBPUSDDID YOU KNOW THAT YOUR COUNTRY CENTRAL BANKS HAVE ANOTHER
CENTRAL BANK AND IS CALLED BIS(BANK OF INTERNATIONAL SETTLEMENTS )???
The Bank for International Settlements (BIS) was established in 1930 at the Hague Conference, making it the world's oldest international financial institution. Its initial purpose was to facilitate the settlement of World War I reparations and to promote cooperation among central banks.
The BIS trading market refers to the role of the Bank for International Settlements (BIS) as a key intermediary and facilitator in global financial markets, particularly in foreign exchange (FX) and central bank transactions
BIS is a secretive institution with sovereign immunity that can move trillions without oversight. aka central bank of central banks in Basel Swissland with over 63 members in the world which are centrals banks of countries that make up 95% of world GDP.
Key Points about BIS and Its Trading Market Role:
Central Bank’s Central Bank: BIS acts as a bank for central banks and international organizations, providing banking services such as accounts, gold and currency transactions, asset management, and short-term collateralized loans.
Market Intermediary: BIS frequently conducts large-scale transactions on behalf of central banks in the foreign exchange and gold markets. These trades are often substantial, reflecting central banks’ reserve management or monetary policy operations.
Avoiding Market Misinterpretation: When BIS buys or sells currencies or assets, it is usually acting for a central bank, not itself, helping avoid markets mistaking these large trades for speculative or official government interventions.
Forum for Cooperation: BIS provides a platform for central banks to exchange information, coordinate policies, and cooperate on monetary and financial stability, which indirectly influences market dynamics.
Research and Statistics: BIS publishes data and analysis on global banking, FX, derivatives markets, and financial stability, supporting informed decision-making in the trading community.
Summary
The BIS trading market is not a public exchange but a specialized, high-level market where BIS facilitates and conducts financial transactions for central banks, particularly in foreign exchange and gold. Its activities help central banks manage reserves and implement monetary policy while fostering international financial cooperation.
if you know you know because BOE (BANK OF ENGLAND ) and FED (FEDERAL RESERVE ) are members .
GBPUSD 10 YEAR BOND YIELD ,INTEREST RATE ,INTEREST RATE DIFFERENTIAL AND CARRY TRADE ADVANTAGE .
1. Current Rates and Yields
Metric United Kingdom (GBP) United States (USD) Differential (UK - US)
10-Year Bond Yield 4.54% 4.38% +0.16% (16 bps)
Policy Interest Rate 4.25% 4.25%–4.50% -0.25% to -0.01%
UK Context: The Bank of England (BoE) held rates at 4.25% amid sticky inflation (3.4% YoY in May ) but signaled potential cuts in August.
US Context: The Federal Reserve held rates at 4.25%–4.50%, prioritizing inflation control despite slowing growth .
2. Interest Rate Differential and Carry Trade Advantage
Yield Spread: The UK 10-year gilt yields 0.16% more than the US 10-year Treasury, creating a modest yield pickup for GBP-denominated bonds .
Policy Rate Spread: The USD offers a 0.25% higher short-term rate (using the Fed’s 4.50% upper bound vs. BoE’s 4.25%) .
Carry Trade Mechanics:
GBP-USD Strategy: Borrow USD at 4.50% and invest in GBP assets at 4.54% (10-year gilt) for a net carry of +0.04%.
USD-GBP Strategy: Borrow GBP at 4.25% and invest in USD assets at 4.38% (10-year Treasury) for a net carry of +0.13%.
Key Risks:
Currency Volatility: GBP/USD at 1.34–1.35 could erase gains if the dollar strengthens.
Policy Shifts: BoE rate cuts (expected August 2025) may narrow the yield spread , while Fed cuts could reduce USD rate advantages .
3. Market Outlook
UK Focus: Inflation persistence may delay BoE cuts, supporting GBP yields near-term .
US Focus: Fed’s "higher for longer" stance and tariff-related inflation risks could sustain USD yield appeal .
Carry Viability: The USD-GBP strategy offers a slight edge (0.13% carry) but requires hedging against GBP appreciation risks.
Summary
Yield Advantage: UK 10-year gilts yield 0.16% more than US Treasuries, but USD short-term rates are 0.25% higher.
Optimal Carry: Borrowing GBP to invest in USD assets (0.13% carry) is marginally favorable, though policy uncertainty warrants caution.
Critical Factors: Monitor BoE/Fed rate decisions and GBP/USD trends for carry trade adjustments.

Bullish bounce?The Cable (GBP/USD) is falling towards the pivot and could bounce to the 1st resistance.
Pivot: 1.3328
1st Support: 1.3133
1st Resistance: 1.3636
Risk Warning:
Trading Forex and CFDs carries a high level of risk to your capital and you should only trade with money you can afford to lose. Trading Forex and CFDs may not be suitable for all investors, so please ensure that you fully understand the risks involved and seek independent advice if necessary.
Disclaimer:
The above opinions given constitute general market commentary, and do not constitute the opinion or advice of IC Markets or any form of personal or investment advice.
Any opinions, news, research, analyses, prices, other information, or links to third-party sites contained on this website are provided on an "as-is" basis, are intended only to be informative, is not an advice nor a recommendation, nor research, or a record of our trading prices, or an offer of, or solicitation for a transaction in any financial instrument and thus should not be treated as such. The information provided does not involve any specific investment objectives, financial situation and needs of any specific person who may receive it. Please be aware, that past performance is not a reliable indicator of future performance and/or results. Past Performance or Forward-looking scenarios based upon the reasonable beliefs of the third-party provider are not a guarantee of future performance. Actual results may differ materially from those anticipated in forward-looking or past performance statements. IC Markets makes no representation or warranty and assumes no liability as to the accuracy or completeness of the information provided, nor any loss arising from any investment based on a recommendation, forecast or any information supplied by any third-party.

GBPUSDBULLISH GU top down observation anticipating a break of the highs you can find the lower time frame idea below.


GBPUSD is in the Selling DirectionHello Traders
In This Chart GBPUSD HOURLY Forex Forecast By FOREX PLANET
today GBPUSD analysis 👆
🟢This Chart includes_ (GBPUSD market update)
🟢What is The Next Opportunity on GBPUSD Market
🟢how to Enter to the Valid Entry With Assurance Profit
This CHART is For Trader's that Want to Improve Their Technical Analysis Skills and Their Trading By Understanding How To Analyze The Market Using Multiple Timeframes and Understanding The Bigger Picture on the Charts
