GBPUSD Swing ShortGBPUSD Swing short on the daily timeframe. Three confirmation:
Fib pull back
Trend line respect
Fair value gap
*Possibly closing today in a Doji
Take profit will be the next FVG!
USDGBP trade ideas

GBPUSD sell setupWhen plenty trading reasons or factors come together in this manner, probability of trade been a success becomes high.
On the daily chart, we have retest of a broken trendline, price touching the upper part of a downward channel plus strong resistance level
Let's see how it plays out

GBPUSD analysis GBPUSD ahead of a week is on third bearish Trendline touch,failure to break out of the structure will result in sharp bearish sentiment,while in contrary breakout will high an increased bullish momentum and sentiment

GBPUSD DAILY ANALYSISOn the daily timeframe, GU is currently bearish but right now, it is retracing to a bearish FVG, and i think it wants to complete a 50% fib retracement level before it continues to the downside.
i am expecting my first point of engagement with the market shorts to be at level 1.33662, if that level fails, i will try shorting at 1.34533 and at 1.35308...

DeGRAM | GBPUSD fixed above the resistance level📊 Technical Analysis
● GBPUSD broke above 1.3425 resistance, confirming a breakout from the descending channel and maintaining higher lows within the current rising structure.
● Price action targets the 1.3575 resistance zone, with momentum supported by a clean breakout retest pattern.
💡 Fundamental Analysis
● Weak US ISM services PMI and softer dollar demand enhance GBP upside, while UK GDP beat expectations, signaling resilience in economic activity.
✨ Summary
Long above 1.3425; target 1.3575. Setup remains valid while price holds above 1.3310.
-------------------
Share your opinion in the comments and support the idea with a like. Thanks for your support!

GBPUSD Head & Shoulder Pattern for sell target 1.3100#GBPUSD daily head & shoulder pattern has been formed. price broke below neckline last week which is 1.30705 level. Price is moving upside as a pullback without volume. Institutional traders did profit target in their short position. Institutions are waiting price test their supply zone for another leg lower. split your risk into two positions i.e 1st order as 1.3529, 2nd order as 1.3574, stop loss: 1.3605. Medium term target: 1.3100, while 1.3215 is also level of interest for profit taking.


GBP USD long I am waiting for GBP to liquidate all noises from 1h TF down and enter in a good long position for 5\1 RRR and probably from there a good hedge position on short for 7/1 RRR.
Stay tuned for any updates 🙏💪

The next big moveMarket would be all way down soon, head are shoulder was identified at the chart, identifying a market reversal confirmation, further down moves are to be seen
GBPUSD is preparing to rise from support at 1.340GBPUSD is consolidating above the strong level formed by the halt in growth in April 2025. Later, the market confirmed this level with a false breakout
Against the backdrop of the news, a sharp decline formed, which was quickly bought back. A reversal pattern has formed, and the price has returned to the range
Consolidation of GBPUSD above 1.338 - 1.341 will confirm the presence of strong support. In this case, GBPUSD may form growth towards the resistance of the range.

#GBPUSD: Pullback Trade Confirmed?!📈GBPUSD rebounded from the highlighted key support level,
As a confirmation signal i observed a strong bullish Change of Character (CHoCH) on the 4-hour timeframe following its test.
The target is set at 1.3350.

GBP/USD 4H Chart – Head and Shoulders Breakdown with Bearish Currency Pair: GBP/USD (British Pound vs US Dollar)
Timeframe: 4-Hour (4H)
Platform: TradingView
---
🔍 Pattern Identified:
Head and Shoulders Pattern
Left Shoulder, Head, and Right Shoulder are marked.
The neckline is broken, confirming a bearish trend reversal.
The trendline from March to June was also broken, supporting a downtrend.
---
📍 Current Price (at screenshot time):
Around 1.32778
---
🎯 Sell Setup – Target Levels:
🔻 First Target:
Price: 1.30072
Labelled: "1st TARGET POINT"
This is a near-term support level or conservative projection of the Head and Shoulders move.
🔻 Second Target:
Price: 1.28023
Labelled: "2nd TARGET POINT"
This is a deeper target, likely the full measured move of the pattern.
---
📈 Entry & Risk Management:
Suggested Sell Entry Zone: Around 1.32778
Stop-Loss (SL): Consider placing above the Right Shoulder area (around 1.3350–1.3380)
Take-Profit (TP):
TP1: 1.30072
TP2: 1.2802

GBPUSD: Bullish Continuation Ahead?! 🇬🇧🇺🇸
GBPUSD violated a significant resistance cluster yesterday.
The market broke through that with a high momentum bullish candle.
Chances will be high that the pair will continue rising.
The next goal for the buyers is 1.35 psychological resistance.
❤️Please, support my work with like, thank you!❤️

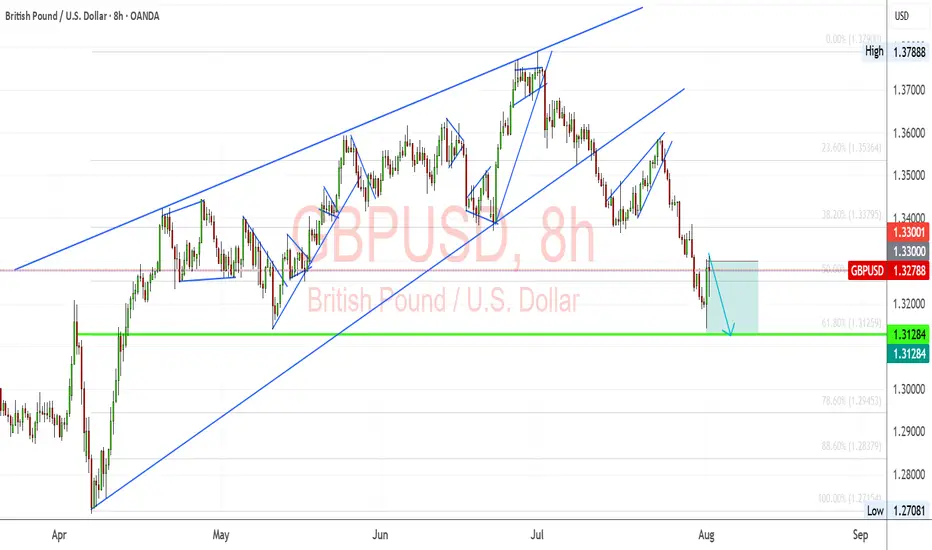
GBPUSD: Bearish Momentum vs. Fundamental Repricing – Key LevelsGBPUSD is at a critical juncture, balancing a clear technical breakdown with a fundamental backdrop favoring near-term volatility. The pair has slipped from its rising wedge structure and is now testing key retracement zones while markets reprice expectations for Fed rate cuts after weak US jobs data. Traders are closely watching whether this bearish momentum will extend toward the 1.3128 support or if a rebound from oversold conditions could trigger a corrective bounce.
Technical Analysis (8H Chart)
Pattern: Clear breakdown from a rising wedge, confirming bearish bias.
Current Level: Price sits near 1.3278, struggling to reclaim the 1.3300 resistance zone.
Key Support Zones:
1.3128 (61.8% Fibonacci retracement) – main bearish target.
1.2945 (78.6% retracement) – extended downside target if selling pressure deepens.
Resistance Levels:
1.3300 (immediate resistance, prior support now flipped).
1.3380 (secondary resistance if a retracement rally occurs).
Projection: Likely bearish continuation toward 1.3128, with a potential retest of 1.3300 before continuation.
Fundamental Analysis
Bias: Bearish in the short term, but Fed policy and risk sentiment remain key drivers.
Key Fundamentals:
USD: Weak NFP (73K), higher unemployment (4.2%), and downward revisions boost Fed cut bets (~75% for September), typically a USD-negative factor.
GBP: BOE maintains a cautious stance due to sticky inflation but lacks clear hawkish conviction as growth slows.
Tariffs: US tariffs add a mild negative weight on GBP trade sentiment.
Risks:
Hot US CPI could slow Fed cut bets, supporting USD.
Hawkish BOE comments could limit GBP downside.
Global risk sentiment shifts could either favor USD (risk-off) or weaken it further (risk-on).
Key Events:
US CPI and PPI for USD direction.
BOE policy updates and UK CPI.
US jobless claims and Fed commentary.
Leader/Lagger Dynamics
GBP/USD is a lagger, mainly reacting to USD shifts. However, its moves directly influence GBP crosses such as GBP/JPY and GBP/CHF.
Summary: Bias and Watchpoints
GBP/USD remains in a bearish phase, targeting 1.3128 with a potential corrective bounce toward 1.3300 first. The primary driver is the technical breakdown, while fundamentals add volatility around US CPI and BOE policy. If CPI surprises lower, the bearish outlook could reverse into a short-term rebound; if CPI is hot, downside momentum could extend. You should monitor USD-driven events closely as GBP/USD sets the tone for broader GBP movements.
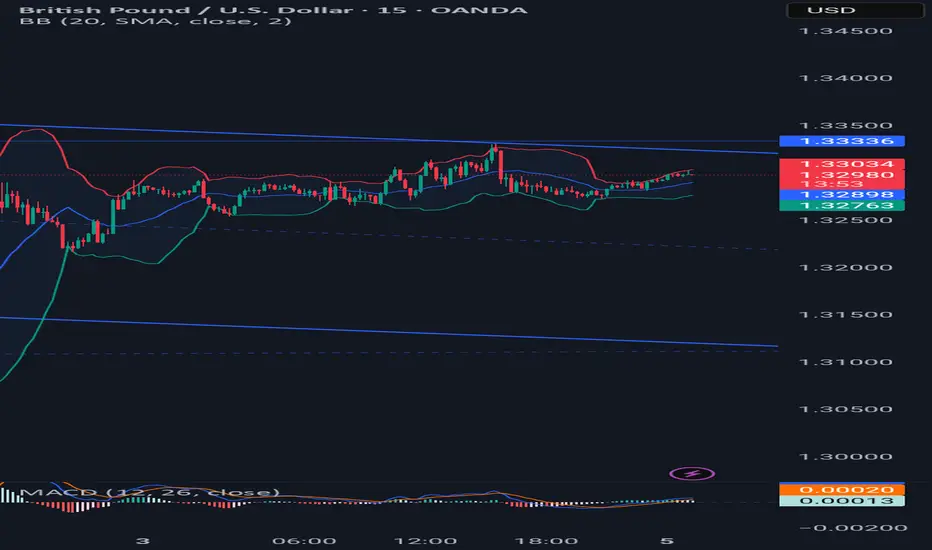
Market Analysis: GBP/USD Rebounds CautiouslyMarket Analysis: GBP/USD Rebounds Cautiously
GBP/USD is attempting a recovery wave above the 1.3215 resistance.
Important Takeaways for GBP/USD Analysis Today
- The British Pound is attempting a fresh increase above 1.3265.
- There is a contracting triangle forming with resistance at 1.3375 on the hourly chart of GBP/USD.
GBP/USD Technical Analysis
On the hourly chart of GBP/USD, the pair declined after it failed to clear the 1.3600 resistance. As mentioned in the previous analysis, the British Pound even traded below the 1.3350 support against the US Dollar.
Finally, the pair tested the 1.3140 zone and is currently attempting a fresh increase. The bulls were able to push the pair above the 50-hour simple moving average and 1.3215. The pair even climbed above the 1.3265 level.
The bulls were able to push the pair above the 50% Fib retracement level of the downward move from the 1.3385 swing high to the 1.3141 low.
On the upside, the GBP/USD chart indicates that the pair is facing resistance near 1.3375. There is also a contracting triangle forming with resistance at 1.3375 and the 76.4% Fib retracement level of the downward move from the 1.3385 swing high to the 1.3141 low.
The next major resistance is near 1.3385. A close above the 1.3385 resistance zone could open the doors for a move toward 1.3450. Any more gains might send GBP/USD toward 1.3550.
On the downside, there is decent support forming at 1.3265. If there is a downside break below 1.3265, the pair could accelerate lower. The first major support is near the 1.3215 level. The next key support is seen near 1.3140, below which the pair could test 1.3050. Any more losses could lead the pair toward 1.3000.
This article represents the opinion of the Companies operating under the FXOpen brand only. It is not to be construed as an offer, solicitation, or recommendation with respect to products and services provided by the Companies operating under the FXOpen brand, nor is it to be considered financial advice.

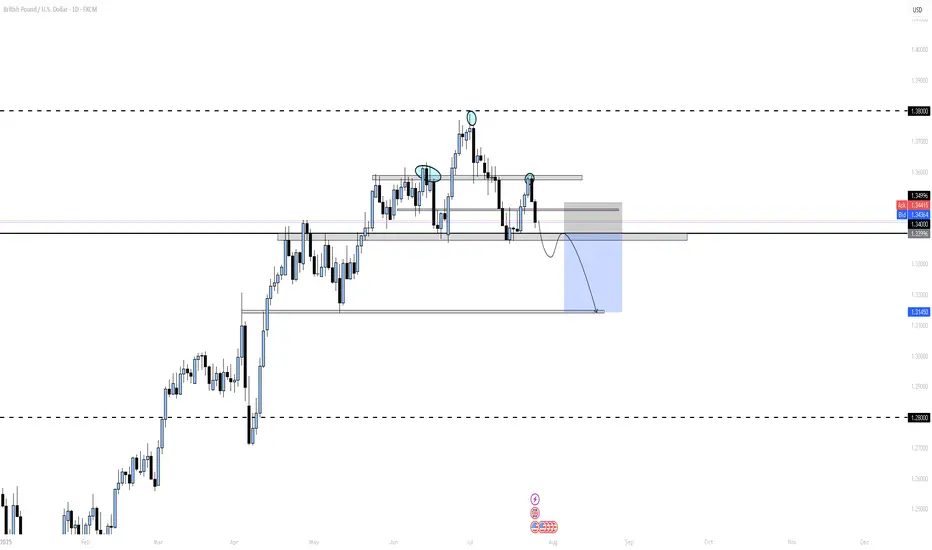
GBPUSD Technical Overview GBPUSD Technical Overview
GBPUSD recently peaked at 1.3790, aligning with a key historical resistance zone from October 2021. On the Daily Chart, this move completed a significant bearish pattern, suggesting the potential for further downside.
Over the last 7 trading sessions, the pair has declined nearly 400 pips, moving decisively lower.
Given the steep drop, a technical correction may be on the horizon before GBPUSD potentially resumes its bearish trajectory, as indicated by the current chart setup.
If NFP data can be strong today, GBPUSD could extend to the first target 1.3100 or 1.3000 as shown in the chart.
Overall, GBPUSD looks like it has started a downtrend.
Let's see how the price will unfolds.
You may find more details in the chart!
Thank you and Good Luck!
PS: Please support with a like or comment if you find this analysis useful for your trading day
Disclosure: I am part of Trade Nation's Influencer program and receive a monthly fee for using their TradingView charts in my analysis.

GBPUSD Will Go Higher From Support! Long!
Take a look at our analysis for GBPUSD.
Time Frame: 1h
Current Trend: Bullish
Sentiment: Oversold (based on 7-period RSI)
Forecast: Bullish
The market is approaching a key horizontal level 1.328.
Considering the today's price action, probabilities will be high to see a movement to 1.336.
P.S
We determine oversold/overbought condition with RSI indicator.
When it drops below 30 - the market is considered to be oversold.
When it bounces above 70 - the market is considered to be overbought.
Disclosure: I am part of Trade Nation's Influencer program and receive a monthly fee for using their TradingView charts in my analysis.
Like and subscribe and comment my ideas if you enjoy them!

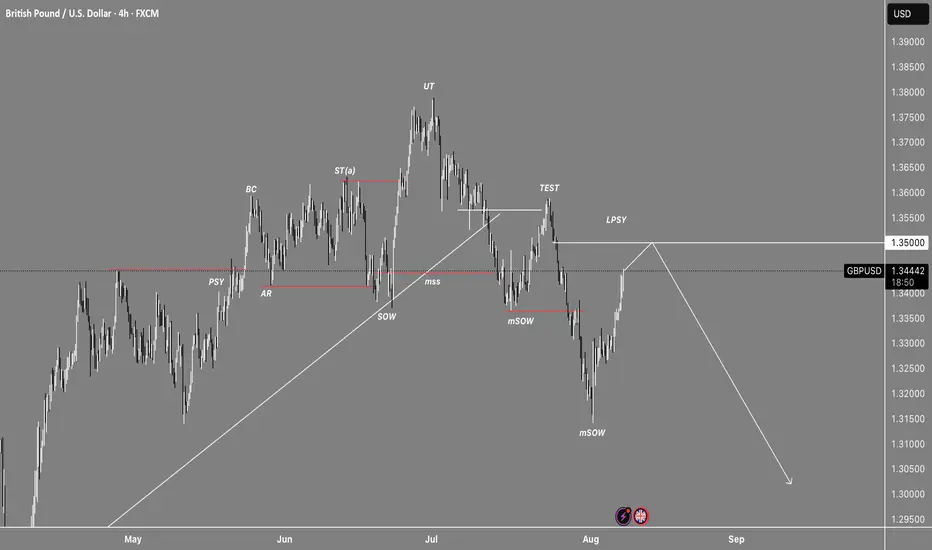
Understanding Trend Reversals: Switch Levels & Peak Formations EAs traders, one of our biggest challenges is identifying the trend and recognizing when it's rolling over to form a peak formation. In this video, I’ll give you a quick yet powerful introduction to the theory behind switch levels and peak formations — key concepts for understanding trend strength, spotting reversal zones, and determining when a high or low is potentially locked in.
Whether you’re a beginner or refining your strategy, this video will help you better develop your bias by recognizing when a trend is losing momentum.
📌 Topics Covered:
What are Switch Levels?
Identifying Peak Formations
How to Confirm a Locked-In High or Low
Reading Trend Strength and Shift Signals

Fibo cluster on GBPUSD short position 70+161 fibo cluster short sell tit sl the close of 4h candle above the cluster zone

GBP/USD Short Bias – Bearish Fundamentals + Smart Money StructurThe macro environment continues to favor USD strength and GBP weakness, setting up a clean short scenario both fundamentally and technically.
Fundamentals First:
Bank of England is expected to cut rates in the coming months as inflation falls and growth slows. June CPI came in lower than expected, and consumer spending remains weak.
UK GDP growth is flatlining, and PMI data continues to signal contraction in services and manufacturing.
IMF has warned the UK about fiscal imbalances and productivity issues, adding bearish pressure to GBP outlook.
Meanwhile, the Fed remains on hold, with strong U.S. labor data, robust consumer spending, and persistent core inflation — supporting the USD.
Institutional Outlook:
JPMorgan and Citi see GBP/USD downside risks as BoE policy shifts from restrictive to accommodative.
ING and BofA have noted bearish positioning building in GBP against the USD.
Technical Setup:
On the 4H chart, we’re watching a clean Head & Shoulders structure
A break and retest of the neckline confirms downside continuation.
Setup is backed by:
Institutional sentiment
Macro data divergence (UK vs U.S.)
Smart money structure + liquidity zones
GBPUSD Will Grow! Long!
Please, check our technical outlook for GBPUSD.
Time Frame: 12h
Current Trend: Bullish
Sentiment: Oversold (based on 7-period RSI)
Forecast: Bullish
The market is approaching a significant support area 1.344.
The underlined horizontal cluster clearly indicates a highly probable bullish movement with target 1.358 level.
P.S
The term oversold refers to a condition where an asset has traded lower in price and has the potential for a price bounce.
Overbought refers to market scenarios where the instrument is traded considerably higher than its fair value. Overvaluation is caused by market sentiments when there is positive news.
Disclosure: I am part of Trade Nation's Influencer program and receive a monthly fee for using their TradingView charts in my analysis.
Like and subscribe and comment my ideas if you enjoy them!

GBPUSD SELL SETUP ROOOOCK SHOOOOOOOOOOOOORTGBPUSD in descending channel and it on strong resistance zone
and momentum started to weak
and can't make higher high
so shortly I will sell but after confirmation
and sure from this photo
