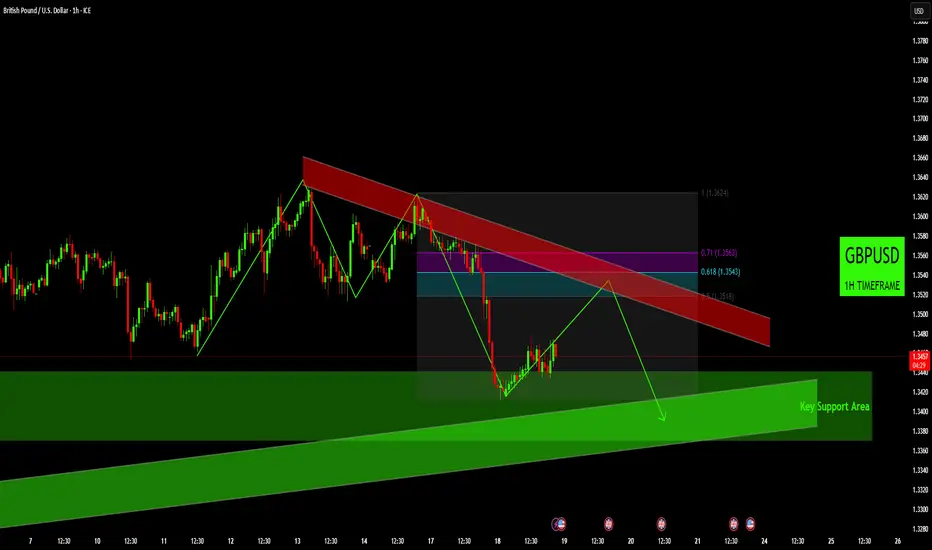
GBPUSD 1H OutlookGBPUSD 1H Chart: Technical Analysis of Bearish Channel and Key Support
Bearish Channel and Price Structure: The chart illustrates an initial bullish move followed by the formation of a descending red channel, suggesting a shift in short-term momentum to bearish. Price recently broke down from an earlier ascending structure, confirming a potential change in trend dynamics. The current price action shows a retracement back towards the upper boundary of this bearish channel and previous resistance levels.
Resistance Zone Confluence: The red-shaded area at the top represents a significant supply zone, indicating an area where sellers have previously dominated. This zone also converges with the upper boundary of the newly formed descending red channel, creating a strong confluence of resistance where selling pressure is anticipated to emerge.
Fibonacci Retracement Levels: A Fibonacci retracement tool has been applied from the recent high (1.3624) to the recent low. The key retracement levels of 0.5 (1.3518), 0.618 (1.3543), and 0.71 (1.3563) fall within or immediately below the identified red resistance channel. These levels are often watched by traders as potential turning points or areas of re-accumulation/distribution.
Key Support Area & Target Zone: Below the current price, a wide green-shaded "Key Support Area" is identified, stretching from approximately 1.3440 down towards 1.3360. This zone likely represents a significant demand area where buyers are expected to re-enter the market, potentially serving as a target for a continued bearish move or a strong bounce point.
Disclaimer:
The information provided in this chart is for educational and informational purposes only and should not be considered as investment advice. Trading and investing involve substantial risk and are not suitable for every investor. You should carefully consider your financial situation and consult with a financial advisor before making any investment decisions. The creator of this chart does not guarantee any specific outcome or profit and is not responsible for any losses incurred as a result of using this information. Past performance is not indicative of future results. Use this information at your own risk. This chart has been created for my own improvement in Trading and Investment Analysis. Please do your own analysis before any investments.
USDGBP trade ideas
SELL GBPUSDGBP/USD is at a critical inflection point, stalling in a powerful resistance zone. If bears take control, a drop toward 1.2150 or lower is likely. Confirmation via breakdown and strong bearish candlesticks is key for high-probability short entries.

Holding Strong Above Historic Highs — Long Setup in PlayGBP/USD is holding beautifully above a historical high.
From here, it’s a great spot for a long position with a stop just below yesterday’s candle low, around the 1.3400 level. With a small risk of only 0.40%, the upside potential is at least the previous highs (+1.30%) and possibly higher — I’m targeting a move toward 1.38.
Great risk/reward setup. Long is on!

GBPUSD LongPrice recently swept a short-term liquidity high, triggering a reaction that indicates a potential shift in momentum. This move has not yet mitigated the most recent demand zone that formed after the previous structural break to the upside. The internal structure suggests an imbalance in the price leg leading into the recent high, creating space for a corrective move lower.
As a result, we may anticipate a short-term decline — a retracement intended to rebalance price and collect remaining sell-side liquidity beneath recent intra-session lows. Once this corrective move completes, we expect the bullish order flow to resume, supported by higher-timeframe directional bias and continued displacement favoring buyers.
Traders should monitor for signs of internal structure shift or liquidity sweep during the pullback phase as potential signals to position with the bullish continuation.

Analyse Chart: GBP/USD – Key Levels & Price Forecast📈 Analyse Chart: GBP/USD – Key Levels & Price Forecast (June 18, 2025)
🗺️ Overview
This chart shows GBP/USD in a critical technical setup. The price has just reacted to a significant support zone after a strong rejection from a resistance area, suggesting a potential reversal—or further downside if support fails.
🔍 Key Zones
Resistance Zone: 1.3600 – 1.3670
Price was rejected here twice (indicated by arrows), forming a double-top pattern.
Support Zone: 1.3400 – 1.3450
Price found buyers here again, after a steep decline.
🧠 Market Structure
The current structure shows a sharp bearish leg followed by stabilization at support.
Price is hovering near 1.3458, slightly above the support zone, forming small indecisive candles (possible accumulation).
📊 Scenario Analysis
🔼 Bullish Scenario (Preferred Path)
Setup: Price forms a higher low or double bottom within the support zone.
Trigger: Bullish breakout above 1.3480–1.3500
Target:
Short-term: 1.3550
Medium-term: 1.3600 – 1.3670 (resistance retest)
🔽 Bearish Scenario (Failure of Support)
Setup: Clean break and close below 1.3400
Trigger: Retest of broken support as resistance
Target:
Short-term: 1.3320
Extended: 1.3260
Reasoning: Would signal trend continuation and invalidation of bullish structure
📅 Event Risk
Several high-impact economic events (GBP & USD) are approaching.
Expect volatility—ideal setups may occur after data releases.
🧭 Professional Outlook
Bias Confirmation Needed Entry Zone SL TP Range
Bullish Rejection + bullish breakout 1.3400–1.3450 Below 1.3380 1.3550 → 1.3670
Bearish Daily close below 1.3380 Retest near 1.3400 Above 1.3430 1.3320 → 1.3260

GBPUSD - Bearish SignalStory : Market has broken the consolidation zone (previous Support) and then moved with strong bear rally. market took a corrective move uptil a FIB level of 0.382 and then retraced back for the bearish rally again. Futher market has also formed Bearish Continuation pattern which is a good confluence for bears to hold.
Anticipate : we anticipate market to continue bearish as there is no divergence / reversal pattern / harmonic pattern.
PLAN : we plan to enter into market with patience with a sellstop level of 1.34150 with a STOPloss placed above LH
TPs are placed accordingly with RR of 1:1 and 1:2

GBPUSD Set To Grow! BUY!
My dear friends,
My technical analysis for GBPUSD is below:
The market is trading on 1.3462 pivot level.
Bias - Bullish
Technical Indicators: Both Super Trend & Pivot HL indicate a highly probable Bullish continuation.
Target - 1.3528
Recommended Stop Loss - 1.3421
About Used Indicators:
A pivot point is a technical analysis indicator, or calculations, used to determine the overall trend of the market over different time frames.
Disclosure: I am part of Trade Nation's Influencer program and receive a monthly fee for using their TradingView charts in my analysis.
———————————
WISH YOU ALL LUCK

GBPUSD Despite current market trends, the truth is that there's high potential for an upward move to snag some liquidity. Keep an eye out!

GBPUSD SellDaily cycle. And many other factors as well. Price induced and may head lower to take out Asia low.

GBP/USD 3H CHART PATTERN.GBP/USD on the 3-hour timeframe, here’s the analysis and potential target zones derived from the chart:
📉 Current Trend:
The market has broken down from an ascending channel.
Price retested the support-turned-resistance zone around 1.35060, confirming bearish momentum.
Ichimoku Cloud is above price — supporting bearish bias.
---
🎯 Targets Based on the Chart:
1. First Target (1st Support Zone):
Level: Approximately 1.33449
This is your first major support zone marked on the chart — expect a possible reaction or consolidation here.
2. Second Target (2nd Support Zone):
Level: Approximately 1.32800
This is the second support zone — if price breaks below 1.33449, this becomes the next logical bearish target.
---
🔍 Summary:
Sell below: 1.3450
Target 1: 1.3345
Target 2: 1.3280
Stop-loss suggestion: Above the resistance zone ~1.3506
Let me know if you want SL/TP values based on pips, risk %, or a strategy adjustment.

GBPUSD TRADE UPDATE For the record, our GBPUSD setup didn't go according to plan.
The market did its thing

GBPUSD London ShortsWhat I see and we could have one massive push down to setup a mid reversal today/tomorrow

GBP/USD Hits June LowGBP/USD Hits June Low
As the GBP/USD chart shows, the pair dropped sharply last night, falling below the 1.34170 level. This move marked the lowest point for the pound against the dollar since the beginning of June.
One of the main drivers behind this decline is the strengthening of the US dollar, which is attracting market participants amid heightened geopolitical tensions and a potential escalation of military conflict between Iran and Israel, involving US armed forces. According to the latest reports, Donald Trump has warned Tehran that US patience is wearing thin.
Today, however, the pound has seen a slight rebound, supported by the release of the UK Consumer Price Index (CPI). While the data confirmed that inflation is easing, the pace of decline is slower than expected. This may reduce the likelihood of interest rate cuts by the Bank of England – which in turn has boosted the pound’s value.
What could happen next?
Technical Analysis of the GBP/USD Chart
Since the end of May, price fluctuations have formed an ascending channel (shown in blue), with bulls making several attempts to break the resistance level at 1.3600 – so far, without much success.
The sharp decline from point A to B suggests that the bears have seized the initiative, with the pair rebounding from the lower boundary of the blue channel.
GBP/USD traders may:
→ interpret the bounce from the lower blue boundary as an upward correction following a sharp fall;
→ use Fibonacci retracement levels to estimate potential upside. In such cases, particular attention is typically given to the 0.5–0.618 zone (highlighted in orange). Here, it aligns with the 1.3526 level, which acted as support on 12–13 June, but may now serve as resistance after being breached.
This article represents the opinion of the Companies operating under the FXOpen brand only. It is not to be construed as an offer, solicitation, or recommendation with respect to products and services provided by the Companies operating under the FXOpen brand, nor is it to be considered financial advice.

Long trade
📍 Pair: GBPUSD
📅 Date: Tuesday, June 17, 2025
🕒 Time: 3:00 PM (NY Session PM)
⏱ Time Frame: 1 Hour
📈 Direction: Buyside
📊 Trade Breakdown:
Entry Price 1.34293
Profit Level 1.35653 (+1.01%)
Stop Loss 1.34086 (−0.15%)
Risk-Reward
Ratio 6.57 : 1
🧠 Context / Trade Notes:
Higher Timeframe Confluence:
Trade took off a 1-hour bullish order block following consistent higher highs and higher lows.
Choch + BOS Confirmed:
Clear change of character and break of structure gave the green light for a continuation long.

GBPUSD Bullish After Long Falls Pattern FormedGBPUSD Technical Outlook:
After a prolonged bearish trend, GBPUSD may now be preparing for a potential bullish reversal, driven by weakening momentum in the U.S. Dollar. The pair is currently trading around the 1.34350 level.
If bullish pressure builds from this level, we could see the start of a short-to-medium term uptrend. The next key target levels to watch are:
Key Resistance
1st 1.35100
2nd 1.35500
3rd 1.36000
after the Long bearish Pattern we could see Bullish Zone and remember all thing in your mind if the price will does no up from current level the hit the support Levels 1.33900 then we could see price will grow again lets see and share out idea what did you know about GBPUSD Price?


The Fundamental Truths About a Trending MarketBefore you can trade successfully, you must first understand what defines a market trend.
🔼 What is an Uptrend?
An uptrend is characterised by a series of Higher Highs (HH) and Higher Lows (HL). This signals that buyers are in control and price is climbing steadily.
🔽 What is a Downtrend?
A downtrend is identified by a series of Lower Lows (LL) and Lower Highs (LH). This indicates that sellers are dominant and price is consistently falling.
📌 Important Facts About a Trending Market
Trends don’t change easily. Once a trend is established, it tends to persist.
A trend reversal takes time and effort. It doesn't happen abruptly — the market needs a strong reason to change direction.
There are always warning signs. Before a trend changes, there’s usually a pattern or shift in behaviour that acts as a clue.
The bigger the trend, the longer it takes to reverse. A well-established trend will require more time and evidence before it breaks.
🎯 Keys to Trading Any Market Successfully
Identify the market condition.
Is the market trending upwards, downwards, or moving sideways (consolidating)?
Study price behaviour at key levels.
Understand how price reacts at significant highs and lows.
Learn the anatomy of price waves.
Recognise wave structure — how price expands and contracts in trends.
Align your trades with the market condition.
Your entry and exit strategies should fit the current phase of the market.
🔚 Summary
Mastering trends is one of the most important skills in trading. When you understand what defines an uptrend or downtrend, recognise when a trend may be ending, and align your strategy with the market condition, you set yourself up for consistent success. Patience, observation, and timing are key — because the market always leaves clues, but only for those who are prepared to see them.

Sterling Flat Before BoE and Fed Policy DecisionsGBP/USD trades near 1.3435 on Wednesday, steadying after a 1.2% drop Tuesday amid rising geopolitical tensions and safe-haven dollar demand.
The pound stays under pressure ahead of today’s UK inflation report and tomorrow’s BoE decision, where rates are expected to remain at 4.25%. Any inflation surprise could shift market expectations.
Ongoing Middle East conflict continues to support the dollar, while traders also await the Fed’s policy announcement later today, which could influence GBP/USD further.
Resistance is at 1.3600, with support around 1.3425.
GBPUSD short for ~100pipsEntering now with small position. If price recovers before continue to fall, enter another position at around 1.3580/1.3600
SL 1.3630
TP 1.3450

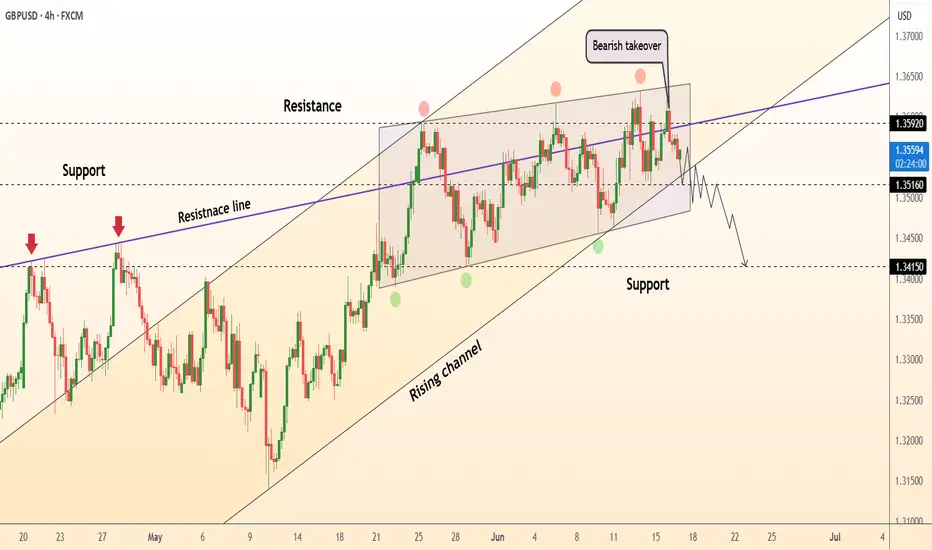
DeGRAM | GBPUSD moving in the rising wedge📊 Technical Analysis
● A five-week rectangle at the channel top has broken south after a bearish engulfing, turning 1.3550 into fresh supply; the break also pierces the inner purple resistance line that capped every rally since April.
● Momentum now points to the channel mid-band/May swing low at 1.3516; loss of that neckline activates the measured move toward the lower rail and horizontal support at 1.3415.
💡 Fundamental Analysis
● Pre-BoE election-period caution and firmer post-FOMC USD yields have widened the short-term gilt–UST spread, draining bid tone from sterling.
✨ Summary
Sell 1.3530-1.3560; break below 1.3516 targets 1.3415. Bear view invalidated on an H4 close above 1.3592.
-------------------
Share your opinion in the comments and support the idea with a like. Thanks for your support!
GBPUSD may form a false break of supportGBPUSD has wasted the entire daily move (ATR) and is forming a false break of the mirror level support and trading range support. The price fell on the background of the dollar growth (which is trading on the background of the global downtrend)
Now, while the price is consolidating below the mirror level, sellers (physical persons) open deals. But, based on the situation and spent ATR when the price returns inside the range there will be a liquidation stage, which can provoke the price growth
The price fixing above 1.34437 may be the beginning of a pullback (trend growth).
Scenario: if the decline does not continue, and the price is able to consolidate above 1.3448, in this case we can expect a correction to 1.35, 1.353.

GBPUSD SHORT FORECAST Q2 W25 D18 Y25GBPUSD SHORT FORECAST Q2 W25 D18 Y25
Professional Risk Managers👋
Welcome back to another FRGNT chart update📈
Diving into some Forex setups using predominantly higher time frame order blocks alongside confirmation breaks of structure.
Let’s see what price action is telling us today!
💡Here are some trade confluences📝
✅Weekly order block
✅15' order block
✅Intraday 15' break of structure
✅Tokyo ranges to be filled
🔑 Remember, to participate in trading comes always with a degree of risk, therefore as professional risk managers it remains vital that we stick to our risk management plan as well as our trading strategies.
📈The rest, we leave to the balance of probabilities.
💡Fail to plan. Plan to fail.
🏆It has always been that simple.
❤️Good luck with your trading journey, I shall see you at the very top.
🎯Trade consistent, FRGNT X

What to Watch For Next!💡 GBPUSD Bearish Trade Outlook – Detailed Analysis
The GBPUSD pair has recently shown a clear Market Structure Shift (MSS) to the downside — a strong sign that bearish momentum may be taking control. Alongside this shift, we’ve also seen the formation of a Bearish Fair Value Gap (FVG) on the 4-hour timeframe, which adds further confluence to the potential for continued downside.
📍 What This Means:
The break in structure combined with the FVG suggests that institutional activity may be driving price lower, possibly targeting areas of untapped liquidity beneath previous lows. These are often high-probability setups when traded with confirmation.
🔎 What to Watch For Next:
At this point, it's best to wait patiently for the price to retrace into the 4H FVG zone. Once price taps this area, we should closely monitor lower timeframes (such as 15M or 5M) for bearish confirmation entries — like a bearish engulfing pattern, change in character (ChoCH), or internal MSS.
📉 Potential Trade Idea:
If confirmation occurs, we can look to enter a sell position, targeting downside liquidity levels, such as previous swing lows or equal lows — where the market often hunts liquidity.
⚠️ Risk Reminder:
As always, avoid entering blindly. Let the market give you a clear sign. Use proper risk management, and stick to your strategy.
📚 DYOR – Do Your Own Research!
The market doesn’t guarantee outcomes. Your own analysis, patience, and discipline are your best tools.
