GBPUSD Support & Resistance Levels🚀 Here are some key zones I've identified on the 15m timeframe.
These zones are based on real-time data analysis performed by a custom software I personally developed.
The tool is designed to scan the market continuously and highlight potential areas of interest based on price action behavior and volume dynamics.
Your feedback is welcome!
USDGBP trade ideas

GBPUSD SHORTMarket structure bearishh on HTFs 3
Entry at both Weekly and Daily AOi
Weekly Rejection at AOi
Previous Weekly Structure Point
Daily Rejection at AOi
Daily EMA retest
Around Psychological Level 1.34500
H4 EMA retest
H4 Candlestick rejection
Rejection from Previous structure
Levels 5.02
Entry 115%
REMEMBER : Trading is a Game Of Probability
: Manage Your Risk
: Be Patient
: Every Moment Is Unique
: Rinse, Wash, Repeat!
: Christ is King.

GBPUSD Week 30 Swing Zone/LevelsPEPPERSTONE:GBPUSD is expected to trend upward from the 1.34032 level towards the resistance zone. Whether it breaks through or reverses downward will ultimately depend on market players.
This projection is based on a forward-looking metric analysis, which explains why the zones are not derived from historical price action on the left side of the chart, as is common in traditional technical analysis. However, the daily candles from previous weeks still contribute meaningfully to this outlook.

GBPUSD Long Idea – Betting Against the Buck’s Big BluffThe US dollar might talk tough, but it’s walking on shaky ground. With debt fears climbing and the Fed leaning toward cuts, the greenback’s grip is loosening — and GBPUSD looks primed to ride the wave. 🌊
I’m bullish on GBPUSD.
Here’s why I’m going long:
✅ The Fed is expected to cut rates twice in 2025 and again in 2026
📉 The Dollar Index (DXY) has already fallen 11% YTD — momentum is down
🧨 Tariff drama with the EU and Mexico is spooking markets
📊 Sentiment is clearly bearish — even big banks are forecasting more USD weakness
💬 Trump’s rhetoric is creating volatility without lasting strength
The dollar’s reputation as a safe haven is fading fast. Sure, it still gets a knee-jerk boost on scary headlines — but the deeper trend shows erosion. With the Fed stepping away from hikes and signaling multiple cuts, yields are less attractive. And when US assets aren’t pulling in investors, the dollar suffers.
Meanwhile, GBP is holding firm. UK political risk is muted, and GBP tends to benefit when the USD stumbles. The setup here isn’t just about GBP strength — it’s about USD weakness. Add in rising global risk appetite and clearer policy direction from the Bank of England, and the case for GBPUSD upside becomes compelling.
DXY is telling a story — and it’s one of slow decay. GBPUSD, in contrast, is quietly building momentum.
📌 I’m long GBPUSD with a medium-term view.
Would you take this trade or wait for more confirmation? Let me know your thoughts.

GBPUSD Under Pressure! SELL!
My dear subscribers,
GBPUSD looks like it will make a good move, and here are the details:
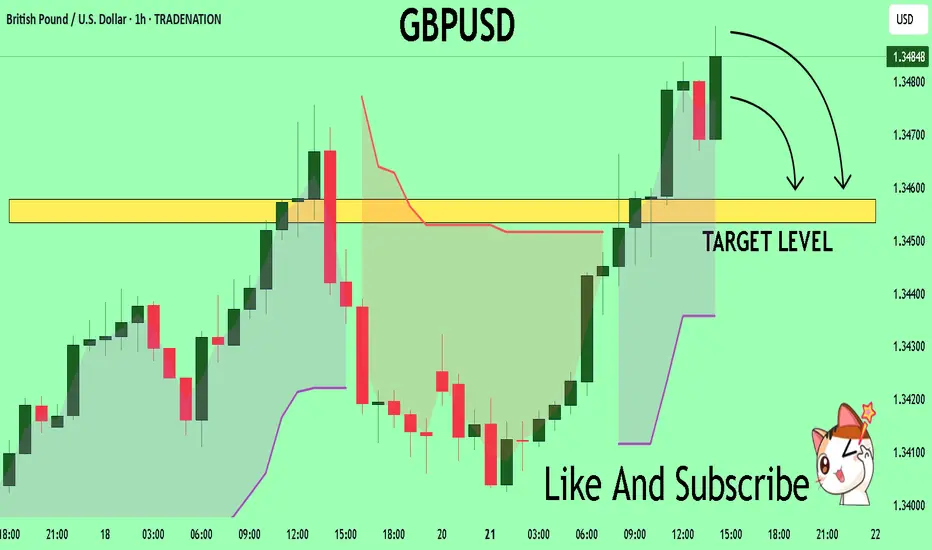
The market is trading on 1.3483 pivot level.
Bias - Bearish
Technical Indicators: Both Super Trend & Pivot HL indicate a highly probable Bearish continuation.
Target - 1.3457
About Used Indicators:
The average true range (ATR) plays an important role in 'Supertrend' as the indicator uses ATR to calculate its value. The ATR indicator signals the degree of price volatility.
Disclosure: I am part of Trade Nation's Influencer program and receive a monthly fee for using their TradingView charts in my analysis.
———————————
WISH YOU ALL LUCK
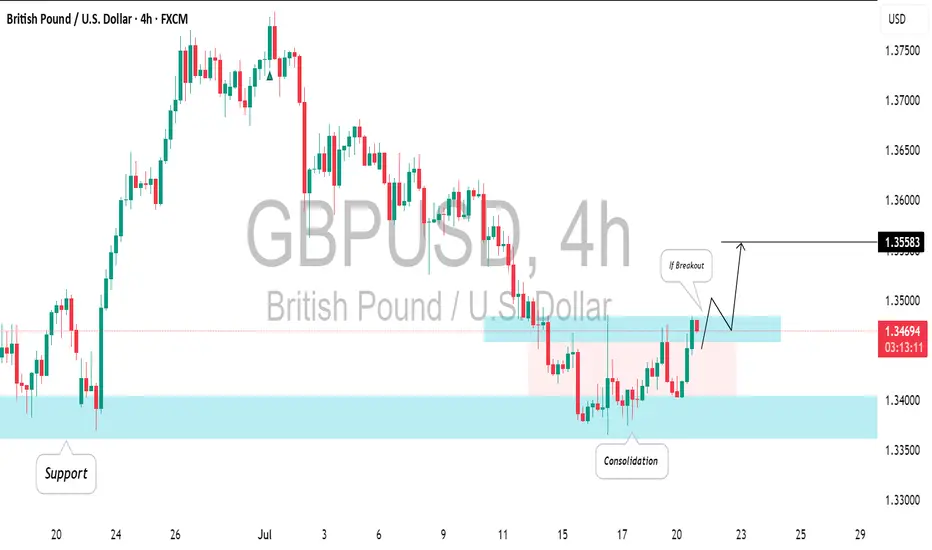
GBPUSD: Your Trading Plan For Today ExplainedThe GBPUSD is currently consolidating at a solid intraday/daily support level.
To enter a buy position with confirmation, it's advisable to wait for a breakout on the 4-hour chart.
A breakout followed by a 4-hour candle closing above the horizontal resistance will serve as a strong bullish signal, with a target of 1.3558.
Conversely, if the price makes a new lower low on the 4-hour chart, this setup will be considered invalid.
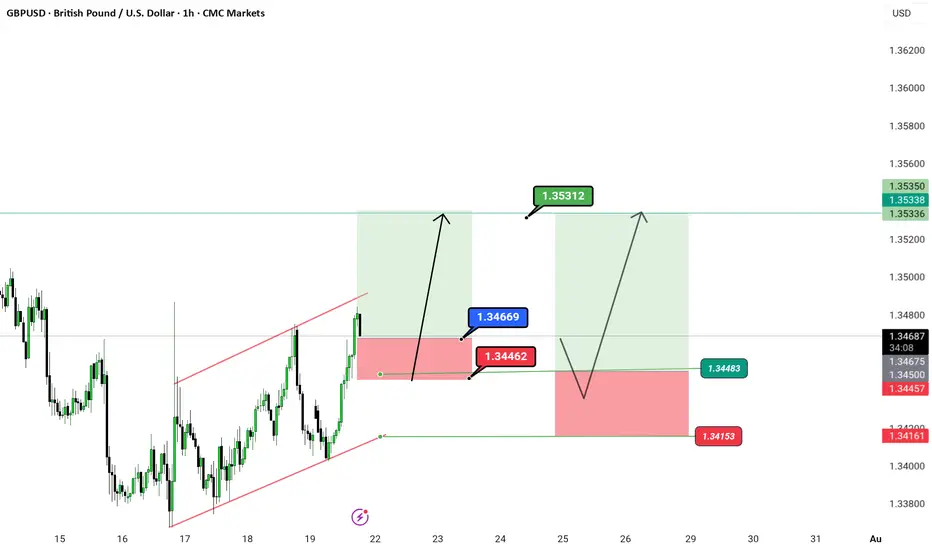
GBP/USD – Clean Breakout Play We just broke structure on the 1H. Simple setup, clean price action. Nothing complicated.
📍 Breakout Zone: 1.34669
✅ Target 1: 1.35312
✅ Target 2: 1.35350
❌ Stop Loss: 1.34462
⛔ Invalidation Level: 1.34153
🧠 Price broke out of the red channel and retested — now it's game on. If we stay above structure, next move is liquidity grab at the highs.
This is how you trap the market before it traps you.
🕒 Timeframe: 1H
⚙️ Strategy: Channel Breakout + Retest Confirmation

GBP/USD – Breakout bullish bias O_o🎉 GBP/USD – Breakout Party Above the Channel! 🎉
Pound-Dollar just said “bye-bye” to the red channel and is getting ready to dance its way up 💃💵
We have a clean breakout with two possible flight paths 🚀:
📍 Entry Zone: Around 1.34669
🎯 Targets:
1️⃣ 1.35312
2️⃣ 1.35350 (Double top zone – watch this closely 👀)
🛑 Stop Loss: 1.34462
❗ Invalidation below: 1.34153
📐 Structure: Parallel channel breakout 💥
📆 Timeframe: 1H
📌 Chart by: @greenfire_forex
🧠
---
#GBPUSD #ForexTrading #BreakoutSetup
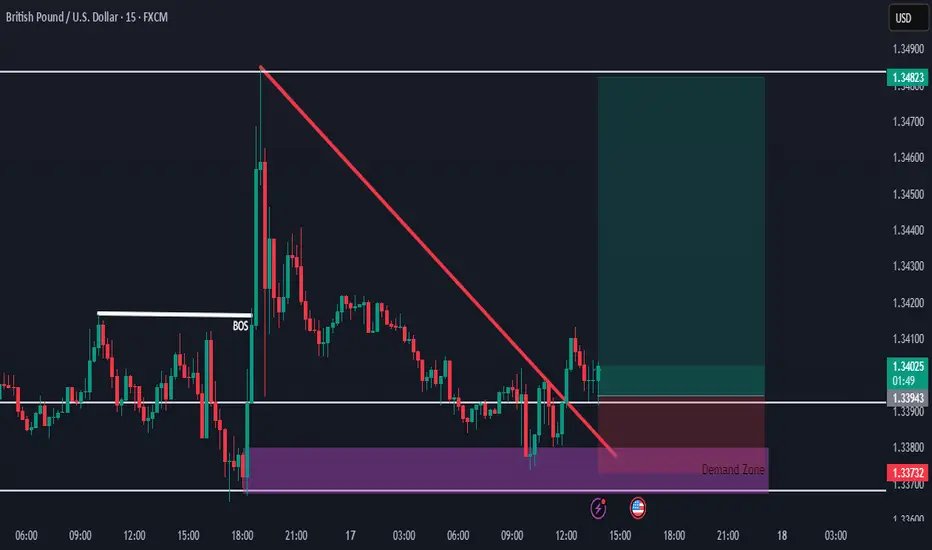
GBPUSD Buy Setup from Strong Demand ZoneHello everybody!
Price is in a higher timeframe demand zone, which is very strong and a good place to buy.
We were waiting patiently for confirmation, and now we have two key signals:
1- After a break of structure in the market, a small demand zone has formed.
2- The break of the downward trendline is where we entered the buy position.
Possibility of correction A trend reversal is expected at the green resistance area and the downtrend is expected to continue. With a consolidation above the resistance area, the above scenario will be invalidated.

Pound Pressured by Rising UK Jobless RateGBP/USD started the week steady, trading just above 1.3400 during the Asian session and holding near last week’s two-month low. The US Dollar remains soft below Thursday’s monthly peak, as markets weigh the prospects of a Fed rate cut. Although Fed Governor Waller backed a July cut, most investors expect the Fed to keep rates higher for longer due to Trump’s tariffs impacting consumer prices.
The British Pound is under pressure as markets price in a potential Bank of England rate cut in August. UK labor data showed unemployment rising to 4.7%, a four-year high, and annual pay growth slowing to 5%, the weakest since Q2 2022. This limits GBP/USD upside despite persistent inflation.
For GBP/USD, resistance is seen at 1.3535, with the next levels at 1.3580 and 1.3630. Support stands at 1.3380, followed by 1.3270 and 1.3140.

GBPUSD for short*The content on this analysis is subject to change at any time without notice, and is provided for the sole purpose of assisting traders to make independent investment decisions.


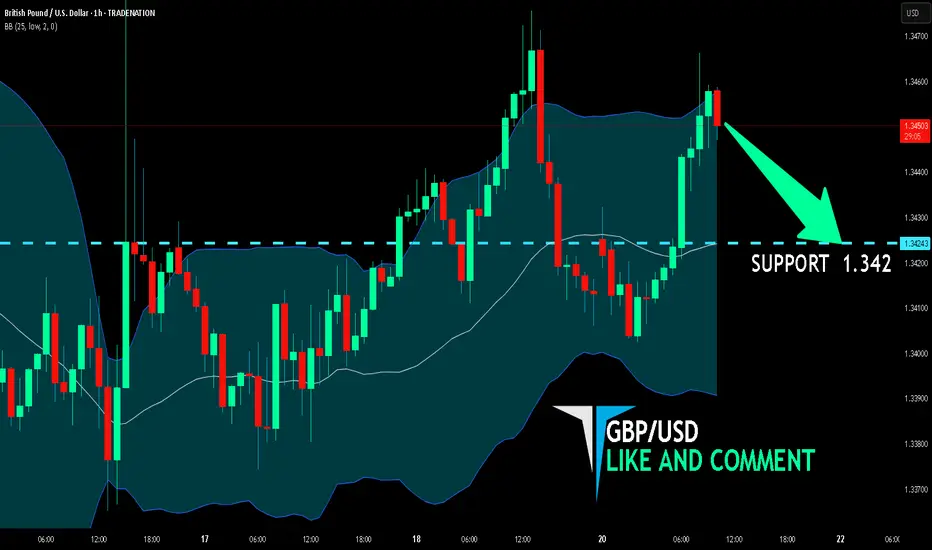
GBP/USD BEARISH BIAS RIGHT NOW| SHORT
Hello, Friends!
We are targeting the 1.342 level area with our short trade on GBP/USD which is based on the fact that the pair is overbought on the BB band scale and is also approaching a resistance line above thus going us a good entry option.
Disclosure: I am part of Trade Nation's Influencer program and receive a monthly fee for using their TradingView charts in my analysis.
✅LIKE AND COMMENT MY IDEAS✅
Bullish Momentum Builds Above $1.3475 for GBP/USDFenzoFx—GBP/USD is testing the descending trendline as resistance. The primary trend is bullish, and if bulls close and stabilize above $1.3475, the uptrend will likely resume.
If this scenario unfolds, the next bullish target could be the resistance at $1.3525. Please note that the bullish outlook should be invalidated if GBP/USD closes and stabilizes below $1.3369.

GBPUSD Long Opportunity – Inverted Head & Shoulders PatternGBPUSD is currently forming a classic Inverted Head & Shoulders pattern on the 1-hour timeframe — a powerful trend reversal signal that typically marks the shift from bearish to bullish momentum. The structure is clear, with a defined left shoulder, head, and right shoulder, and price now approaching the neckline resistance around 1.3488–1.3495.
Traders should now shift focus to two key confirmation events:
A neckline breakout
A successful retest of the neckline with a bullish reversal candle (e.g., bullish engulfing)
🔍 Trade Plan (Long Setup)
Entry: After 1H candle closes above neckline (~1.3490), wait for a retest of the breakout
Enter long on bullish confirmation candle during the retest
Stop Loss: Below the swing low of the retest (around 1.3440–1.3450)
Risk/Reward Ratio: ~5.5:1
🎯 Target Zones:
TG1: 1.3540 (Minor Resistance)
TG2: 1.3585 (Next structure zone)
Final Target: 1.3627+ (Full measured move from pattern)
📌 Confirmation Tips:
Look for bullish candlestick confirmation on neckline retest (bullish engulfing, hammer, or strong rejection wick)
Avoid entering inside the pattern – confirmation is key to reduce false breakouts
⚠️ Note to Traders:
This setup aligns with a possible shift in sentiment for GBPUSD. The pattern is developing against the larger downtrend, so discipline and stop-loss protection are crucial. A successful breakout and retest would suggest a potential short-term bullish reversal with clean upside targets.
🧠 Stay patient. Let the breakout confirm. Execute with structure.
=================================================================
Disclosure: I am part of Trade Nation's Influencer program and receive a monthly fee for using their TradingView charts in my analysis.
=================================================================

Market Analysis: GBP/USD Dips FurtherMarket Analysis: GBP/USD Dips Further
GBP/USD started a downside correction from the 1.3620 zone.
Important Takeaways for GBP/USD Analysis Today
- The British Pound started a fresh decline and settled below the 1.3500 zone.
- There is a connecting bullish trend line forming with support at 1.3415 on the hourly chart of GBP/USD at FXOpen.
GBP/USD Technical Analysis
On the hourly chart of GBP/USD at FXOpen, the pair struggled above the 1.3600 zone. The British Pound started a fresh decline below the 1.3550 pivot level against the US Dollar, as discussed in the previous analysis.
The pair dipped below the 1.3500 and 1.3450 levels. A low was formed at 1.3364 and the pair is now consolidating losses. On the upside, it is facing resistance near the 1.3475 level. The next key resistance is near 1.3490 and the 50% Fib retracement level of the downward move from the 1.3619 swing high to the 1.3364 low.
An upside break above the 1.3490 zone could send the pair toward 1.3520 and the 61.8% Fib retracement level.
More gains might open the doors for a test of 1.3620. If there is another decline, the pair could find support near the 1.3415 level and a connecting bullish trend line. The first major support sits near the 1.3365 zone.
The next major support is 1.3350. If there is a break below 1.3350, the pair could extend the decline. The next key support is near the 1.3320 level. Any more losses might call for a test of 1.3250.
This article represents the opinion of the Companies operating under the FXOpen brand only. It is not to be construed as an offer, solicitation, or recommendation with respect to products and services provided by the Companies operating under the FXOpen brand, nor is it to be considered financial advice.

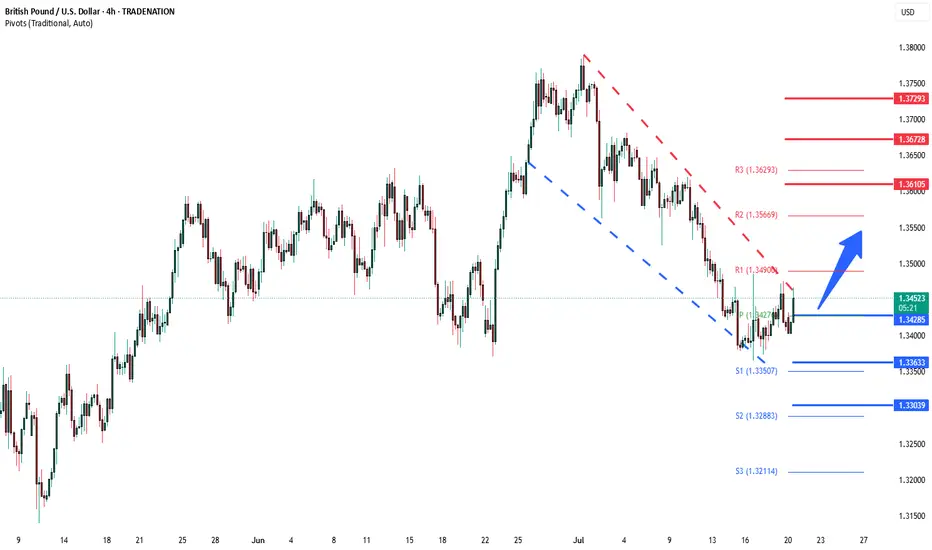
GBPUSD deeper correction supported at 1.3430The GBPUSD remains in a bullish trend, with recent price action showing signs of a corrective pullback within the broader uptrend.
Support Zone: 1.3430 – a key level from previous consolidation. Price is currently testing or approaching this level.
A bullish rebound from 1.3430 would confirm ongoing upside momentum, with potential targets at:
1.3600 – initial resistance
1.3670 – psychological and structural level
1.3730 – extended resistance on the longer-term chart
Bearish Scenario:
A confirmed break and daily close below 1.3430 would weaken the bullish outlook and suggest deeper downside risk toward:
1.3370 – minor support
1.3300 – stronger support and potential demand zone
Outlook:
Bullish bias remains intact while the FTSE holds above 1.3430. A sustained break below this level could shift momentum to the downside in the short term.
This communication is for informational purposes only and should not be viewed as any form of recommendation as to a particular course of action or as investment advice. It is not intended as an offer or solicitation for the purchase or sale of any financial instrument or as an official confirmation of any transaction. Opinions, estimates and assumptions expressed herein are made as of the date of this communication and are subject to change without notice. This communication has been prepared based upon information, including market prices, data and other information, believed to be reliable; however, Trade Nation does not warrant its completeness or accuracy. All market prices and market data contained in or attached to this communication are indicative and subject to change without notice.
The Day AheadEconomic Data & Central Bank Updates
US Leading Economic Index (June)
Fell by 0.1%, pointing to ongoing weakness in manufacturing, jobs, and housing. Markets may view this as a soft growth signal, potentially influencing rate cut expectations.
China Loan Prime Rates (LPR)
No change: 1-year at 3.0%, 5-year at 3.5%. This steady stance follows slightly better Q2 growth, but continued weak domestic demand leaves room for cuts later this year.
Canada Industrial Product Price Index (IPPI) & Raw Materials Price Index (RMPI)
June data expected to remain weak after prior months of declining input prices—keeping inflation pressures subdued.
Bank of Canada Q2 Business Outlook Survey
Sentiment weakened slightly. Firms see stable sales but remain cautious. Inflation expectations eased, but growth outlook is soft.
Earnings Summary
Verizon: EPS ~$1.19, stable wireless trends in focus.
Roper: Strong SaaS growth, margins under watch.
NXP Semiconductors: EPS down YoY, weak chip demand.
Ryanair: Profit doubled to €820m, strong summer outlook.
Domino’s Pizza: Awaiting release; steady U.S. growth expected.
Trading Impacts
USD: Mild bearish bias from soft data.
CNY: Stable; easing risk remains.
CAD: Limited support, weak price data.
This communication is for informational purposes only and should not be viewed as any form of recommendation as to a particular course of action or as investment advice. It is not intended as an offer or solicitation for the purchase or sale of any financial instrument or as an official confirmation of any transaction. Opinions, estimates and assumptions expressed herein are made as of the date of this communication and are subject to change without notice. This communication has been prepared based upon information, including market prices, data and other information, believed to be reliable; however, Trade Nation does not warrant its completeness or accuracy. All market prices and market data contained in or attached to this communication are indicative and subject to change without notice.

GBPUSD → Hunting for liquidity before the fallFX:GBPUSD is forming a countertrend correction towards the liquidity zone amid a correction in the dollar. Are there any chances for a trend break?
The currency pair is taking advantage of the opportunity to test the trend resistance and consolidation amid the dollar correction. Focus on the nearest resistance level of 1.3467, behind which lies a pool of liquidity relative to the local trend.
Based on the overall market sentiment (bearish), a breakout of the 1.3467 resistance could trigger a downward pullback.
Resistance levels: 1.3467
Support levels: 1.3370
If, during the retest of the specified liquidity zone, the market is unable to continue its upward movement and the price returns below the level, we will have a chance to catch a decline within the current trend.
Best regards, R. Linda!

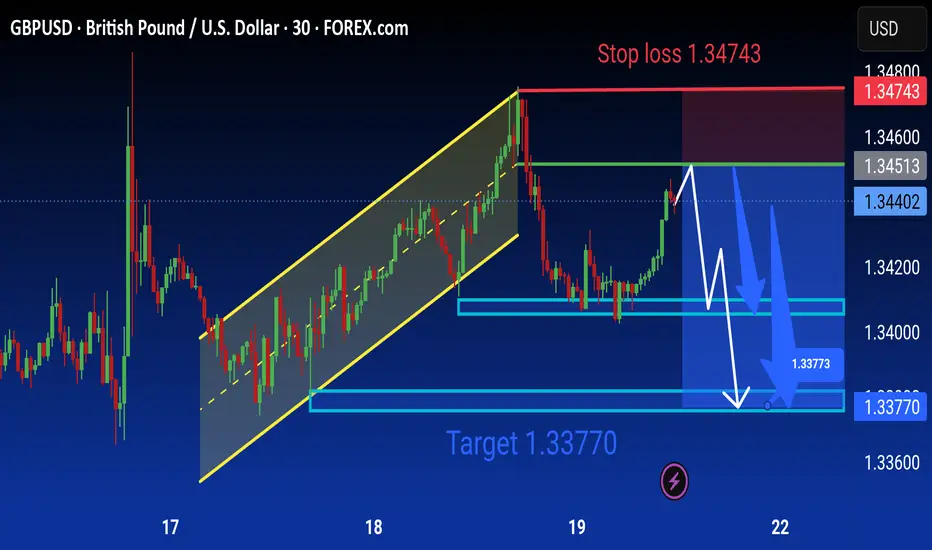
Gbpusd Analysis is Ready Move will be down technical analysis of the GBP/USD (British Pound/US Dollar) currency pair on the 30-minute timeframe using FOREX.com data. Here's a detailed breakdown of the analysis:
---
Chart Summary:
Current Price:
Sell: 1.34401
Buy: 1.34406
Timeframe: 30 minutes (M30)
Platform: TradingView with FOREX.com data
Technical Elements:
1. Ascending Channel (Yellow Parallel Lines):
Price was previously moving in an upward trend within this ascending channel.
The breakout to the downside indicates a potential trend reversal or correction.
2. Bearish Scenario (Blue Arrows):
The chart suggests a short (sell) setup.
Price is expected to face resistance around the 1.34513–1.34600 zone (marked by the green line).
A projected downward move is illustrated with blue arrows, targeting 1.33770.
3. Stop Loss:
Positioned at 1.34743 (highlighted in red), above the recent highs — managing risk for the sell position.
4. Support Zones (Blue Boxes):
First support area near 1.34000
Second, stronger support and main target at 1.33770
5. Target Label:
“Target 1.33770” is clearly marked in blue, showing the final expected move of the sell trade.
6. Forecast Path (White Lines):
Indicates potential short-term bullish pullback before continuing the bearish trend.
---
Trade Idea:
Sell GBP/USD near current resistance
Stop Loss: 1.34743
Take Profit (Target): 1.33770
Bias: Bearish short-term, following the channel breakout
Major Levels Ahead: GBPUSD Trade Setup UnveiledHey friends, I’ve prepared a fresh GBPUSD analysis for you!
📍 Target level: 1.34028
🔻 SELL zone: Between 1.34532 and 1.34437
I expect the trade to reach its target during the London or New York session.
Every like and show of support fuels my motivation to share more analysis—thank you all for being part of this journey!

GBPUSD: Bearish > Bullish Order FlowAlright, we are approaching some Higher Timeframe Points of Interests. We got a Potential Bullish Bat Pattern Pattern this align with this Bullish H4 Order Block, that's right in the middle of an whole number 1.34. We could expect some spikes around the area, some complex pullbacks, but we must remain steady.
