Sell gbpusd Downtrend trend
Bearish trend
Lower lows
Retracement entry
Start of the week
Use proper risk management
Trump era
USDGBP trade ideas
GBP-USD Local Long! Buy!
Hello,Traders!
GBP-USD is about to retest
The horizontal support
Level below at 1.3383
And as this is a strong
Support level we will be
Expecting a local bullish
Rebound and a move up
Buy!
Comment and subscribe to help us grow!
Check out other forecasts below too!
Disclosure: I am part of Trade Nation's Influencer program and receive a monthly fee for using their TradingView charts in my analysis.

GBPUSD M15 I Bearish Reversal Based on the M15 chart, the price could rise toward our sell entry level at 1.3437, a pullback resistance.
Our take profit is set at 1.3377, an overlap support that aligns closely with the 161.8% Fib extension
The stop loss is set at 1.3484, a swing high resistance.
High Risk Investment Warning
Trading Forex/CFDs on margin carries a high level of risk and may not be suitable for all investors. Leverage can work against you.
Stratos Markets Limited (tradu.com ):
CFDs are complex instruments and come with a high risk of losing money rapidly due to leverage. 66% of retail investor accounts lose money when trading CFDs with this provider. You should consider whether you understand how CFDs work and whether you can afford to take the high risk of losing your money.
Stratos Europe Ltd (tradu.com ):
CFDs are complex instruments and come with a high risk of losing money rapidly due to leverage. 66% of retail investor accounts lose money when trading CFDs with this provider. You should consider whether you understand how CFDs work and whether you can afford to take the high risk of losing your money.
Stratos Global LLC (tradu.com ):
Losses can exceed deposits.
Please be advised that the information presented on TradingView is provided to Tradu (‘Company’, ‘we’) by a third-party provider (‘TFA Global Pte Ltd’). Please be reminded that you are solely responsible for the trading decisions on your account. There is a very high degree of risk involved in trading. Any information and/or content is intended entirely for research, educational and informational purposes only and does not constitute investment or consultation advice or investment strategy. The information is not tailored to the investment needs of any specific person and therefore does not involve a consideration of any of the investment objectives, financial situation or needs of any viewer that may receive it. Kindly also note that past performance is not a reliable indicator of future results. Actual results may differ materially from those anticipated in forward-looking or past performance statements. We assume no liability as to the accuracy or completeness of any of the information and/or content provided herein and the Company cannot be held responsible for any omission, mistake nor for any loss or damage including without limitation to any loss of profit which may arise from reliance on any information supplied by TFA Global Pte Ltd.
The speaker(s) is neither an employee, agent nor representative of Tradu and is therefore acting independently. The opinions given are their own, constitute general market commentary, and do not constitute the opinion or advice of Tradu or any form of personal or investment advice. Tradu neither endorses nor guarantees offerings of third-party speakers, nor is Tradu responsible for the content, veracity or opinions of third-party speakers, presenters or participants.


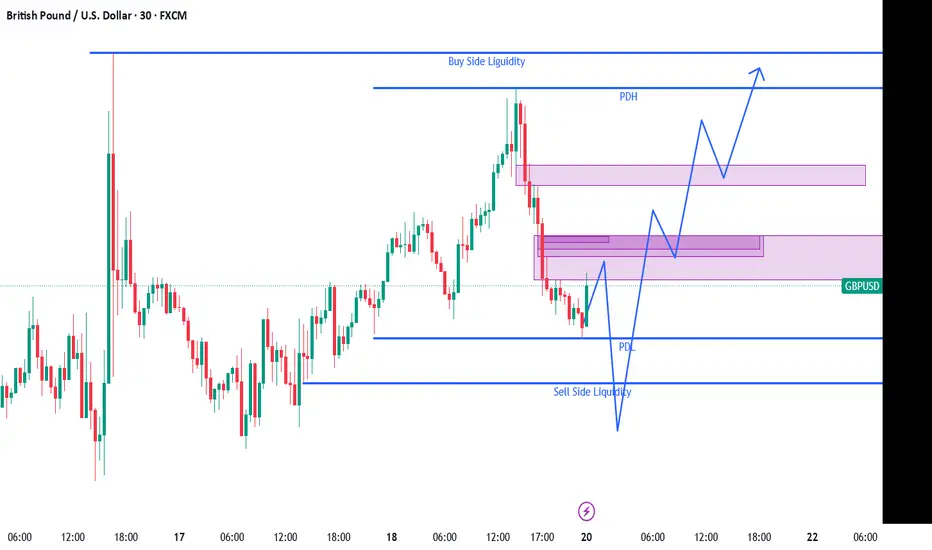
GBPUSD - This is what is I see. Do you agree? Share your thoughtI see price tapping into the 1H FVG then sweeping the PDL and move to the upside. What are your thoughts? Do you agree?
GBPUSD BUY SETUPGBPUSD has double bottom on a support zone and we are likely to see it going up , but lets see how see things go

GBPUSD: A Bearish Outlook on the Daily ChartGBPUSD: A Bearish Outlook on the Daily Chart
On the daily chart, GBPUSD looks like it is preparing to start a downtrend.
I don’t expect GBPUSD to fall that easily. It is likely to wait for the FOMC meeting at the end of the month before starting a bearish wave.
At this point, GBPUSD could be in a correction before taking a turn.
Key target areas: 1.3190; 1.3000 and 1.2750
You may find more details in the chart!
Thank you and Good Luck!
PS: Please support with a like or comment if you find this analysis useful for your trading day
Disclosure: I am part of Trade Nation's Influencer program and receive a monthly fee for using their TradingView charts in my analysis.

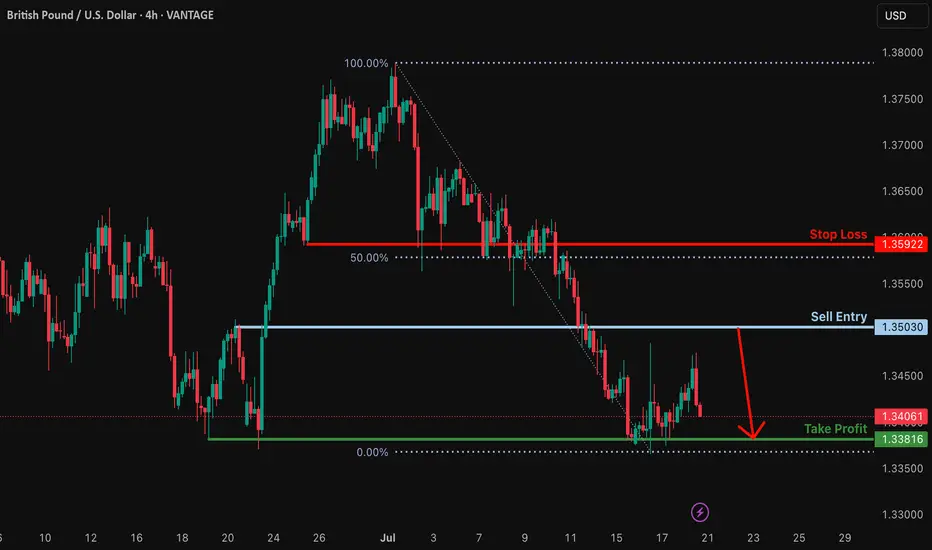
Bearish reversal off pullback resistance?GBP/USD is rising towards the resistance which is a pullback resistance and could drop from this level to our take profit.
Entry: 1.3603
Why we like it:
There is a pullback resistance level.
Stop loss: 1.3592
Why we like it:
There is a pullback resistance that is slightly above the 50% Fibonacci retracement.
Take profit: 1.3361
Why we like it:
There is a pullback support.
Enjoying your TradingView experience? Review us!
Please be advised that the information presented on TradingView is provided to Vantage (‘Vantage Global Limited’, ‘we’) by a third-party provider (‘Everest Fortune Group’). Please be reminded that you are solely responsible for the trading decisions on your account. There is a very high degree of risk involved in trading. Any information and/or content is intended entirely for research, educational and informational purposes only and does not constitute investment or consultation advice or investment strategy. The information is not tailored to the investment needs of any specific person and therefore does not involve a consideration of any of the investment objectives, financial situation or needs of any viewer that may receive it. Kindly also note that past performance is not a reliable indicator of future results. Actual results may differ materially from those anticipated in forward-looking or past performance statements. We assume no liability as to the accuracy or completeness of any of the information and/or content provided herein and the Company cannot be held responsible for any omission, mistake nor for any loss or damage including without limitation to any loss of profit which may arise from reliance on any information supplied by Everest Fortune Group.
GBP/USD Bullish Setup: Targeting 1.35633 and 1.36667This 5-hour chart for GBP/USD shows a bullish trend within an ascending channel. The chart highlights two target zones: the first at 1.35633 and the second at 1.36667. A buy signal is indicated near the 1.34080 support zone, suggesting potential upward movement toward the marked resistance targets.

GBPUSD is in the Selling DirectionHello Traders
In This Chart GBPUSD HOURLY Forex Forecast By FOREX PLANET
today GBPUSD analysis 👆
🟢This Chart includes_ (GBPUSD market update)
🟢What is The Next Opportunity on GBPUSD Market
🟢how to Enter to the Valid Entry With Assurance Profit
This CHART is For Trader's that Want to Improve Their Technical Analysis Skills and Their Trading By Understanding How To Analyze The Market Using Multiple Timeframes and Understanding The Bigger Picture on the Charts

Pay attention this week!My scenario for this pair for the coming week.
The marked area is highly valid.
Enter the trade if the marked area is reached with confirmation.
.
.
Follow the page for more analysis.

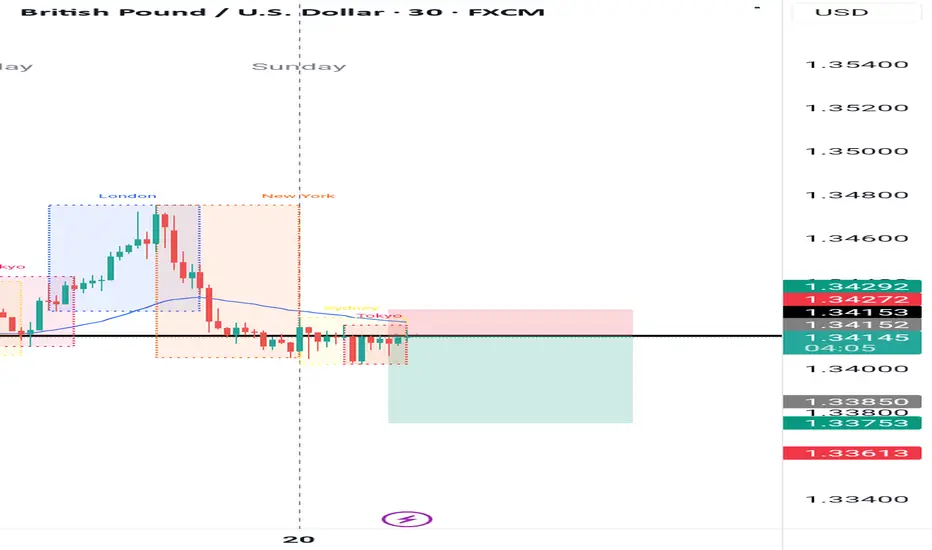
GBPUSD - Bullish Bias with Tactical Short Setup• Pair: GBPUSD (GU)
• Bias: Bullish overall | Tactical short for OB mitigation
• HTF Overview (4H):
• Price broke major highs — clear bullish intent.
• Pullback last week suggests price is targeting 4H SSL for liquidity + OB mitigation before further upside.
• MTF Refinement (30M):
• Price structure currently presents a temporary sell bias.
• BSL has been taken — confirming liquidity sweep.
• Eyeing price to run lower into 4H OB zone.
• LTF Confirmation (5M/1M):
• Waiting on LTF confirmation to ride the move down into the 4H OB.
•Only entering after analysis is complete and CHoCH shows cleanly.
• Entry Zone:
• Tactical short after LTF confirms.
• Final long setup expected from 4H OB after mitigation.
• Targets:
• 30M lows as short-term target.
• 4H OB as the major zone for potential bullish reversal.
• Mindset Note:
• It’s analysis before execution.
• Staying in sync with HTF logic while sniping intraday plays for precision entries.
Bless Trading!

GBPUSD TRADE SETUPWait for retest the entry level and bullish momentum then take a trade for Buy otherwise skip this setup

Weekly selling gbpusdStrong bearish pressure comes
On day time frame buy trend breaks and candel close below the trend
Monthly still overbought
Trend shift now and bearish correction expected till our target

Strong sell gbpusdStrong bearish expected from this level
Monthly still overbought pair
Daily buy trend broken and candel closes below the buy trend indicates the selling pressure

GBPUSDGBPUSD has correction due before any more downside.
Disclosure: We are part of Trade Nation's Influencer program and receive a monthly fee for using their TradingView charts in our analysis.

GBPUSD buy current uptrend so ready to take a buy on the current pullback now at dynamic support level and also the 0.618 golden zone fib support level for a double confirmation , I'm looking to buy here , up to next resistance, level of 1.34458 where we could see a take profit area 👍 this is not financial advice only an idea 🤔


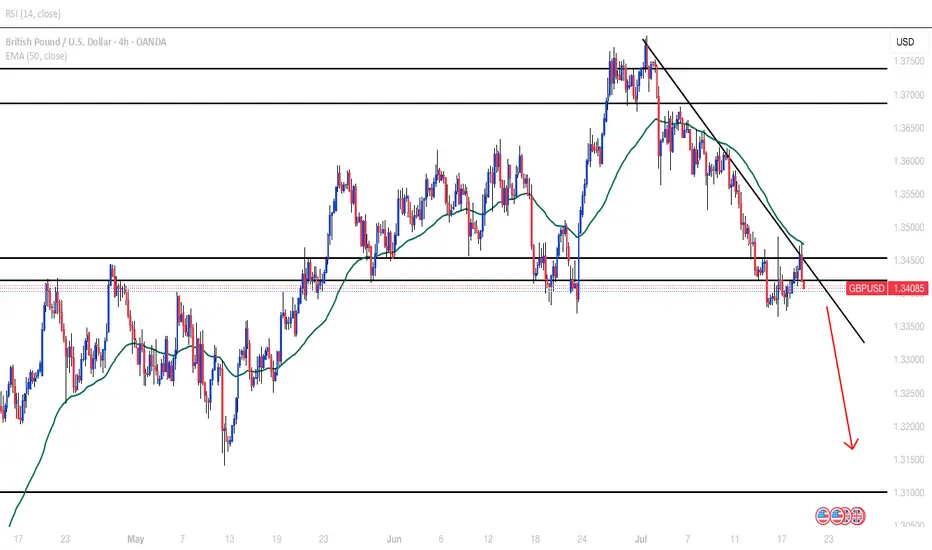
GBPUSD POSSIBLE TREND CHANGE?Reached a strong weekly resistance and pushed down. Broke daily/H4 support. Retesting zone with 50EMA rejection. Looking at 1.32500 as 1st target
Gbpusd set upGBP/USD 4H Chart Analysis – Bearish Setup in Play
Current Price: 1.34080
Trend Bias: Bearish (short-term)
Indicators:
EMA (9, close) – Price is consistently trading below the 9 EMA, reinforcing bearish momentum.
Volume: No significant uptick in buying activity; selling pressure remains dominant.
Technical Overview:
The GBP/USD pair is currently exhibiting a descending triangle pattern on the 4-hour timeframe. This structure is typically a bearish continuation pattern, especially after the steep downtrend from early July.
Resistance Trendline: A series of lower highs is compressing price action towards support, creating a descending ceiling.
Key Support Zone: 1.3370–1.3380 region is acting as horizontal support. This level has been tested multiple times, increasing the chances of an eventual breakdown.
Price Action Outlook:
The chart suggests a potential breakdown scenario:
A clean break below the 1.3370 support could trigger further downside, potentially targeting the 1.3200 psychological level next.
If price manages to break above the descending trendline, this bearish setup would be invalidated and a short-term relief rally could occur.
Key Levels to Watch:
Support: 1.3370 (critical zone), 1.3200 (next downside target)
Resistance: 1.3450 (trendline resistance), 1.3600 (recent swing high)
Potential Trade Idea (Not Financial Advice):
Short Bias: Watch for a 4H candle close below 1.3370 for possible short entries.
Stop-Loss: Above the descending trendline (~1.3460).
Take-Profit Targets: 1.3300 and 1.3200.
Summary:
GBP/USD is under pressure, trading in a descending triangle. Price action suggests a bearish continuation is likely if support fails. Traders should monitor for a breakout or breakdown confirmation before taking action.

GBPUSD SET UPGBP/USD 4H Chart Analysis – Bearish Setup in Play
Current Price: 1.34080
Trend Bias: Bearish (short-term)
Indicators:
EMA (9, close) – Price is consistently trading below the 9 EMA, reinforcing bearish momentum.
Volume: No significant uptick in buying activity; selling pressure remains dominant.
Technical Overview:
The GBP/USD pair is currently exhibiting a descending triangle pattern on the 4-hour timeframe. This structure is typically a bearish continuation pattern, especially after the steep downtrend from early July.
Resistance Trendline: A series of lower highs is compressing price action towards support, creating a descending ceiling.
Key Support Zone: 1.3370–1.3380 region is acting as horizontal support. This level has been tested multiple times, increasing the chances of an eventual breakdown.
Price Action Outlook:
The chart suggests a potential breakdown scenario:
A clean break below the 1.3370 support could trigger further downside, potentially targeting the 1.3200 psychological level next.
If price manages to break above the descending trendline, this bearish setup would be invalidated and a short-term relief rally could occur.
Key Levels to Watch:
Support: 1.3370 (critical zone), 1.3200 (next downside target)
Resistance: 1.3450 (trendline resistance), 1.3600 (recent swing high)
Potential Trade Idea (Not Financial Advice):
Short Bias: Watch for a 4H candle close below 1.3370 for possible short entries.
Stop-Loss: Above the descending trendline (~1.3460).
Take-Profit Targets: 1.3300 and 1.3200.
Summary:
GBP/USD is under pressure, trading in a descending triangle. Price action suggests a bearish continuation is likely if support fails. Traders should monitor for a breakout or breakdown confirmation before taking action.

GBPUSD July Playbook: Bearish Setup at Channel High GBPUSD just printed a CC SELL signal right at the top of its rising channel — setting the stage for a potential July pullback.
📌 Breakdown using Vinnie’s Trading Cheat Code System:
✅ RSI Overbought zone triggered
✅ CC Sell + Confirm Sell combo at channel resistance (~1.38)
✅ Price stretched far above the mean with no higher timeframe support nearby
✅ MACD histogram rolling over — momentum shift in play
🎯 Targets:
1.3500 (channel median / recent base)
1.3280 (deeper support / previous Confirm Buy area)
This looks like a textbook trap-the-buyers setup. Patience on the entry — I’ll be stalking rallies to sell into.
🧠 Tools Used:
Vinnie’s Confirm Alerts
CC Trend Indicator
RSI OB/OS Scanner
MACD HPS Screener
Following this closely — could be one of the cleanest short opportunities of the month.

GBPUSD is Bearish! Look for Sells!Welcome back to the Weekly Forex Forecast for the week of July 21-25th.
In this video, we will analyze the following FX market:
GBPUSD
Expecting the USD to continue to push higher, which would further drag the EURO down. Look to take advantage of this dynamic and wait for sell setups!
Enjoy!
May profits be upon you.
Leave any questions or comments in the comment section.
I appreciate any feedback from my viewers!
Like and/or subscribe if you want more accurate analysis.
Thank you so much!
Disclaimer:
I do not provide personal investment advice and I am not a qualified licensed investment advisor.
All information found here, including any ideas, opinions, views, predictions, forecasts, commentaries, suggestions, expressed or implied herein, are for informational, entertainment or educational purposes only and should not be construed as personal investment advice. While the information provided is believed to be accurate, it may include errors or inaccuracies.
I will not and cannot be held liable for any actions you take as a result of anything you read here.
Conduct your own due diligence, or consult a licensed financial advisor or broker before making any and all investment decisions. Any investments, trades, speculations, or decisions made on the basis of any information found on this channel, expressed or implied herein, are committed at your own risk, financial or otherwise.
