GBP SLIDES AS UK LABOR DATA MISS FUELS DOVISH BOE BETSEarlier today, the UK’s Claimant Count Change (jobless claim) i.e. the number of people in the UK claiming unemployment related benefits for the month of May was released with a whopping 33.1k against 9.5k projection and average earnings index plus bonus witnessed a decline to 5.3% against 5.5% forecast.
Today’s disappointing UK labor market report prompted a notable shift in market expectations for Bank of England policy. Following the release of the weaker-than-expected jobs data, traders are now pricing in a more dovish path ahead, anticipating around 48 basis points of rate cuts by the end of the year as against 38bps before the data release.
In the wake of the weak data, GBP tanked across board and GBPUSD wasn’t left out.
TECHNICAL VIEW OF GBPUSD AND POTENTIAL TARGET AS PER ANALYST
From the technical perceptive, the GU on the 2H closed below the 50 EMA and is seen supported around the trendline at 1.3467 as evident on the chart.
With the formation of H&S pattern and a clear break of the neckline at 1.3503, it hints that sellers are still dominant. While waiting for the next catalyst. If buyers step in and GU retraces, analyst expects potential target towards 1.3562 and a break above this would usher in the next resistance around 1.3610. On the flip side, if the bearish momentum continues, analysts envisage potential target towards 1.3418 and further decline would usher in 1.3334.
Meanwhile, further break out of these levels are not ruled out.
UPCOMING CATALYST
On the radar, markets await U.S CPI and core CPI tomorrow. On Thursday, UK GDP and U.S PPI and core PPI would be on the wire. To wrap up the week, U.S consumer sentiment and inflation expectation would be the focus on Friday.
These data points have the tendency to cause market volatility in the coming days.
USDGBP trade ideas

GBPUSD: Intraday Bullish Reversal📉GBPUSD pair approached a significant horizontal resistance last week.
The price formed a clear head and shoulders pattern, then rebounded and broke below a strong rising trend line.
This indicates considerable selling strength, suggesting that the market may continue to decline.
The next target is 1.3453.

GBPUSDSelll. Market Execution. trade 1:2. risk 0.50%
We entered Sell because the market is respecting the sellers' zone.


GBPUSD SHORT FORECAST Q2 W24 D10 Y25GBPUSD SHORT FORECAST Q2 W24 D10 Y25
Professional Risk Managers👋
Welcome back to another FRGNT chart update📈
Diving into some Forex setups using predominantly higher time frame order blocks alongside confirmation breaks of structure.
Let’s see what price action is telling us today!
💡Here are some trade confluences📝
✅Weekly order block
✅15' order block
✅Intraday 15' break of structure
✅Tokyo ranges to be filled
🔑 Remember, to participate in trading comes always with a degree of risk, therefore as professional risk managers it remains vital that we stick to our risk management plan as well as our trading strategies.
📈The rest, we leave to the balance of probabilities.
💡Fail to plan. Plan to fail.
🏆It has always been that simple.
❤️Good luck with your trading journey, I shall see you at the very top.
🎯Trade consistent, FRGNT X

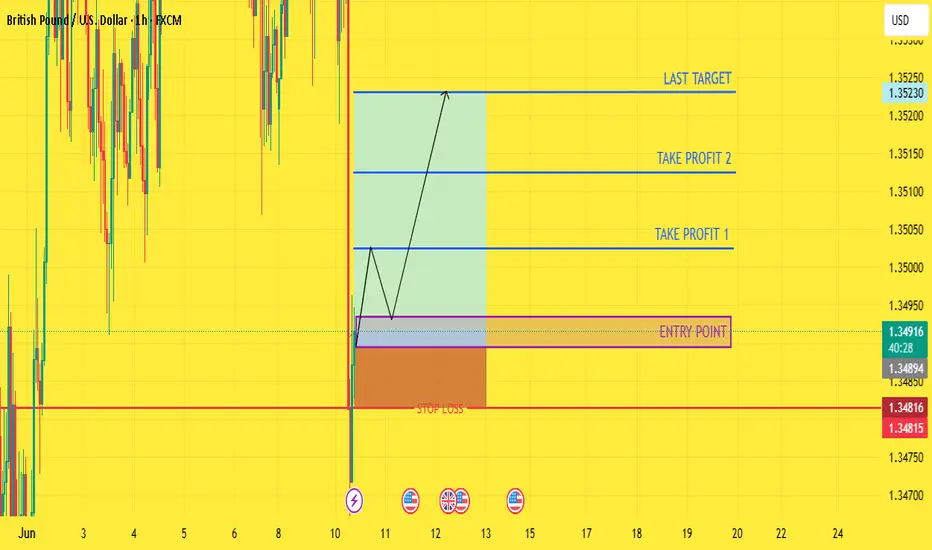
CHECK GBPUSD SIGNAL READ CAPTAIN(GBPUSD) trading signals technical analysis satup👇🏼
( GBPUSD ) BUY zone
( TRADE SATUP)
ENTRY POINT (1.34895 to (1.34935) 📊
FIRST TP (1.35025)📊
2ND TARGET (1.35125) 📊
LAST TARGET (1.35230) 📊
STOP LOOS (1.34815)❌
Tachincal analysis satup
Fallow risk management
GBPUSD to the downsideClassic overbought condition. In addition to the positive US data last week, expect a drop lower for GBPUSD
Safe trading.

GBPUSD Is Very Bearish! Short!
Please, check our technical outlook for GBPUSD.
Time Frame: 3h
Current Trend: Bearish
Sentiment: Overbought (based on 7-period RSI)
Forecast: Bearish
The price is testing a key resistance 1.355.
Taking into consideration the current market trend & overbought RSI, chances will be high to see a bearish movement to the downside at least to 1.350 level.
P.S
Overbought describes a period of time where there has been a significant and consistent upward move in price over a period of time without much pullback.
Disclosure: I am part of Trade Nation's Influencer program and receive a monthly fee for using their TradingView charts in my analysis.
Like and subscribe and comment my ideas if you enjoy them!

GBPUSD Will Go Down! Short!
Take a look at our analysis for GBPUSD.
Time Frame: 9h
Current Trend: Bearish
Sentiment: Overbought (based on 7-period RSI)
Forecast: Bearish
The market is approaching a key horizontal level 1.356.
Considering the today's price action, probabilities will be high to see a movement to 1.346.
P.S
We determine oversold/overbought condition with RSI indicator.
When it drops below 30 - the market is considered to be oversold.
When it bounces above 70 - the market is considered to be overbought.
Disclosure: I am part of Trade Nation's Influencer program and receive a monthly fee for using their TradingView charts in my analysis.
Like and subscribe and comment my ideas if you enjoy them!

SELL GBPUSDGU is playing out the Rising Wedge so we anticipate a decent drop in price action today having in mind the NFP is also brewing,... lets get it

GBP/USD💰Symbol: { GBP/USD }
🟩Price: { 1.35618 }
🟥Stop: { 1.36046 }
1️⃣profit: { 1.35092 }
2️⃣profit: { 1.34570 }
3️⃣profit: { 1.34000 }
📊Check your chart before entering.
🚨Check before use to make sure there is no important news.🚨

GU-Tue-10/06/25 TDA-Will supports hold or GU breaking down?Analysis done directly on the chart
Follow for more, possible live trades update!
Qualitative over quantitative trades, if I don't see good volume,
efficient moves with less and less drawdown I don't mind not taking
any trades even for days if it's necessary. When you control the urge
of having necessarily take trades everyday your psychology will level up a lot.
I take profits based on what the market conditions offer me and
not sticking to always have to set necessarily 1:2 RR or whatever.
It all depends on how market is doing. That's something we can't control.
Active in London session!
Not financial advice, DYOR.
Market Flow Strategy
Mister Y

GBPUSD SELL 1.3520On the 4-hour chart, GBPUSD has formed a head and shoulders top pattern. At present, we can pay attention to the resistance near 1.3520. If the rebound is blocked, we can consider continuing to short. The support below is around 1.3420.


GBPUSD H1 I Bearish Reversal Based on the H1 chart, the price could rise toward our sell entry level at 1.3547, a pullback resistance.
Our take profit is set at 1.3518, a swing low support.
The stop loss is set at 1.3567, a pullback resistance.
High Risk Investment Warning
Trading Forex/CFDs on margin carries a high level of risk and may not be suitable for all investors. Leverage can work against you.
Stratos Markets Limited (tradu.com ):
CFDs are complex instruments and come with a high risk of losing money rapidly due to leverage. 63% of retail investor accounts lose money when trading CFDs with this provider. You should consider whether you understand how CFDs work and whether you can afford to take the high risk of losing your money.
Stratos Europe Ltd (tradu.com ):
CFDs are complex instruments and come with a high risk of losing money rapidly due to leverage. 63% of retail investor accounts lose money when trading CFDs with this provider. You should consider whether you understand how CFDs work and whether you can afford to take the high risk of losing your money.
Stratos Global LLC (tradu.com ):
Losses can exceed deposits.
Please be advised that the information presented on TradingView is provided to Tradu (‘Company’, ‘we’) by a third-party provider (‘TFA Global Pte Ltd’). Please be reminded that you are solely responsible for the trading decisions on your account. There is a very high degree of risk involved in trading. Any information and/or content is intended entirely for research, educational and informational purposes only and does not constitute investment or consultation advice or investment strategy. The information is not tailored to the investment needs of any specific person and therefore does not involve a consideration of any of the investment objectives, financial situation or needs of any viewer that may receive it. Kindly also note that past performance is not a reliable indicator of future results. Actual results may differ materially from those anticipated in forward-looking or past performance statements. We assume no liability as to the accuracy or completeness of any of the information and/or content provided herein and the Company cannot be held responsible for any omission, mistake nor for any loss or damage including without limitation to any loss of profit which may arise from reliance on any information supplied by TFA Global Pte Ltd.
The speaker(s) is neither an employee, agent nor representative of Tradu and is therefore acting independently. The opinions given are their own, constitute general market commentary, and do not constitute the opinion or advice of Tradu or any form of personal or investment advice. Tradu neither endorses nor guarantees offerings of third-party speakers, nor is Tradu responsible for the content, veracity or opinions of third-party speakers, presenters or participants.

GBPUSDHello Traders! 👋
What are your thoughts on GBPUSD?
On the 4-hour timeframe, GBPUSD has broken below its ascending trendline and is now trading below a key resistance zone.
We expect the pair to consolidate briefly within this area, and then move lower toward the specified support level.
As long as the price remains below the resistance and the broken trendline, the bearish bias remains valid.
Don’t forget to like and share your thoughts in the comments! ❤️
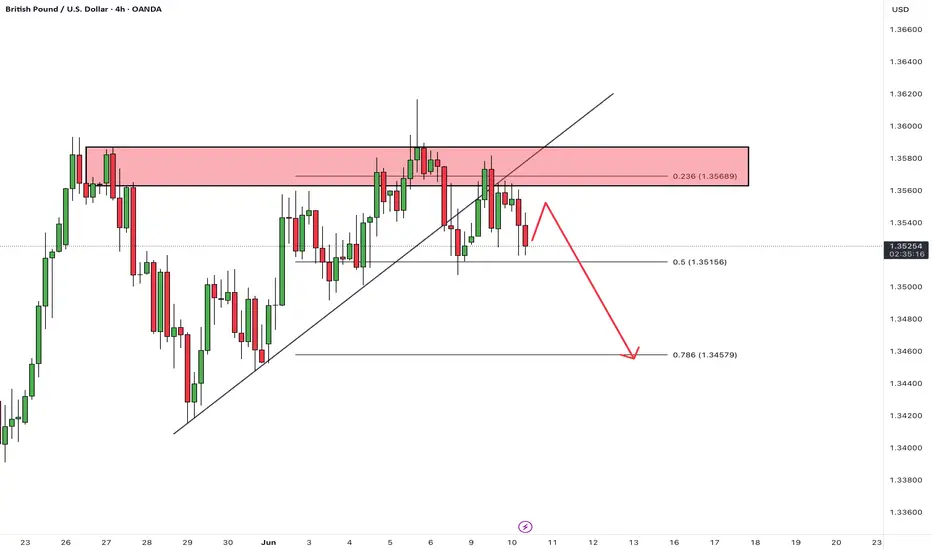
Bearish breakout?The Cable (GBP/USD) is falling towards the pivot, which is an overlap support, and could bounce to the 1st resistance which is a pullback resistance.
Pivot: 1.3505
1st Support: 1.3415
1st Resistance: 1.3581
Risk Warning:
Trading Forex and CFDs carries a high level of risk to your capital and you should only trade with money you can afford to lose. Trading Forex and CFDs may not be suitable for all investors, so please ensure that you fully understand the risks involved and seek independent advice if necessary.
Disclaimer:
The above opinions given constitute general market commentary, and do not constitute the opinion or advice of IC Markets or any form of personal or investment advice.
Any opinions, news, research, analyses, prices, other information, or links to third-party sites contained on this website are provided on an "as-is" basis, are intended only to be informative, is not an advice nor a recommendation, nor research, or a record of our trading prices, or an offer of, or solicitation for a transaction in any financial instrument and thus should not be treated as such. The information provided does not involve any specific investment objectives, financial situation and needs of any specific person who may receive it. Please be aware, that past performance is not a reliable indicator of future performance and/or results. Past Performance or Forward-looking scenarios based upon the reasonable beliefs of the third-party provider are not a guarantee of future performance. Actual results may differ materially from those anticipated in forward-looking or past performance statements. IC Markets makes no representation or warranty and assumes no liability as to the accuracy or completeness of the information provided, nor any loss arising from any investment based on a recommendation, forecast or any information supplied by any third-party.

GBPUSDHello Traders! 👋
What are your thoughts on GBPUSD?
GBP/USD has reached a key resistance zone and is currently trading below it. A bearish divergence has also formed, signaling potential weakness in bullish momentum.
Given the confluence of resistance and negative divergence, we expect the price to struggle breaking above this level and likely decline toward the specified support zones.
Unless price breaks above the resistance decisively, the bias remains bearish in the short term.
Don’t forget to like and share your thoughts in the comments! ❤️

GBPUSD H1 I Bearish Reversal Based on the H1 chart, the price is approaching our sell entry level at 1.3547, a pullback resistance.
Our take profit is set at 1.3518, an overlap support.
The stop loss is set at 1.3567, an overlap resistance.
High Risk Investment Warning
Trading Forex/CFDs on margin carries a high level of risk and may not be suitable for all investors. Leverage can work against you.
Stratos Markets Limited (tradu.com ):
CFDs are complex instruments and come with a high risk of losing money rapidly due to leverage. 63% of retail investor accounts lose money when trading CFDs with this provider. You should consider whether you understand how CFDs work and whether you can afford to take the high risk of losing your money.
Stratos Europe Ltd (tradu.com ):
CFDs are complex instruments and come with a high risk of losing money rapidly due to leverage. 63% of retail investor accounts lose money when trading CFDs with this provider. You should consider whether you understand how CFDs work and whether you can afford to take the high risk of losing your money.
Stratos Global LLC (tradu.com ):
Losses can exceed deposits.
Please be advised that the information presented on TradingView is provided to Tradu (‘Company’, ‘we’) by a third-party provider (‘TFA Global Pte Ltd’). Please be reminded that you are solely responsible for the trading decisions on your account. There is a very high degree of risk involved in trading. Any information and/or content is intended entirely for research, educational and informational purposes only and does not constitute investment or consultation advice or investment strategy. The information is not tailored to the investment needs of any specific person and therefore does not involve a consideration of any of the investment objectives, financial situation or needs of any viewer that may receive it. Kindly also note that past performance is not a reliable indicator of future results. Actual results may differ materially from those anticipated in forward-looking or past performance statements. We assume no liability as to the accuracy or completeness of any of the information and/or content provided herein and the Company cannot be held responsible for any omission, mistake nor for any loss or damage including without limitation to any loss of profit which may arise from reliance on any information supplied by TFA Global Pte Ltd.
The speaker(s) is neither an employee, agent nor representative of Tradu and is therefore acting independently. The opinions given are their own, constitute general market commentary, and do not constitute the opinion or advice of Tradu or any form of personal or investment advice. Tradu neither endorses nor guarantees offerings of third-party speakers, nor is Tradu responsible for the content, veracity or opinions of third-party speakers, presenters or participants.

GBPUSD - Long on fullfillment Looking at GBPUSD
The order flow on the 4HR and 15min are still bullish.
Looking for that upside momentum until we take out a 4HR level of demand.
So until the buyers have had enough and the sellers take over. Lets see what we get overnight.
Will leave a pending order on this until the London open and then re-assess in the morning
If you have any questions don't be shy

$GU (GBPUSD) 4H AnalysisExpectation: Break of trendline → retest → drop toward 1.34450 liquidity.
Momentum is exhausting near resistance, and price is now testing a key ascending trendline...We’ve swept short-term buy stops and failed to sustain bullish continuation.
Buy-side liquidity above recent highs has been swept.
Now, sell-side liquidity rests below 1.35240 (marked in red), a key equal low / internal liquidity pool...Below that, there’s a clean draw to the 1.34450–1.34143 imbalance zone, where liquidity and inefficiency align.
Price could pull back after the trendline break, then resume bearish continuation.

GBPUSD Selltrade active, we've reached 4 hour equilibrium and created a market shift on the 1 hour, taking Order block and selling to 4 hour lows

GBP USD LONG ANALYSIS
long cable
trend bias: bullish
entry: clear body close above 1.35800 to target thursday high of 1.36200
approx 35 pips
risk to reward 1:2
sl 15 pips
tp 30 pips
expected date: tuesday 10 june 2025 ldn/ny session
hh
