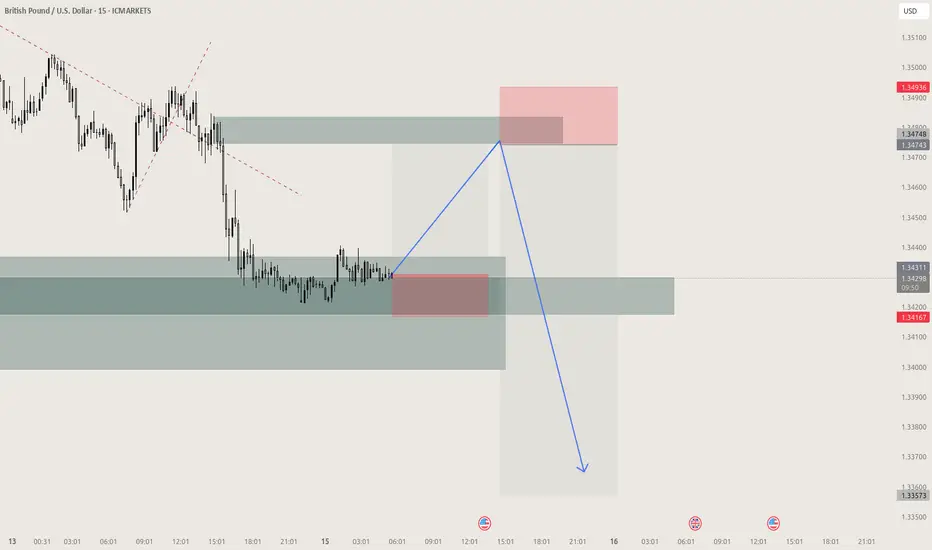
GBPUSD pre CPI move potential long into shortGBPUSD resting at support, i prefer to trade into Monday liquidity before major sell off, UK tends to push price higher in mornings to continue sell off later that day. Caution advised, neither are confirmed
USDGBP trade ideas
GBP/USD – Uptrend Channel Analysis!GBP/USD is trading inside a strong uptrend channel on the 4-hour chart.
Recent price action confirmed a Break of Structure (BOS), signaling solid bullish control.
Buyers have pushed price firmly above previous resistance zones.
Price is now near the upper boundary of the channel.
Signs of short-term exhaustion suggest a likely retracement ahead.
A pullback into the retracement level or channel midline would offer better risk-reward.
Key Levels to Watch:
Channel support for potential bounce.
Retracement zone as a buy opportunity.
Trade Plan:
Wait for a clean retracement toward support.
Look for bullish confirmation before entering long.
Avoid chasing highs – focus on discounted entries.
Bias: Bullish while price holds the uptrend channel structure.
Expect continuation after healthy correction.
Patience is critical – let the market set up a quality entry.
Traders should align with the dominant trend and manage risk carefully.
Like, comment, share, and follow for more trading ideas.

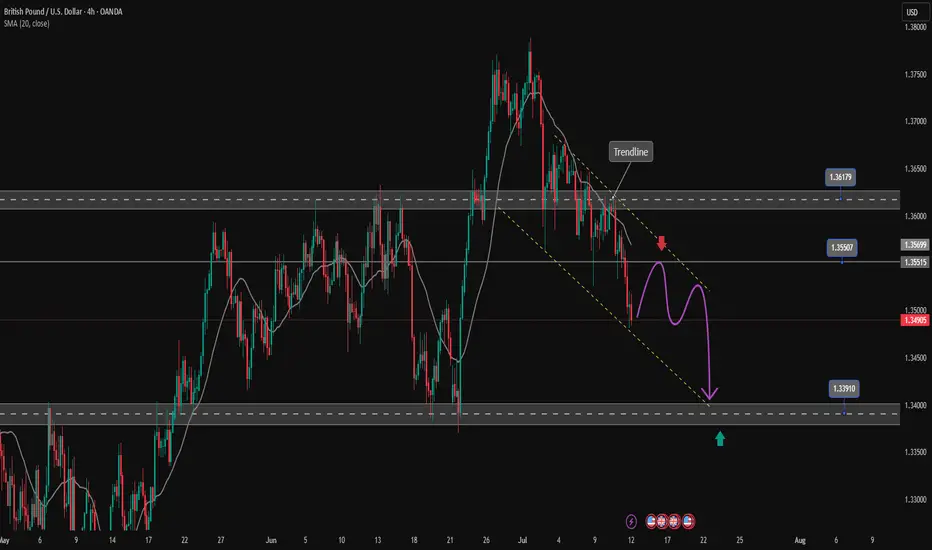
GBPUSD downtrend continuesOANDA:GBPUSD is trading in a bearish channel heading towards the important support zone of 1.340. This is the bottom support zone of last month so there is a lot of buying pressure in this zone. Any recovery of GBPUSD is considered a good opportunity to enter a SELL signal to the target. When the price breaks 1.361, the downtrend will really break.
Support: 1.340
Resistance: 1.355-1.361
SELL Trigger: rejection 1.355 with bearish confirmation
SELL zone 1.361 (Strong Resistance zone)
Target: 1.340
Leave your comments on the idea. I am happy to read your views.
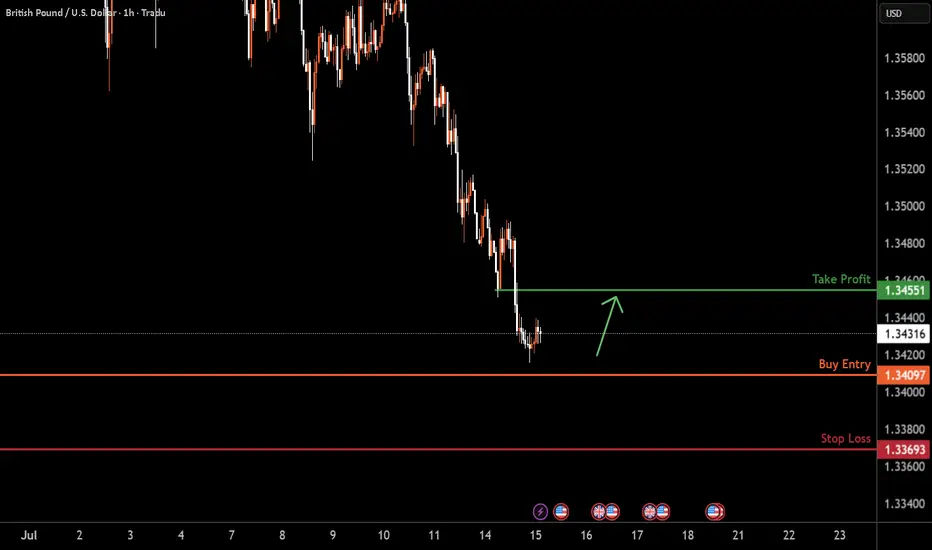
GBPUSD H1 I Bullish Reversal Based on the H1 chart analysis, we can see that the price could fall toward our buy entry at 1.3409, which is a pullback support.
Our take profit will be at 1.3455, which is a pullback resistance level.
The stop loss will be placed at 1.3369, a swing low support
High Risk Investment Warning
Trading Forex/CFDs on margin carries a high level of risk and may not be suitable for all investors. Leverage can work against you.
Stratos Markets Limited (tradu.com ):
CFDs are complex instruments and come with a high risk of losing money rapidly due to leverage. 63% of retail investor accounts lose money when trading CFDs with this provider. You should consider whether you understand how CFDs work and whether you can afford to take the high risk of losing your money.
Stratos Europe Ltd (tradu.com ):
CFDs are complex instruments and come with a high risk of losing money rapidly due to leverage. 63% of retail investor accounts lose money when trading CFDs with this provider. You should consider whether you understand how CFDs work and whether you can afford to take the high risk of losing your money.
Stratos Global LLC (tradu.com ):
Losses can exceed deposits.
Please be advised that the information presented on TradingView is provided to Tradu (‘Company’, ‘we’) by a third-party provider (‘TFA Global Pte Ltd’). Please be reminded that you are solely responsible for the trading decisions on your account. There is a very high degree of risk involved in trading. Any information and/or content is intended entirely for research, educational and informational purposes only and does not constitute investment or consultation advice or investment strategy. The information is not tailored to the investment needs of any specific person and therefore does not involve a consideration of any of the investment objectives, financial situation or needs of any viewer that may receive it. Kindly also note that past performance is not a reliable indicator of future results. Actual results may differ materially from those anticipated in forward-looking or past performance statements. We assume no liability as to the accuracy or completeness of any of the information and/or content provided herein and the Company cannot be held responsible for any omission, mistake nor for any loss or damage including without limitation to any loss of profit which may arise from reliance on any information supplied by TFA Global Pte Ltd.
The speaker(s) is neither an employee, agent nor representative of Tradu and is therefore acting independently. The opinions given are their own, constitute general market commentary, and do not constitute the opinion or advice of Tradu or any form of personal or investment advice. Tradu neither endorses nor guarantees offerings of third-party speakers, nor is Tradu responsible for the content, veracity or opinions of third-party speakers, presenters or participants.
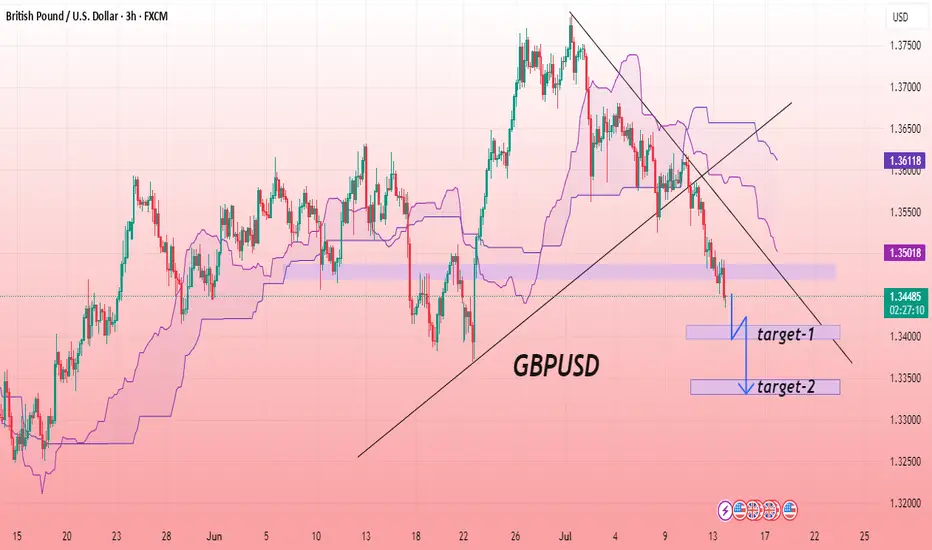
GBP/USD BEARISH SETUPThe chart shows the GBP/USD currency pair on a 3-hour timeframe, indicating a bearish trend. Price action has broken below the trendline support and is trading beneath the Ichimoku cloud, suggesting downward momentum. A key support zone has been breached, and the price is currently retesting this zone as resistance. The overall structure suggests a continuation to the downside. The chart highlights a descending channel and marks two projected levels as potential targets. The analysis aligns with bearish sentiment, reinforced by consistent lower highs and lower lows. Traders may consider further confirmation before initiating positions based on trend continuation setups.
Entry: 1.34500
Target First: 1.33960
Target Second: 1.33313
Stop Loss: 1.35000
GBPUSD ShortGBPUSD is now net short on the regression break.
I am considering my EA options on this pair.
GBPUSD ANALYSIS After seeing the previous day close bearish we can expect the market to continue in to support area of 133.750 but a slight retracement could be in play before further push down

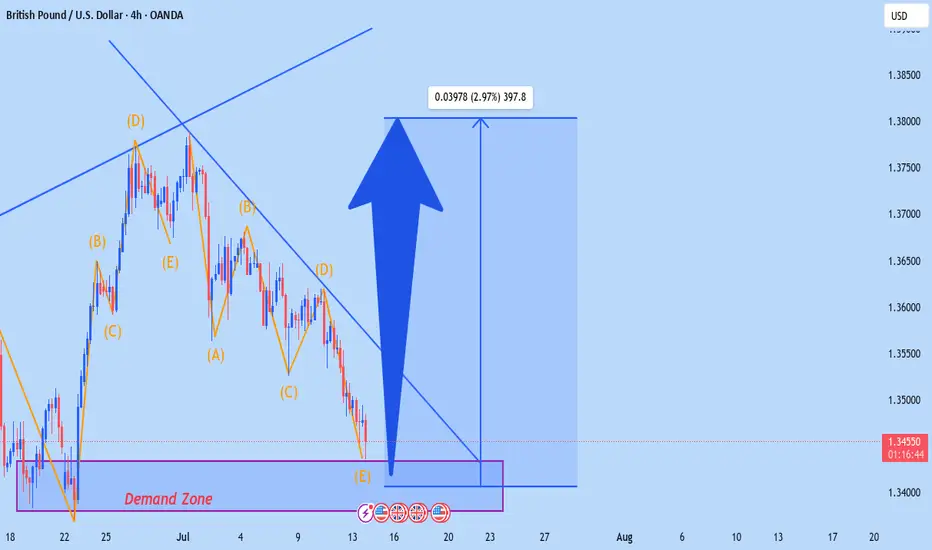
GBPUSD- H4 BUY Price is moving in a channel and weekly show uptrend. Price reach strong area of Support, and FIBO show 78.60
Price show Divergency in Daily frame. All this can indicate that price is finish the correction and now ready to join the main uptrend.

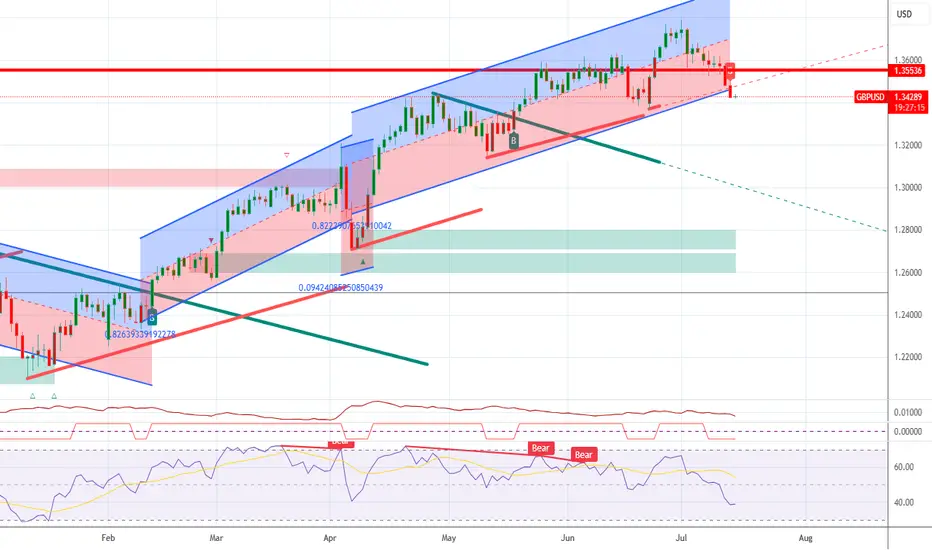
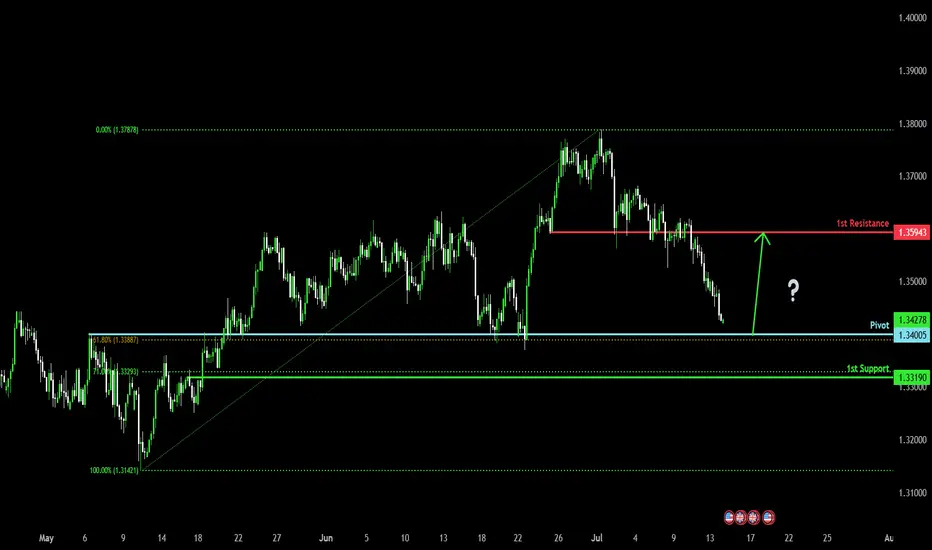
Falling towards major support?The Cable (GBP/USD) is falling towards the pivot which has been identified as an overlap support that lines up with the 61.8% Fibonacci retracement and could reverse to the 1st resistance.
Pivot: 1.3400
1st Support: 1.3319
1st Resistance: 1.3594
Risk Warning:
Trading Forex and CFDs carries a high level of risk to your capital and you should only trade with money you can afford to lose. Trading Forex and CFDs may not be suitable for all investors, so please ensure that you fully understand the risks involved and seek independent advice if necessary.
Disclaimer:
The above opinions given constitute general market commentary, and do not constitute the opinion or advice of IC Markets or any form of personal or investment advice.
Any opinions, news, research, analyses, prices, other information, or links to third-party sites contained on this website are provided on an "as-is" basis, are intended only to be informative, is not an advice nor a recommendation, nor research, or a record of our trading prices, or an offer of, or solicitation for a transaction in any financial instrument and thus should not be treated as such. The information provided does not involve any specific investment objectives, financial situation and needs of any specific person who may receive it. Please be aware, that past performance is not a reliable indicator of future performance and/or results. Past Performance or Forward-looking scenarios based upon the reasonable beliefs of the third-party provider are not a guarantee of future performance. Actual results may differ materially from those anticipated in forward-looking or past performance statements. IC Markets makes no representation or warranty and assumes no liability as to the accuracy or completeness of the information provided, nor any loss arising from any investment based on a recommendation, forecast or any information supplied by any third-party.
SHORT and SHORT in GBPUSDHello Fellow traders,
I am sharing my short position in GBP/USD today.
I have decided to go short on GBP/USD, following the announcement of steep U.S. tariffs. Fundamentally, this aligns with my outlook: the USD is acting as a safe haven, while the GBP remains more risk-sensitive amidst global uncertainty.
From a technical standpoint—though I keep things simple—my analysis supports the bearish sentiment, and I have entered a short position accordingly.
Good luck, everyone, and trade safe!

What Happens the Day Jerome Powell Is Fired or Quits?A sudden exit by Fed Chair Jerome Powell would create both a political and monetary shock.
While the Chair is technically protected from arbitrary removal. Recent reports confirm that President Trump and his allies are scrutinising the Fed’s $2.5 billion renovation project—potentially laying the groundwork for a “for cause” dismissal.
A surprise departure would undermine confidence in the Fed’s independence. The U.S. dollar could fall sharply across major pairs.
USD/JPY could fall toward ¥145, with safe-haven demand favouring the yen. However, the reaction may be less severe than in pairs like Swiss franc which we have noted in the past is the potentially preferred safe haven. A panic selloff could extend to 142.20—a prior consolidation floor.
GBP/USD could surge as traders anticipate a more dovish Fed stance under the new Trump-stooge Fed Chair. From a technical perspective, GBP/USD is maybe already oversold and potentially poised for a potential rebound anyway—Powell’s resignation or firing could potentially exacerbate this. The first level to watch being a return to 1.3700, assuming the likely expectation of Fed rate cuts rise.

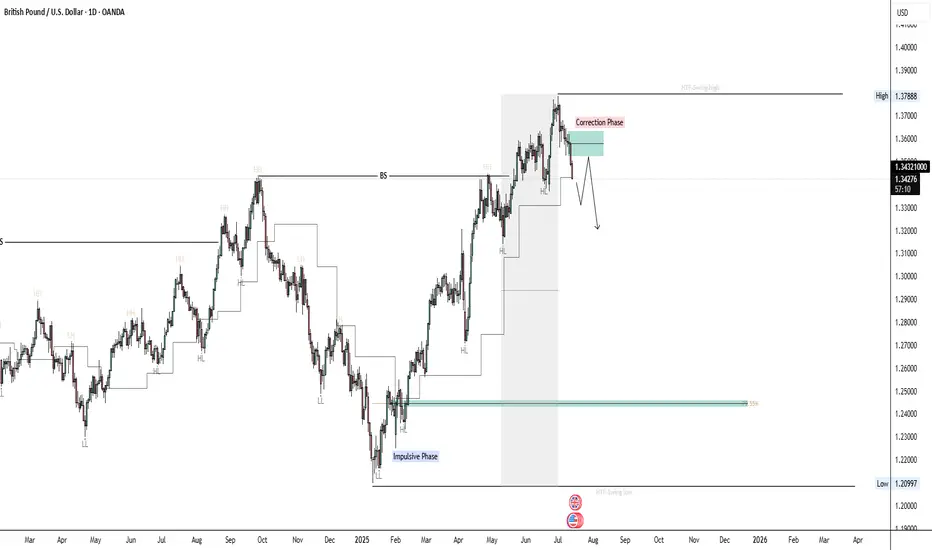
GBPUSD Swing Outlook 14-07-2025Hello Traders!
It's been a while since my last post on the market.
Here's a breakdown of GBPUSD.
Daily Timeframe:
1. We have been in a bullish trend, price forming HH and respecting HL. (impulsive phase)
2. By dragging our Fibonacci level from swing low to swing high, we can clearly see potential discounted levels where we can look for buying opportunities again.
3.(Corrective phase) Current price action indicates to us that price has a potential of closing below our last HL, which will indicate MMS/CHOCH and a start of a bearish trend.
4. What we know is that in a bearish trend price respects LH and breaks LL, and we should be looking for selling opportunities.
5. By using the H4 timeframe we can look for internal swing points where we can drag our Fibonacci to identify best-selling opportunities at a premium level. (This will be counter trend trading, and we can capitalize on it until we are in discounted levels again)
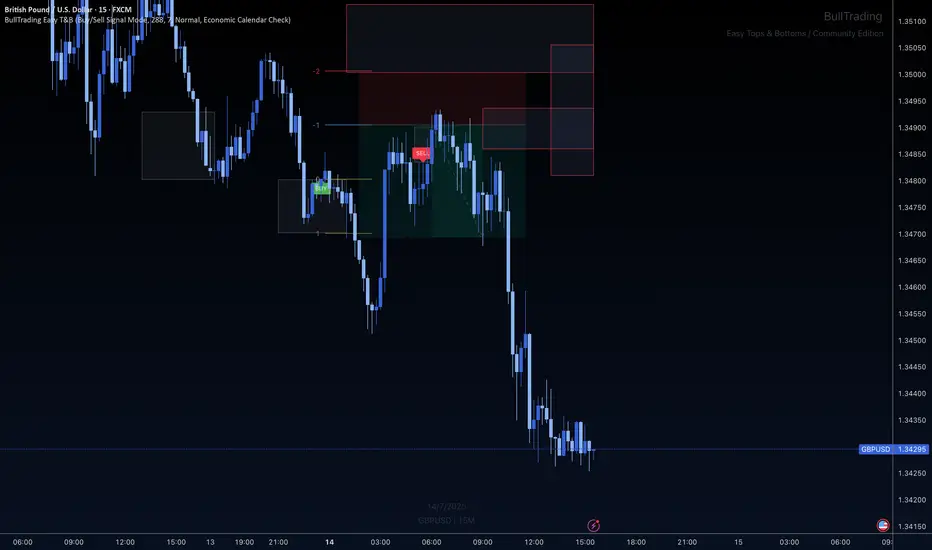
GBP/USD Breakdown Using BullTrading Easy Tops & BottomsIn this setup, GBP/USD broke down through a dynamic red zone printed by the BullTrading Easy Tops & Bottoms indicator (💥 Free for the entire community!).
This zone had previously acted as a potential resistance level, but price showed no respect on approach — instead, we saw strong acceleration through the level, confirming momentum and a liquidity imbalance.
🔍 Why This Mattered:
This indicator doesn’t predict — it highlights true dynamic support and resistance zones based on stop clustering and price behavior.
When price doesn’t respect a zone and breaks through it with strength, that alone tells a story:
When a support zone is broken, price will often rebalance ABOVE the same number of points/pips as the size of the zone itself — that’s your opportunity.
Smart money may be engineering a continuation move
The reaction after the zone is broken is key
In this case, the cleanest play was to use a SELL LIMIT above the broken support zone, and the market gave us clear bearish confirmation
📌 Educational Insight:
The edge isn’t just in the zones — it’s in how price reacts around them.
When a zone fails, it becomes a trigger point for directional bias.
Here, it offered a clean bearish confirmation to short the retest, with a precise stop-loss placed just above the broken structure.
✅ Lot sizing was adjusted based on the stop distance, usually 1:2 RR is optimal
Tighter SL = higher lot size
Wider SL = lower lot size
That keeps risk consistent and manageable.
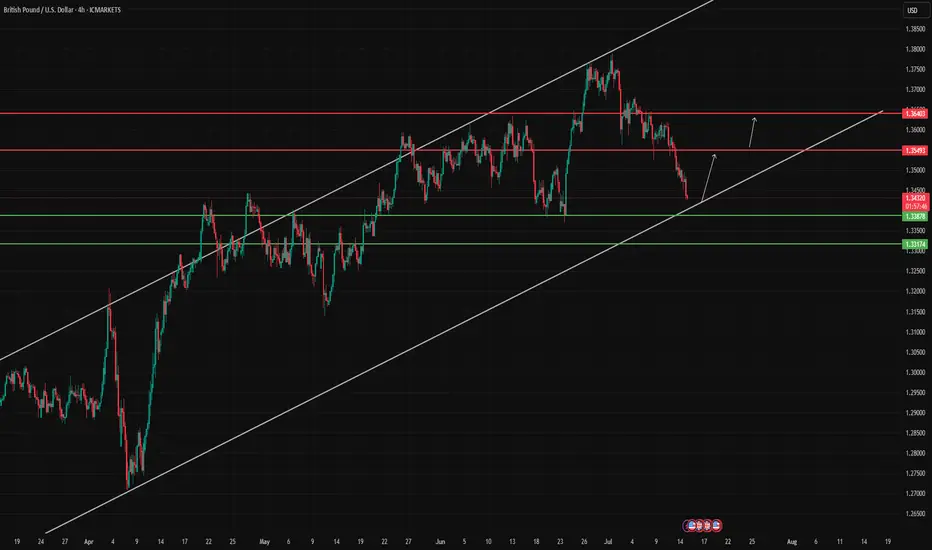
GBPUSD Internal Summary GBPUSD is approaching a key confluence area formed by a long-term channel and horizontal support. Bullish bounce is expected if this zone holds.
❌ Invalidation: Below 1.33174
GBP USD LONGAs it is near the bottom side of the channel, we could see a correction toward the target shown on the chart, if it bounces from this level.

GBPUSD(20250714)Today's AnalysisMarket news:
① Fed's Goolsbee: The latest tariff threat may delay rate cuts. ② The Fed responded to the White House's "accusations": The increase in building renovation costs partly reflects unforeseen construction conditions. ③ "Fed's megaphone": The dispute over building renovations has challenged the Fed's independence again, and it is expected that no rate cuts will be made this month. ④ Hassett: Whether Trump fires Powell or not, the Fed's answer to the headquarters renovation is the key.
Technical analysis:
Today's buying and selling boundaries:
1.3518
Support and resistance levels:
1.3621
1.3583
1.3558
1.3479
1.3454
1.3415
Trading strategy:
If the price breaks through 1.3518, consider buying in, with the first target price at 1.3558
If the price breaks through 1.3479, consider selling in, with the first target price at 1.3454

GBP/USD Bears Charge Yearly Trend Support- US / UK CPI on TapSterling broke below confluent support last week at the 61.8% retracement at of the June rally at 1.3530. The decline is now within striking distance of yearly trend support at 1.3388-1.3415- a region define by the 61.8% retracement of the May rally, the June close lows, and the 2024 high-day close. A good zone to reduce portions of short-exposure / lower protective stops IF reached. A break / close below would be needed to suggest a more significant high was registered this month / a larger reversal is underway.
Initial resistance now back at 1.3530 with a close above the 25% parallel needed to threaten resumption of the broader uptrend. Keep in mind we get the release of US / UK inflation data this week- stay nimble into the releases and watch the weekly close for guidance here.
-MB

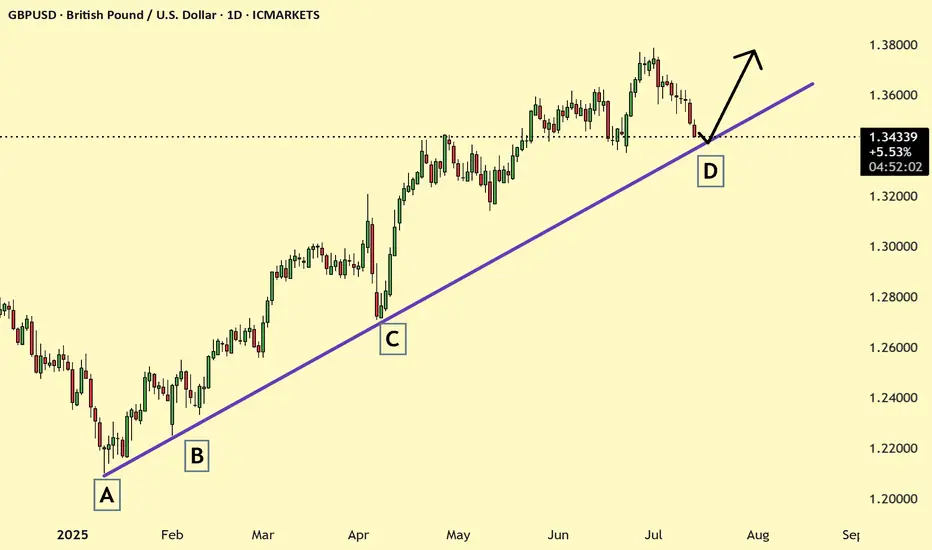
GBPUSD at Trendline support GBPUSD is Trending in uptrend and currently has reached trendline support and from this area the price may pullback to higher. Let us see
GBPUSD: Two Strong Bullish Area To Buy From ?GU is currently in a bullish trend when examined on a daily time frame. There are two potential areas for purchase. The first area is currently active, as we anticipate a price reversal from this point. There is a significant possibility that price could decline to the second area and subsequently reverse from there directly. The sole reason we believe price could drop to the second area is if the US Dollar experiences corrections, which could cause GU to drop to our second area and subsequently rebound.
If you appreciate our analysis, we kindly request that you consider the following actions:
-Liking the Ideas
-Commenting on the Ideas
-Sharing the Ideas
We extend our sincere gratitude for your continuous support. We trust that our insights have provided even a modicum of assistance.
Team Setupsfx_
❤️🚀

Lets fly high togetherGBPUSD looking bearish lets go against of trend we have a pullback possible now
BUY @ 1.34549 posssible we can take around 300 pips easily hope win this setup happy trading use proper money management stay strong follow ALBERT
Wait for a sell confirmation and don't forget to use a stop lossThe market structure suggests a strong bearish trend with a potential breakout below 1.3400, supported by the descending triangle and bearish indicators

Skeptic | GBP/USD Update: Triggers Fired Up!Hey everyone, it’s Skeptic! ;) yesterday, the support at 1.35672 saw a fake breakout and snapped back into the 4-hour box we’ve been tracking. But bearish momentum is still strong, so here’s the play:
✔️ If you opened a short already , With the fake breakout signaling potential momentum shift, consider taking profits or closing if price consolidates above 1.36089. Why? The fakeout increases the chance of a momentum change.
✨ For new short positions , the 1.35672 break remains a valid trigger. If it breaks again, it could kickstart a major bearish leg, targeting lower supports at 1.35000 and 1.34227 —both strong reaction zones.
📊 The HWC is uptrend, so shorts need extra caution—reduce risk or take profits early.
📉 For longs , wait for a break and consolidation above 1.36406 . This level saw a strong rejection, signaling it’s a key resistance the market respects. A break here, liquidating short positions (which means buying), could spark a solid uptrend leg with great R/R potential.
🔔 Confirmation : Use RSI entering oversold for shorts or overbought for longs. The HWC uptrend means shorts carry higher risk, so tighten your risk management—stick to 1%–2% risk per trade.
🔼 Key Takeaway: Short at 1.35672 if it breaks again, long at 1.36406 with confirmation. Stay sharp for momentum shifts and keep stops tight. I’ll update if the market structure flips!
💬 Let’s Talk!
Which GBP/USD trigger are you locked on? Hit the comments, and let’s crush it together! 😊 If this update lit your fire, smash that boost—it fuels my mission! :)))

SHORT GUAH = Asain High
OP = Open Price
AL = Asain Low
Purpose of short
Because of FVG in 15m
Entry Pattern = M pattern in 5 mins
