USDGBP trade ideas

sell GUThe up trend is broken as you can see and we are going down with a good momentom and also in 15m time frame our most recent support is broken and there is nothing else to push the price higher

gbpusdthis setup valid if there is good nfp for usd other wise previous trade is running for buy side

Fundamental Market Analysis for June 6, 2025 GBPUSDThe GBP/USD pair is trading near 1.3570 with little movement ahead of the US (US) labor market data.
The US Dollar Index (DXY), which measures the value of the US Dollar against six major currencies, is trading above around 98.80 at the time of writing. The upcoming US non-farm payrolls data for May is expected to add 130,000 jobs, down from April's 177,000. The unemployment rate is also expected to remain unchanged at 4.2%.
Weekly initial jobless claims rose to 247,000, above the 235,000 expected, U.S. Labor Department data showed. ADP US private sector employment data released on Thursday showed a 37,000 increase in May versus a 60,000 increase (revised from 62,000) recorded in April, well below market expectations of 115,000.
GBP/USD is gaining support as the Pound Sterling (GBP) finds support amid rising risk sentiment in the United Kingdom (UK) markets following US President Donald Trump's executive order signed on Tuesday. British exporters still face the previous 25 percent tariff rate as Trump granted the UK temporary relief from the US' stiff 50 percent tariffs on steel and aluminum.
Trading recommendation: SELL 1.3500, SL 1.3600, TP 1.3300

check the trendWith the support trend line break, the continuation of the downward trend will be likely. Then, considering the price behavior in the specified support area, there is a possibility of a trend change and the start of an upward trend.

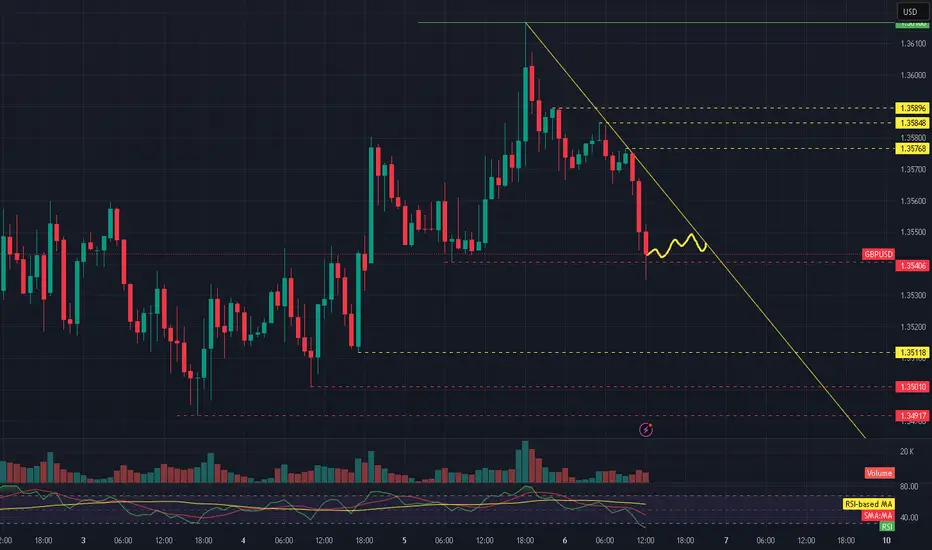
GBPUSD - hoyrly chartTrading idea:
Short once support 1.35406 is broken!
Support and resistance:
🔴 Resistance Levels:
1.35768 — the nearest key resistance; a recent swing high before the current decline.
1.35848 – 1.35896 — resistance zone where previous pullbacks and consolidations occurred; could act as a ceiling if retested.
1.36100 — the upper boundary of the range, a potential target if the price breaks out higher.
🟡 Support Levels:
1.35406 — current price level near local support; the price is attempting to build a base here.
1.35118 — an important support level that previously triggered bullish reversals.
1.35010 — an additional support area near recent lows.
1.34917 — strong support, aligned with a previous bottom that marked the beginning of an upward impulse.
🔍 Additional Notes:
The price is consolidating near the lower edge of the short-term range, under pressure from the descending trendline.
RSI is approaching neutral territory — a potential for a reversal exists, but no clear signal yet.
Volume remains moderate, suggesting limited activity from major players — increasing the probability of a sideways move in the near term.
GU-Fri-6/06/25 TDA-This week mostly after news driven PA!Analysis done directly on the chart
Follow for more, possible live trades update!
PA= price action
This week unless you're good fundamental
analyst or taking good advantage of fundamental news,
it was not easy to trade normal price action. (at least for me)
Since I trade only London session, and majority of moves
happen in NY session after news release.
This week was not the best for me, keeping myself low risk
max medium risk trades.
Active in London session!
Not financial advice, DYOR.
Market Flow Strategy
Mister Y

GBPUSD Trading Analysis ### 1. Overall Trend & Market Context
- Bullish Momentum: GBPUSD is in a strong bullish trend, driven by DXY weakness (U.S. Dollar Index declining) and GBP strength. Key factors include:
- Fundamental Drivers:
- UK manufacturing contraction (less severe than expected) and rising housing prices.
- U.S. dollar weakness due to manufacturing slowdown (ISM PMI at 48.5), trade tensions, and fiscal concerns.
- Fed policy uncertainty (rates likely to remain unchanged post-May cut).
- Technical Drivers: Higher lows and higher highs on the 4-hour chart, indicating trend continuation.
### 2. Key Technical Levels & Patterns
- Support Zones:
- 1.3490–1.3500: A critical support area (pullback retracement, 61.8% Fibonacci level).
- 1.34420: Stop-loss level for long positions (below the liquidity pocket).
- Resistance Levels:
- 1.3580: Target for bullish breakout.
- 1.37370: Next major resistance (1:2 risk-reward setup).
- Patterns:
- Bullish Flag: Breakout above key resistance (1.3430) followed by consolidation.
- Broadening Wedge: High volatility pattern with widening highs/lows; potential for breakout (bullish or bearish).
- Bullish Engulfing: Confirmed entry after breaking key support/resistance.
### 3. Trading Opportunities
- Buy Zones:
- 1.3490–1.3500: Entry on breakout from consolidation range (1.3500).
- 1.35260: Buy limit for a liquidity hunt below minor intraday lows.
- Take Profit:
- 1.3580 (first resistance) and 1.37370 (measured move target).
- Risk Management:
- Stop-loss at 1.34420 (below support).
- 1:2 risk-reward ratio for long positions.
### 4. Key Risks & Considerations
- Bearish Scenarios:
- Failure to hold above the breakout zone (1.3500).
- Pressure from resistance at 1.3580.
- Return to consolidation range, delaying the upside move.
- Volatility: Broadening wedge patterns may fake out traders, emphasizing the need for strict risk management.
### 5. Fundamental Outlook
- GBP Strength: UK economic data (housing, manufacturing) supports GBP.
- USD Weakness: U.S. manufacturing slowdown, trade tensions, and fiscal concerns weigh on the dollar.
- Fed Policy: Markets expect rate cuts to continue, further pressuring USD.
### 6. Final Notes & Disclaimers
Stay disciplined, manage risk, and let the market confirm your trades. 📈
*Disclaimer: This is for educational purposes only. Trading involves risk; ensure you understand the risks before trading.*

Bullish continuation?The Cable (GBP/USD) is falling towards the pivot, which is an overlap support and could rise to the 1st resistance.
Pivot: 1.3507
1st Support: 1.3420
1st Resistance: 1.3644
Risk Warning:
Trading Forex and CFDs carries a high level of risk to your capital and you should only trade with money you can afford to lose. Trading Forex and CFDs may not be suitable for all investors, so please ensure that you fully understand the risks involved and seek independent advice if necessary.
Disclaimer:
The above opinions given constitute general market commentary, and do not constitute the opinion or advice of IC Markets or any form of personal or investment advice.
Any opinions, news, research, analyses, prices, other information, or links to third-party sites contained on this website are provided on an "as-is" basis, are intended only to be informative, is not an advice nor a recommendation, nor research, or a record of our trading prices, or an offer of, or solicitation for a transaction in any financial instrument and thus should not be treated as such. The information provided does not involve any specific investment objectives, financial situation and needs of any specific person who may receive it. Please be aware, that past performance is not a reliable indicator of future performance and/or results. Past Performance or Forward-looking scenarios based upon the reasonable beliefs of the third-party provider are not a guarantee of future performance. Actual results may differ materially from those anticipated in forward-looking or past performance statements. IC Markets makes no representation or warranty and assumes no liability as to the accuracy or completeness of the information provided, nor any loss arising from any investment based on a recommendation, forecast or any information supplied by any third-party.

Same type of reversal pattern formed on XAUUSD & GBPUSD This is the reversal pattern early sign on M15 time frame which can help you to be flexible on current market structure what price is going to do. (Early sign of Sweep in Higher Time frame).
Bearish argument formed as 15M FVG after taken out High and started to respect those Point of interest and trade lower continiously.

GBPUSD Potential UpsidesHey Traders, in today's trading session we are monitoring GBPUSD for a buying opportunity around 1.35400 zone, GBPUSD is trading in an uptrend and currently is in a correction phase in which it is approaching the trend at 1.35400 support and resistance area.
Trade safe, Joe.

GBP/USD – Bullish Continuation SetupFollowing a clear bullish structure, price recently printed a HH and now hovers above an unmitigated demand zone.
We're anticipating a pullback into the OB followed by strong continuation upward.
Buy Limit: 1.35150
SL: 1.34490
TP1: 1.35750
TP2: 1.36100
Structure: Bullish ✅
OB Mitigation: Pending ✅
Weak High Target: Above HH ✅
"Watch for clean mitigation followed by impulsive reaction before executing."

GBPUSD LONGWhen the price turns to the Sellside and sweep probably during Asian or start of London session I expect the price will go higher and take EQH

Bearish drop off pullback resistance?GBP/USD is reacting off the resistance level which is a pullback resistance that aligns with the 138.2% Fibonacci extension and could drop from this level to our take profit.
Entry: 1.3590
Why we like it:
There is a pullback resistance that aligns with the 138.2% Fibonacci extension.
Stop loss: 1.3629
Why we like it:
There is a resistance level at the 100% Fibonacci projection.
Take profit: 1.3535
Why we like it:
There is an overlap support level that aligns with the 61.8% Fibonacci retracement.
Enjoying your TradingView experience? Review us!
Please be advised that the information presented on TradingView is provided to Vantage (‘Vantage Global Limited’, ‘we’) by a third-party provider (‘Everest Fortune Group’). Please be reminded that you are solely responsible for the trading decisions on your account. There is a very high degree of risk involved in trading. Any information and/or content is intended entirely for research, educational and informational purposes only and does not constitute investment or consultation advice or investment strategy. The information is not tailored to the investment needs of any specific person and therefore does not involve a consideration of any of the investment objectives, financial situation or needs of any viewer that may receive it. Kindly also note that past performance is not a reliable indicator of future results. Actual results may differ materially from those anticipated in forward-looking or past performance statements. We assume no liability as to the accuracy or completeness of any of the information and/or content provided herein and the Company cannot be held responsible for any omission, mistake nor for any loss or damage including without limitation to any loss of profit which may arise from reliance on any information supplied by Everest Fortune Group.

GBP/USD SELL SETUP🔥 GBP/USD KILLER SHORT SETUP (High Conviction) 🔥
ENTRY: 1.3550-1.3555 (Price rejection + bearish candle)
STOP: 1.3565 (Above today's high)
TARGETS:
1.3520 (Quick scalp)
1.3500 (Key support)
1.3470 (Trend continuation)

Market next target 🧨 Disruption Points:
1. Bullish Accumulation Underway
The recent candles show higher lows and lower volume on red candles, suggesting selling pressure is decreasing.
> Disruptive scenario: Price may bounce off minor support (around 1.3560–1.3570) and form a higher low, triggering a bullish rally back above 1.3620.
---
2. Fake Bearish Setup (Liquidity Trap)
The three arrows predicting a drop might represent a classic retail trap where too many anticipate the same direction.
> Contrary idea: A false breakdown below 1.3550 may occur just to collect stop-losses, followed by a strong reversal upward.
---
3. Divergence Risk
If momentum indicators (e.g., RSI, MACD) show bullish divergence while price moves sideways or dips, it may signal an upcoming bullish impulse.
> Disruption: Downward arrows may be misinterpreting consolidation as weakness rather than a setup for continuation of the previous uptrend.
---
4. Fundamental Wildcard
The chart shows an upcoming U.S. economic event, likely to impact the dollar.
If the data is weak for the USD, GBP/USD could surge sharply, invalidating the bearish scenario.

GBP/USD Buy Signal Active Now Entry Point: 1.35800 (Buy Now)GBP/USD Buy Signal Active Now
Entry Point: 1.35800 (Buy Now)
🎯 Target 1: 1.35400
🎯 Target 2: 1.35000
🎯 Target 3: 1.34500
🎯 Final Target: 1.34200
📊 Setup:
We are entering a short-term buy position with carefully placed targets.
This trade is based on current market structure and technical indicators.
Entry confirmed after key support was tested and held.
🛡️ Risk Management is Key:
✅ Use a tight stop-loss
✅ Risk only what you can afford to lose
✅ Recommended SL: Above 1.36000
✅ Maintain position sizing discipline
💡 Be patient and follow the plan
📉 Trend direction still under analysis for the bigger picture
🔁 Always reassess your trades as market conditions evolve
Stay sharp and trade safe!
#Forex #GBPUSD #TradeSignal #RiskManagement #ForexTrading

GBPUSD(20250605)Today's AnalysisMarket news:
U.S. economic data-① ADP employment increased by 37,000 in May, far below the expected 110,000 and the previous value of 62,000. ② The U.S. ISM non-manufacturing index in May fell to 49.9, shrinking for the first time in nearly a year, and the expected increase was from 51.6 to 52.
Technical analysis:
Today's buying and selling boundaries:
1.3543
Support and resistance levels:
1.3622
1.3593
1.3574
1.3513
1.3494
1.3465
Trading strategy:
If the price breaks through 1.3574, consider buying, and the first target price is 1.3593
If the price breaks through 1.3543, consider selling, and the first target price is 1.3513

GBP/USD Bulls Eye Breakout Ahead of NFPA rebound off former resistance is now testing the highs with the weekly / monthly opening-range taking shape just below. GBP/USD is attempting to breach the yearly 75% parallel in early US trade on Thursday. The immediate focus is on today’s close with respect to this threshold.
Initial support rests with the weekly open / 2024 high at 1.3434. Note that the median-line converges on this threshold over the next few days and a break / close below would threaten a larger correction within the broader uptrend towards the 61.8% retracement of the May advance at 1.3313 and bullish invalidation at the May low-day close (LDC) near 1.3176.
A topside breach above the 75% parallel would threaten resumption towards subsequent resistance objectives at the 2022 high-day close (HDC) at 1.3705 and the 100% extension of the January advance at 1.3816- look for a larger reaction there IF reached.
Bottom line: The British Pound is testing confluent resistance at the yearly high and the focus is on a possible price inflection off this pivot zone- watch today’s close. From a trading standpoint, losses should be limited to 1.3434 IF price is heading higher on this stretch with a close above the 1.36 needed to mark uptrend resumption.
Keep in mind we are in the early throws of the June opening-range with U.S. Non-Farm Payrolls slated for tomorrow morning and key inflation data (CPI) on tap next week. Stay nimble into the releases and watch the weekly closes here for guidance.
-MB

EURUSD short term analysis in US sessionEURUSD is trading in the price range of 1.161 and 1.158. It is unlikely that there will be a breakout through this price range today. If the pair retreats slightly to 1.156, it is considered a good buy signal. Let's wait and see what the next short-term developments of EURUSD are.
I will send you the long term analysis of the pair tomorrow.

London Take 1 - 5/6/2025 - GBPUSDInitial comments ...updates will follow as usual.
London Setup for GBPUSD.

LONDON BREAKOUT STRATEGY (GBP/USD) 6/5/2025today i wasnt near my laptop so i couldn't post this earlier , as you can see the trade is about to hit the tp ...
.
.
.
theses london breakout strategy feels good its well designed and simple , for the post news strategy its good that you have timing box that you have to trade that but the cons is yet to be explored for me and it has like a cycle somtimes it works very well and sometimes you have to eat too many losses back to back , ill cemplete the june then share my ideas about this strategeis . also want to test fvg strategy for weekend, if u want say the time frame ,indicator or month to test things out...

GBPUSD M15 Support & Resistance Levels🚀 Here are some key zones I've identified on the 15m timeframe.
These zones are based on real-time data analysis performed by a custom software I personally developed.
The tool is designed to scan the market continuously and highlight potential areas of interest based on price action behavior and volume dynamics.
Your feedback is welcome!
