Sterling Strengthens Amid BoE and NFP FocusOn Tuesday, June 3, 2025, GBP/USD traded near 1.3530 as the British pound strengthened, supported by U.S. dollar weakness driven by soft economic data and trade tensions. The outlook for the UK economy remained relatively upbeat. Markets now focus on the upcoming U.S. non-farm payroll report and any signals from the Bank of England. A potential BoE rate cut could pressure the pound, while continued weak U.S. data may weigh on the dollar.
The first critical support for gold is seen at 1.3425 and the first resistance is located at 1.3600.
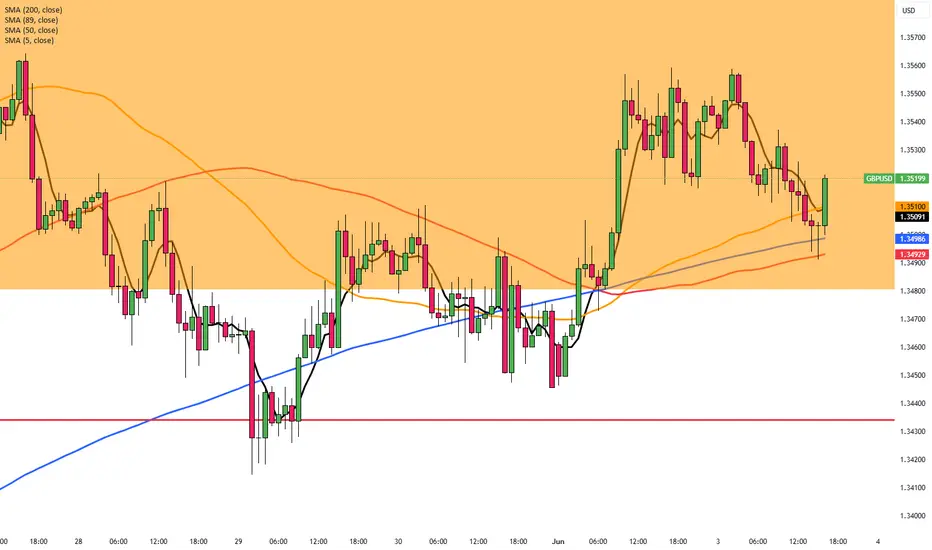
USDGBP trade ideas
GBP/USD M15 Support & Resistance Levels🚀 Here are some key zones I've identified on the 15m timeframe.
These zones are based on real-time data analysis performed by a custom software I personally developed.
The tool is designed to scan the market continuously and highlight potential areas of interest based on price action behavior and volume dynamics.
Your feedback is welcome!

GBPUSD Poised for a Bearish Move - UPDATEGBPUSD Poised for a Bearish Move - UPDATE
A few days ago, I shared a GBPUSD chart that showed signs of a correction. Now, that correction appears to be complete, and the likelihood of a larger decline is increasing. The exact catalyst for this move is uncertain, but the setup looks promising and could trigger a liquidity release.
On the 4-hour chart, GBPUSD has formed a rough variation of a Harmonic Pattern. Although this pattern isn’t perfect, it effectively blocked the price from climbing above 1.3590.
GBPUSD now seems poised for a bearish trend.
Targets: 1.3350 | 1.3250 | 1.3170
You may find more details in the chart!
Thank you and Good Luck!
❤️PS: Please support with a like or comment if you find this analysis useful for your trading day❤️
Disclosure: I am part of Trade Nation's Influencer program and receive a monthly fee for using their TradingView charts in my analysis.


GBPUSDJust a thought , Understand first we're looking at a reversal , those are not for the faint of hearts , They can be rough with a lot of people looking to just destroy the pair once and for all, Mind you a lot more money wants to save it , we're talking about two of the most stable currencies , Lets see who wins , Hope you leverage the right side .

Long Broadening Wedge 1 TF for 4 Hour FibA broadening wedge is a chart pattern where price action forms higher highs and lower lows, creating a widening structure. There are two main types:
Broadening Ascending Wedge – Bullish bias (eventually breaks up).
Broadening Descending Wedge – Bearish bias (eventually breaks down).
Key Characteristics:
Appears during high volatility.
Shows increasing price swings.
Often found in both continuation and reversal scenarios.
Can fake out both bulls and bears, so risk management is crucial.

GBPUSD – Is the Recovery Losing Steam? GBPUSD – Is the Recovery Losing Steam? Watch for Technical Pullback Ahead of NFP
The GBPUSD pair has recently rebounded impressively from the 1.3427 key support zone, reflecting short-term USD weakness and growing speculation of rate cuts by the Fed. However, after the strong bullish move, the market is now showing signs of exhaustion and potential profit-taking—especially with high-impact US employment data just around the corner.
🔍 Macro & Fundamental Overview:
United States: All eyes are on this week’s JOLTS and Non-Farm Payrolls (NFP) reports. Weak jobs data could strengthen the case for rate cuts by the Fed in Q3, weighing on the US Dollar. On the flip side, a solid print would revive “higher for longer” rate expectations and likely support USD strength.
United Kingdom: Although inflation remains above the Bank of England’s 2% target, political uncertainty ahead of July’s general election may keep GBP on the defensive, especially if BoE signals a dovish turn.
Bond Yield Spread (UK vs US): A widening spread in favor of the USD is exerting downward pressure on GBPUSD in the medium term.
📈 Technical Outlook (H1 Chart):
Structure: Price has formed a double-top pattern at 1.35598 and 1.35322, with multiple rejections—signaling a weakening bullish momentum after a sustained rally.
EMA 13 – 34 – 89 – 200 Setup: Price is currently testing the EMA89 zone (~1.34854). A clean break below this moving average could accelerate the downside correction.
FVG Zone (Liquidity Pool): The 1.3427 – 1.3457 area offers a potential liquidity sweep and may serve as a springboard for the next bullish leg.
📊 Trade Scenarios:
🔻 Short-Term SELL SCALP:
Entry: 1.3532 – 1.3545
Stop Loss: 1.3565
Take Profit: 1.3485 → 1.3457 → 1.3427
→ Ideal if price fails to hold above recent highs and forms bearish rejection candles.
🔵 BUY ZONE Setup:
Entry: 1.3427 – 1.3440
Stop Loss: 1.3400
Take Profit: 1.3475 → 1.3505 → 1.3535 → 1.3555
→ High-probability entry if price reacts positively to the FVG zone and maintains bullish structure.
📌 Final Thoughts:
GBPUSD is currently in a delicate zone where both technical and macro forces are converging. While the broader trend remains bullish, momentum is slowing. With critical US jobs data due, traders should stay cautious and rely on clear confirmations around key price levels. Maintain strict risk management and look for liquidity-driven moves around FVG zones.

BULLISH GUPrice has broken Key Resistance & Retested.
Entry was after the Bullish Engulfing on the 1HR/Fib Retracement Zone/Break and Retest of Key Support
TP 1 - 1.35555 | 1st Resistance
TP 2 - 1.35816 | -27 Extension
TP 3 - 1.36138 | -61.8 Extension

GBP/USD SHORT FROM RESISTANCE
GBP/USD SIGNAL
Trade Direction: short
Entry Level: 1.352
Target Level: 1.327
Stop Loss: 1.369
RISK PROFILE
Risk level: medium
Suggested risk: 1%
Timeframe: 12h
Disclosure: I am part of Trade Nation's Influencer program and receive a monthly fee for using their TradingView charts in my analysis.
✅LIKE AND COMMENT MY IDEAS✅

"GBPUSD Watching the Reaction Around Key Liquidity Levels"In this video, I break down the current GBPUSD structure and share my view based on higher timeframes.
I’m paying close attention to how price reacts near key liquidity zones, especially after recent sweeps.
No signals just perspective.
Let’s see how it plays out.

GBPUSD LONGThe price broke the downward trendline with impulse movement, retraced and retest the structure and broke the correction. i expect to move further tpo the upside.

GBP/USD LONG GBP/USD LONG " break of a resistance area and retest it + 50% fib retracement + 50 ema dynamic support "

Fundamental Market Analysis for June 3, 2025 GBPUSDThe GBP/USD pair attracted sellers during Tuesday's Asian session and broke part of a strong overnight move up towards the 1.3560 area, or multi-day peak.
The U.S. Dollar Index (DXY), which tracks the dollar against a basket of currencies, rebounded from a six-week low reached on Monday and proved to be a key factor putting downward pressure on the GBP/USD pair.
In addition, concerns over the deteriorating US fiscal situation and renewed trade tensions between the US and China should help limit USD gains. The British Pound (GBP), on the other hand, may continue to receive support from expectations that the Bank of England (BoE) will take a pause at its next meeting on June 18 and will not rush to cut interest rates further.
Traders may also prefer to wait for the hearing of the Bank of England's monetary policy report in Parliament. Investors will be closely watching comments from Bank of England Governor Andrew Bailey and other members of the Monetary Policy Committee (MPC) for information on the policy outlook, which in turn will influence the GBP exchange rate.
Trading recommendation: SELL 1.3495, SL 1.3595, TP 1.3295

LONDON BREAKOUT STRATEGY (GBP/USD) 2as its in the plan the market broke above the london pre opening zone so i opend a buy, right now, when I'm writing this market is close to my stop loss, its part of the process we have to be emotionless and go as planed and back tested before , lets see ...

GU-Tue-3/06/25 TDA-DR 1.35577 tapped, GU consolidatingAnalysis done directly on the chart
Follow for more, possible live trades update!
Consistency, build solid confidence in your
execution, management. It's not easy, but
if your plan is to stay for the long term. With
discipline, consistently showing off, patience,
dedication, study, learn, apply. You'll eventually
get there!
Not financial advice, DYOR.
Market Flow Strategy
Mister Y

GBPUSD POSSIBLE BUY Price has been going up since the beginning of business days and price hasn't changed direction,so trading uptrend with the trend is our friend until it fails us

GBPUSD SHORT FORECAST Q2 W23 D3 Y25GBPUSD SHORT FORECAST Q2 W23 D3 Y25
🔥👀TECHNICAL HOT PICK
Professional Risk Managers👋
Welcome back to another FRGNT chart update📈
Diving into some Forex setups using predominantly higher time frame order blocks alongside confirmation breaks of structure.
Let’s see what price action is telling us today!
💡Here are some trade confluences📝
✅Weekly order block
✅15' order block
✅4 hour order block
✅Tokyo ranges to be filled
🔑 Remember, to participate in trading comes always with a degree of risk, therefore as professional risk managers it remains vital that we stick to our risk management plan as well as our trading strategies.
📈The rest, we leave to the balance of probabilities.
💡Fail to plan. Plan to fail.
🏆It has always been that simple.
❤️Good luck with your trading journey, I shall see you at the very top.
🎯Trade consistent, FRGNT X

GBP/USD 4-Hour Technical & Fundamental AnalysisGBP/USD 4-Hour Technical & Fundamental Analysis
GBP/USD has pushed to a new multi-year high, breaking above key resistance as both technical and fundamental drivers favor the British Pound. The 4-hour chart reveals a strong bullish structure, with a sequence of Higher Lows and Higher Highs, signaling trend continuation amid smart money accumulation.
Price decisively broke above the major resistance at 1.34300, which now acts as structural support. Following the breakout, GBP/USD retested the level and consolidated above 1.3500, forming an accumulation zone. A liquidity hunt below minor intraday lows could provide a refined long opportunity, aligning with bullish momentum.
If price dips into the liquidity zone and reacts with bullish confirmation, the pair is likely to resume its upward trajectory, offering an attractive long setup with solid risk-reward potential.
📊 Trade Setup
📍 Area of Interest (AOI): 1.35260 (Buy Limit)
🛡 Stop-Loss: 1.34420 (Below support/liquidity pocket)
🎯 Take Profit: 1.37370 (Next major resistance / 1:2 RR)
This setup aligns with institutional bullish flow and offers a roadmap for catching the next impulsive leg to the upside.
📰 Fundamental Outlook
🇬🇧 GBP Strength vs 🇺🇸 USD Weakness
British Pound Strengthening:
UK Manufacturing: Contracted less than expected in May.
Housing Market: House prices rose 3.5% YoY, signaling strong domestic demand.
Bank of England Outlook: Markets expect rates to remain unchanged at the June 18 meeting after the recent 0.25% rate cut, showing a cautious but steady approach.
U.S. Dollar Under Pressure:
Manufacturing Slowdown: ISM Manufacturing Index dropped to 48.5, marking the 4th consecutive contraction — below the 50.0 threshold.
Trade Tensions: U.S. tariffs on steel and aluminum doubled to 50%, triggering renewed concerns.
Fiscal Concerns: Rising U.S. debt and unclear fiscal direction are weighing on USD.
Labor Market Weakness: Today’s JOLTS Job Openings report came in at 7.11M, down from 7.19M, suggesting cooling demand in the labor market.
📌 Disclaimer:
This is not financial advice. Always wait for proper confirmation before executing trades. Manage risk wisely and trade what you see—not what you feel.

GBPUSD H1 I Bullish Bounce Based on the H1 chart analysis, the price is falling toward our buy entry level at 1.3491, a pullback support that aligns with the 61.8% Fibonacci retracement.
Our take profit is set at 1.3519, a pullback resistance.
The stop loss is placed at 1.3473, a swing low support.
High Risk Investment Warning
Trading Forex/CFDs on margin carries a high level of risk and may not be suitable for all investors. Leverage can work against you.
Stratos Markets Limited (tradu.com ):
CFDs are complex instruments and come with a high risk of losing money rapidly due to leverage. 63% of retail investor accounts lose money when trading CFDs with this provider. You should consider whether you understand how CFDs work and whether you can afford to take the high risk of losing your money.
Stratos Europe Ltd (tradu.com ):
CFDs are complex instruments and come with a high risk of losing money rapidly due to leverage. 63% of retail investor accounts lose money when trading CFDs with this provider. You should consider whether you understand how CFDs work and whether you can afford to take the high risk of losing your money.
Stratos Global LLC (tradu.com ):
Losses can exceed deposits.
Please be advised that the information presented on TradingView is provided to Tradu (‘Company’, ‘we’) by a third-party provider (‘TFA Global Pte Ltd’). Please be reminded that you are solely responsible for the trading decisions on your account. There is a very high degree of risk involved in trading. Any information and/or content is intended entirely for research, educational and informational purposes only and does not constitute investment or consultation advice or investment strategy. The information is not tailored to the investment needs of any specific person and therefore does not involve a consideration of any of the investment objectives, financial situation or needs of any viewer that may receive it. Kindly also note that past performance is not a reliable indicator of future results. Actual results may differ materially from those anticipated in forward-looking or past performance statements. We assume no liability as to the accuracy or completeness of any of the information and/or content provided herein and the Company cannot be held responsible for any omission, mistake nor for any loss or damage including without limitation to any loss of profit which may arise from reliance on any information supplied by TFA Global Pte Ltd.
The speaker(s) is neither an employee, agent nor representative of Tradu and is therefore acting independently. The opinions given are their own, constitute general market commentary, and do not constitute the opinion or advice of Tradu or any form of personal or investment advice. Tradu neither endorses nor guarantees offerings of third-party speakers, nor is Tradu responsible for the content, veracity or opinions of third-party speakers, presenters or participants.

BUY OPPORTUNITYGBP/USD Trade
Entry: 1.35229
Take Profit (TP): 1.35545
Stop Loss (SL): 1.35144
Risk-Reward Ratio: 1:3
Technical Analysis
Price Action:
The GBP/USD pair is currently trading within a tight range between 1.35160 (support) and 1.35582 (resistance) on the 15-minute timeframe. Price has shown multiple touches on both ends of this range, indicating a consolidation phase where neither buyers nor sellers have taken control.
ADX Indicator:
The Average Directional Index (ADX) is hovering around 10, which signals very weak trend strength and confirms the current consolidation. This means the market lacks clear momentum to break out decisively in either direction, increasing the probability of price continuing to oscillate within this range in the short term.
Oscillators & Momentum:
With weak ADX and price stuck within the range, momentum indicators suggest limited directional bias. This setup is ideal for a mean reversion or range trading strategy, where the price is expected to bounce between support and resistance.

GBPUSDGBP/USD Upcoming Economic Data, 10-Year Bond Yield, Interest Rate Differential, and Carry Trade (June 1–10, 2025)
1. Upcoming Economic Data (June 1–10, 2025)
Date Event Expected Impact on GBP/USD
June 2 UK PMI Composite (May) Strong PMI supports GBP; weak data pressures GBP
June 3 UK Services PMI Key for assessing UK economic momentum; influences GBP sentiment
June 4 UK Construction PMI Reflects sector health; positive print supports GBP
June 6 US Nonfarm Payrolls (NFP) Strong US jobs data strengthens USD, pressures GBP/USD
June 6 US Average Hourly Earnings Wage growth impacts Fed policy outlook and USD strength
June 9 UK GDP (Preliminary Q1) Critical for BoE policy outlook; strong GDP supports GBP
June 10 UK CPI Inflation (May) Higher inflation may delay BoE cuts, supporting GBP
Note: UK inflation data recently printed higher than expected, and US jobs data will be a major driver of USD strength.
2. 10-Year Bond Yields and Interest Rate Differential
UK 10-Year Gilt Yield: Approximately 4.77% (as of late May 2025)
US 10-Year Treasury Yield: Approximately 4.51% (late May 2025)
Yield Spread:
4.77% (UK)−4.51% (US)=+0.26%
The UK’s higher bond yield provides a modest carry advantage for GBP over USD.
Policy Rates:
Bank of England (BoE): 4.25% (recently cut by 25bps)
Federal Reserve (Fed): 4.25–4.50%
Interest Rate Differential: Slightly favors USD on policy rates but favors GBP on bond yields.
3. Carry Trade Directional Bias
The carry trade involves borrowing in a currency with lower interest rates and investing in one with higher yields.
Given the UK’s higher 10-year gilt yields (+0.26%), there is a modest carry trade advantage supporting GBP against USD.
However, the Fed’s slightly higher policy rate and the BoE’s dovish stance (rate cuts expected) temper this advantage.
Overall, the carry trade bias for GBP/USD is neutral to slightly bullish for GBP, supported by bond yields but capped by policy rate expectations.
4. Technical and Market Outlook
GBP/USD recently tested resistance near supply roof and faced selling pressure, but got support the broken supply roof on daily and now trades on the floor as demand .
Market sentiment remains cautious due to geopolitical uncertainties and tariff negotiations impacting USD strength.
The upcoming US jobs data (June 6) is a key event that could sway USD and thus GBP/USD direction.
Summary Table
Metric UK (GBP) US (USD)
10-Year Bond Yield ~4.77% ~4.51%
Policy Interest Rate 4.25% (BoE) 4.25–4.50% (Fed)
Yield Spread (10Y) +0.26% (GBP over USD) —
Interest Rate Differential Slightly favors USD —
Carry Trade Directional Bias Neutral to slightly bullish for GBP —
Key Upcoming Data UK PMI, GDP, CPI US NFP, Wage Data
Conclusion
GBP/USD faces a mixed outlook with modest carry trade support from higher UK bond yields but pressure from Fed’s higher policy rates and USD strength.
Upcoming UK data (PMI, GDP, CPI) will shape BoE policy expectations and GBP sentiment.
US jobs data on June 6 is critical for USD direction and, by extension, GBP/USD.
#gbpusd #dollar

Dollar Bearish Dollar is always the bible in my analysis. Beautiful run down towards the target as outline 2 weeks ago. Still got some legs to hit our targets eventually.
#swingtrading #usd

