GBPUSD TRADE SETUPWait for retest the entry level then take a trade for Sell otherwise skip this setup
USDGBP trade ideas

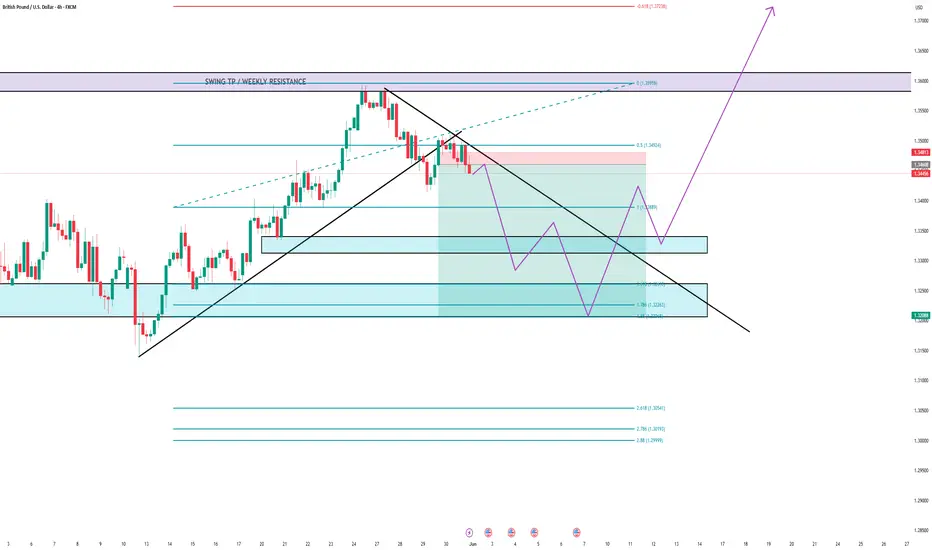
GBP/USD – Sell Bias into NFP | Smart Money Play
Caption:
Price is rejecting a 1H inverse imbalance + FVG zone in premium, showing early signs of bearish flow. With NFP on deck, I'm expecting a draw on liquidity down into the Monthly FVG → 1H FVG/BB → 4H inverse IMB. Let price confirm via lower-timeframe CHoCH before executing. Volatility is likely to kick in mid-to-late week. A clean premium-to-discount is in play.

london break out strategy (my strategy) back test :2025 mayto learn is to share...
hello traders!
this is back test of london breakout strategy for gbp usd pair for month of the may.
i hope u read this see the idea that i had give me your comments and ideas ,maybe help me fix my mistakes, maybe it gives you some lead and etc. no more talking straight to the strategy ...
strategy summary the Strat focuses on breaking the range market of the asian session,
first u got to mark the high and low of the price between 4 am to 6 am utc then you have range that in the chart i showed like box , next we wait till 7 am utc , if price was out of the box zone we open a trade toward the trend( if it broke above you open a long and vise versa) or if it wasn't u simply wait for price to close above or below, then you open a trade with sl put on the opposite side of the box and profit set to 1.5 times of the sl. only one trade per day is acceptable .
there are some exception that you don't have to trade:
1.when there is bank holiday
2.when your sl would exceed 50 pip (that's high of a risk)
3. further effect of the news shall be studied that i didn't consider in this back test
I've put the results in an ai and asked it to analyze the results:
Summary Statistics
Total Trades: 19
Total Profit: +152.3 pips
Average Profit per Trade: +8.02 pips
Max Profit in a Trade: +49.0 pips
Max Loss in a Trade: -30.2 pips
Winning Trades: 10
Losing Trades: 9
Win Rate: 52.6%
Profit Factor: 1.74 (total gain / total loss)

GBPUSD COT and Liquidity AnalysisHey what up traders welcome to the COT data and Liquidity report. It's always good to go with those who move the market here is what I see in their cards. I share my COT - order flow views every weekend.
🎯 Goal of this ideas is track order flow.
📍Please be aware that institutions report data to the SEC on Tuesdays and data are reported on Fridays - so again we as retail traders have disadvantage, but there is possibility to read between the lines. Remember in the report is what they want you to see, that's why mostly price reverse on Wednesday after the report so their cards are hidden as long as possible. However if the trend is running you can read it and use for your advantage.
💊 Tip
if the level has confluence with the high volume on COT it can be strong support / Resistance.
👍 Hit like if you find this analysis helpful, and don't hesitate to comment with your opinions, charts or any questions.
Analysis done on the Tradenation Charts
Disclosure: I am part of Trade Nation's Influencer program and receive a monthly fee for using their TradingView charts in my analysis.
"Adapt what is useful, reject what is useless, and add what is specifically your own."
— David Perk aka Dave FX Hunter ⚔️

GBPUSDtrend buy side on gbpusd this side is comes at reaccumulation so i think we are in phase b from next week so i take buy trade

LONG TERM GBPUSD DIRECTION ANALYSIS (JUNE 2025)Hi Traders,
Here my analysis for Long Term FX:GBPUSD Analysis. Based on the analysis, As we saw last week, the price already arrive at the Weekly Resistance which show the big movement. Currently, I will take oppurtunity for sell position untuk the valid support arrive at the zone im marking.
We will carry up more about the fundamental on Great Britain and US especially. The price will more aggressive by time.
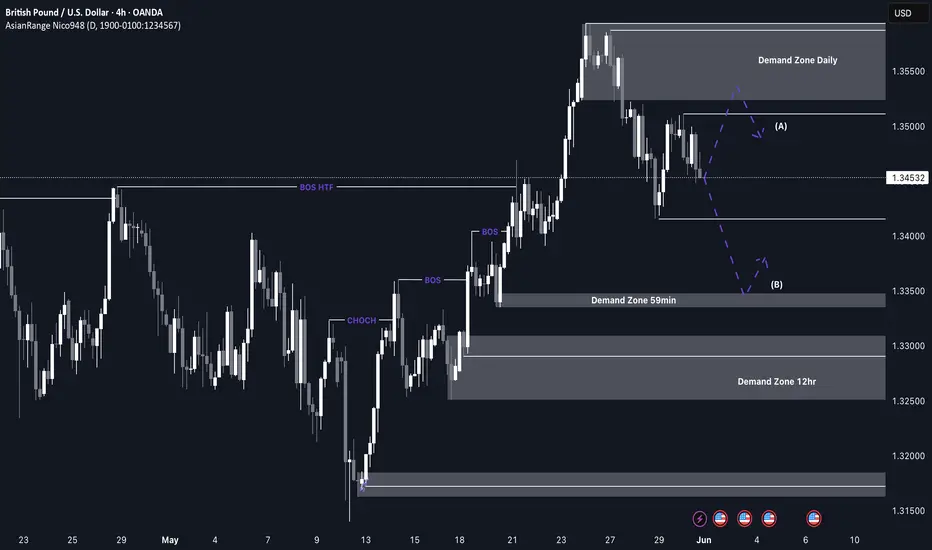
GBP/USD Shorts from the daily supplyI’m anticipating a potential retracement as price has been heavily bullish and is now beginning to show signs of being overbought. After recently breaking major structure to the upside, there’s room for a temporary sell-off as price corrects before continuing higher.
I’ll be watching for possible reactions from the 59-minute demand zone for a minor bounce, but the more ideal long opportunity would be at the 12H demand zone around 1.3300, where structure is cleaner and confluences align.
Confluences for Short-Term Sells:
- A recent change of character (CHOCH) to the downside signals a shift in momentum
- A clean daily supply zone has been left behind that could initiate a deeper pullback
- Significant liquidity below, including the Asia low, ready to be swept
- For price to maintain long-term bullish movement, it must first correct, fill imbalances, and mitigate valid demand levels
P.S. If price drops further and breaks structure, we’ll likely see a new supply zone form. This will provide a closer and more refined opportunity to participate in the move.
Stay sharp and trade safe! 📉📈

Gbpusd June We are at the support level so before we can consider buy signal the four hours structure must be clear and if the support fail they we go down.

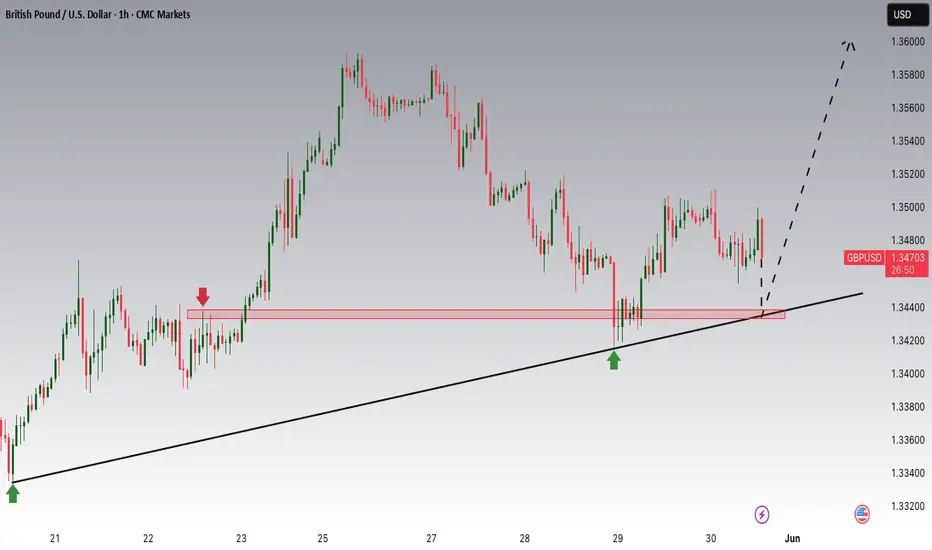
GBPUSD is Nearing an Important Support!!Hey Traders, in today's trading session we are monitoring GBPUSD for a buying opportunity around 1.34400 zone, GBPUSD is trading in an uptrend and currently is in a correction phase in which it is approaching the trend at 1.34400 support and resistance area.
Trade safe, Joe.
GBPUSD Bearish Setup | Trend Reversal Setup in Progress...📉 Technical Outlook _
After a strong bullish rally within a parallel ascending channel, GBP/USD is now showing signs of potential reversal. Price action recently broke out of the channel and is failing to reclaim upward momentum, indicating that buyers may be losing control.
🔍 Key Observations:
🟪 Previous Consolidation led to the breakout
📈 Strong bullish structure inside the parallel channel
❌ Price has now exited the channel, with clear signs of rejection near 1.347x
📉 Bearish pattern projecting a potential drop to the support zone at 1.31521
⚠ Watch for This Bearish Scenario:
1. Liquidity grab or false breakout above short-term highs
2. Strong sell-off as momentum fades
3. Clean bearish continuation pattern toward 1.3150 support
✅ Bearish Confluences:
Breakdown from parallel channel
Series of lower highs forming
Weak recovery attempts
Clear downside target with prior support zone structure
🔷 Note: Keep an eye on macro news and USD strength before executing. This is a technical setup with potential, not a guarantee.
📊 What’s your bias? Bullish or Bearish? 👍 Like & 🔔 Follow for more technical setups!

GBP/USD – 1H Chart | Fibonacci-Based Bullish SetupWe’ve identified a bullish opportunity on GBP/USD using the Fibonacci technique. After confirming support near the retracement zone, price action is showing bullish continuation signs. Based on this, we are executing an instant buy trade with the following stats:
🔹 Pair: GBP/USD
🔹 Timeframe: 1H
🔹 Trend: Bullish (Fibonacci Technique)
🔹 Entry: Instant Buy @ 1.34699
🔹 Stop Loss: 1.34097
🔹 Take Profit 1: 1.35301
🔹 Take Profit 2: 1.35903
🔹 Lot Size: 0.17
🔹 Risk/Reward: 1:1 & 1:2
🔹 Risk: $200
🔹 Reward: $300
📊 Using Fibonacci retracement and price action confirmation for setup validation.
#GBPUSD #ForexTrading #FibonacciTrading #BullishSetup #RiskReward #TradingPlan #PriceAction #TechnicalAnalysis #ForexTrader #TradeSmart #ForexSignals #1HChart #BuySetup #ForexStrategy

Market next move 🚫 Disruption Points
1. No Clear Breakout Confirmation
Issue: The chart does not show a clear breakout of any recent highs or resistance levels.
Disruption: Without a break of a key level (like 1.3480–1.3500), the bullish target is premature.
2. Bearish Price Structure
Observation: The price has been making lower highs and lower lows over the last few candles.
Disruption: This may indicate a downtrend, not a setup for a bullish target.
3. Low Momentum
Issue: Volume appears to be declining, and recent bullish candles are smaller and weaker.
Disruption: The move toward the target may lack strength and could reverse without momentum.

GU| Building the Bullish Case4H showing strong bullish momentum, so I’ve dropped down to the 30M to catch continuation setups.
Right now, I’m watching for SSL to get taken before I look for LTF confirmations and entries.
Letting price do its thing first—patience is part of the play. 🧠
Waiting mode: activated. 🎯
– Inducement King
Bless Trading!

Market next move 🔍 Disruption/Critique of the Current Target Analysis:
1. Lack of Technical Justification:
The chart marks a “Target” level without referencing a clear technical basis (e.g., resistance, Fibonacci level, or moving average).
Without a corresponding pattern or indicator signal (e.g., breakout, double bottom, divergence), the target seems arbitrary.
2. Volume Spike Misinterpretation:
While there’s a volume spike in the last candle, it's accompanied by a bearish candle, suggesting potential selling pressure, not buying strength.
A bullish continuation would ideally require a green candle with increasing volume, which is absent here.
3. Market Context Ignored:
No consideration of broader market context such as macroeconomic news, DXY strength, or interest rate expectations which heavily impact GBP/USD.
The U.S. flag icon indicates upcoming news – trading before such events can be risky and invalidate the technical target.
4. Resistance Zone Overlooked:
The “Target” lies near the 1.3500 psychological level, which often acts as resistance. This isn’t discussed or marked.
Recent price action near that level shows rejection, making it a questionable target without strong buying confirmation

SELLS ON GBPUSD There is a continuation trend that is still seeking for liquidity before the buys. Market is still delivering bearish.
