GBPUSD : New-Week Technical Bias (Market Open)
Multi-Timeframe Structural Outlook:
Higher Timeframes (M,W,D): In Ascend Sequence sweeping major liquidity levels
4H Structural & Liquidity Picture:
Trend Signature Shift (TSS):
A clean TSS followed the Sweep Event, shifting internal structure bearish and signaling short-term vulnerability.
Trap Vectors & Liquidity Mechanics:
Price engineered multiple Trap Vectors (TV), both pre- and post-rejection. Further anticipated TV zones exist just above and below current price level at 1.37138 and 1.35630 respectively aligning with Fibonacci retracement confluence.
Key Support Zone:
Price Base between 1.35796 – 1.36200 remains pivotal. Sustained hold here suggests possible short-term recovery; decisive break below exposes deeper liquidity pools toward the lower fib levels and potentially the Range Low (RL) at 1.33704.
Decision Zones:
Upside Consideration:
Recovery above 1.36200 with structural confirmation may reclaim bullish intent, though a retest/ break of the RH at 1.37888 remains the higher timeframe liquidity magnet.
Downside Consideration:
Breakdown below the Price Base accelerates sell-side targets toward the anticipated TV zones and deeper fib levels, with full invalidation exposing the RL.
Summary:
Bearish short-term lean favored following the TSS, but Price Base support remains a critical decision point. Break below confirms deeper sell-side exploration; sustained defense reopens bullish continuation/corrective potential.
USDGBP trade ideas

GBPUSD - OUTLOOK This is my technical perspective on GBPUSD.
Fundamentally expecting the Dollar to strengthen in the coming weeks
"May fortune attend thee, and thy trade prosper." .......L2Earned
GBPUSD"My current expectation is that the price will continue to move within the descending channel on the 1-hour timeframe. I'm waiting for the price to retest the upper boundary of the channel. If a valid bearish confirmation signal (such as a reversal candlestick pattern) forms at that level, I plan to enter a short position."

Gbpusd short scalp I will consider a short only if pull back happens prior to target 1 being a traded to.
I like the downward monetum this morning.
4 losses 1 win for the simulated scalps. If this one is triggered it is the 6th scalp out of 100

DeGRAM | GBPUSD got out from the triangle📊 Technical Analysis
● Price pierced the blue-labelled trend-line and is threatening to exit a month-long contracting triangle; successive higher lows since 3 Jul show demand absorbing every dip.
● A confirmed H1 close above 1.3650 completes the pattern, unlocking the 1.3700-1.3720 supply zone (June range cap) with measured-move scope toward the broader channel midpoint at 1.3770.
💡 Fundamental Analysis
● Post-election political clarity and an uptick in UK 2-yr gilt yields narrow the policy-gap, while Friday’s softer US NFP trims Fed-rate expectations—both favouring sterling over the dollar.
✨ Summary
Buy 1.3620-1.3650; break >1.3650 targets 1.3700 → 1.3770. Long bias void on an H1 close below 1.3590.
-------------------
Share your opinion in the comments and support the idea with a like. Thanks for your support!

Cable H4 | Falling toward an overlap supportCable (GBP/USD) is falling towards an overlap support and could potentially bounce off this level to climb higher.
Buy entry is at 1.3616 which is an overlap support.
Stop loss is at 1.3523 which is a level that lies underneath a pullback support and the 61.8% Fibonacci retracement.
Take profit is at 1.3770 which is a multi-swing-high resistance.
High Risk Investment Warning
Trading Forex/CFDs on margin carries a high level of risk and may not be suitable for all investors. Leverage can work against you.
Stratos Markets Limited (tradu.com ):
CFDs are complex instruments and come with a high risk of losing money rapidly due to leverage. 63% of retail investor accounts lose money when trading CFDs with this provider. You should consider whether you understand how CFDs work and whether you can afford to take the high risk of losing your money.
Stratos Europe Ltd (tradu.com ):
CFDs are complex instruments and come with a high risk of losing money rapidly due to leverage. 63% of retail investor accounts lose money when trading CFDs with this provider. You should consider whether you understand how CFDs work and whether you can afford to take the high risk of losing your money.
Stratos Global LLC (tradu.com ):
Losses can exceed deposits.
Please be advised that the information presented on TradingView is provided to Tradu (‘Company’, ‘we’) by a third-party provider (‘TFA Global Pte Ltd’). Please be reminded that you are solely responsible for the trading decisions on your account. There is a very high degree of risk involved in trading. Any information and/or content is intended entirely for research, educational and informational purposes only and does not constitute investment or consultation advice or investment strategy. The information is not tailored to the investment needs of any specific person and therefore does not involve a consideration of any of the investment objectives, financial situation or needs of any viewer that may receive it. Kindly also note that past performance is not a reliable indicator of future results. Actual results may differ materially from those anticipated in forward-looking or past performance statements. We assume no liability as to the accuracy or completeness of any of the information and/or content provided herein and the Company cannot be held responsible for any omission, mistake nor for any loss or damage including without limitation to any loss of profit which may arise from reliance on any information supplied by TFA Global Pte Ltd.
The speaker(s) is neither an employee, agent nor representative of Tradu and is therefore acting independently. The opinions given are their own, constitute general market commentary, and do not constitute the opinion or advice of Tradu or any form of personal or investment advice. Tradu neither endorses nor guarantees offerings of third-party speakers, nor is Tradu responsible for the content, veracity or opinions of third-party speakers, presenters or participants.

GBPUSD TECHNICAL & ORDER FLOW ANALYSISOur analysis is based on a multi-timeframe top-down approach and fundamental analysis.
Based on our assessment, the price is expected to return to the monthly level.
DISCLAIMER: This analysis may change at any time without notice and is solely intended to assist traders in making independent investment decisions. Please note that this is a prediction, and I have no obligation to act on it, nor should you.
Please support our analysis with a boost or comment!

Triangle Formation (Rising wedge STF) I believe we can see some downside here. Price has bounced of the 61.8 fib level and looks to have created a triangle pattern. I’m not currently in any positions, I will wait for a breakout of the rising wedge for a short position.

GBPUSD LONG TRADE PLANThe pair is trading in a bullish channel. Following this pattern, I'll be looking for buy opportunities after retest.
Please do your own analysis before placing any trades.
Cheers and Happy Trading.

Possibility of uptrend Wave B is expected to complete within the support area and the specified timeframe, and then we will see the start of the uptrend. A break above the 78.6% level will invalidate the above scenario.

Fundamental Market Analysis for July 7, 2025 GBPUSDEvents to pay atttenyion to today:
09:00 EET. GBP - Change in retail sales
GBPUSD:
The GBP/USD pair is starting the new week on a subdued note, fluctuating within a narrow range around the 1.3600 mark during the Asian session amid mixed fundamental signals.
The British pound (GBP) received some support last week after Prime Minister Keir Starmer said that Chancellor Rachel Reeves would remain in her post for the foreseeable future. However, the growing likelihood of a rate cut by the Bank of England (BoE) as early as August is having a negative impact on the GBP/USD pair. In fact, BoE Governor Andrew Bailey said that interest rates are moving downwards, while Monetary Policy Committee (MPC) member Alan Taylor called for faster rate cuts amid the risk of a hard landing for the British economy.
However, the decline in the GBP/USD pair is still being held back by the underlying bearish sentiment towards the US dollar (USD). Investors remain concerned that US President Donald Trump's sweeping bill to cut taxes and increase spending will lead to an explosion in the federal deficit and exacerbate the US's long-term debt problems. This, along with growing expectations that the Federal Reserve (Fed) will resume its cycle of rate cuts in the near future, is keeping the US dollar close to its February 2021 low.
Investors will therefore be closely studying the FOMC meeting minutes, which will be published on Wednesday, for clues about the Fed's rate cut path, which will stimulate demand for the US dollar and give a significant boost to the GBP/USD pair.
Trading recommendation: SELL 1.3620, SL 1.3640, TP 1.3520

GBP/USD weekly outlookMy weekly outlook & key levels for GBP/USD. I will look for a confirmation of my strategy once reach one of this levels.

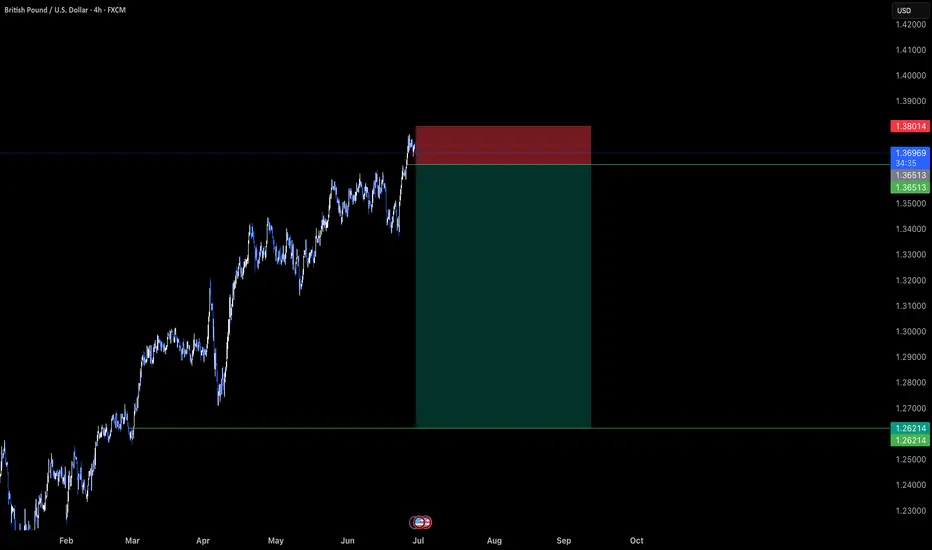
GBP/USD💰Symbol: { GBP/USD }
🟩Price: { 1.36990 }
🟥Stop: { 1.37826 }
1️⃣profit: { 1.36536 }
2️⃣profit: { 1.35912 }
3️⃣profit: { 1.35116 }
4️⃣profit: { 1.34483 }
5️⃣profit: { 1.33859 }
📊Check your chart before entering.
🚨Check before use to make sure there is no important news.🚨

Intraday Drop into Support Zone — Can GBP/USD Bounce?Hi everyone,
GBP/USD continues to consolidate below the 1.36850 level. Price failed to break above and moved lower into the 1.35300–1.34600 zone, providing us with a clean intraday trade setup.
A drop into this area was highlighted as the more probable short‑term path, and we’re now looking for GBP/USD to find support in this region; and more importantly, to hold above the 1.33800 level to form the base for another push higher.
As previously noted, a decisive break above 1.37500 would renew our expectation for further upside, with the next key target around 1.38400. We'll be monitoring price action closely to see how it unfolds.
We’ll continue to provide updates on the projected path for GBP/USD as price approaches this target.
The longer-term outlook remains bullish, and we expect the rally to continue extending further from the 1.20991 January low towards 1.40000 and 1.417000.
We’ll be keeping you updated throughout the week with how we’re managing our active ideas. Thanks again for all the likes/boosts, comments and follows — we appreciate the support!
All the best for the week ahead. Trade safe.
BluetonaFX

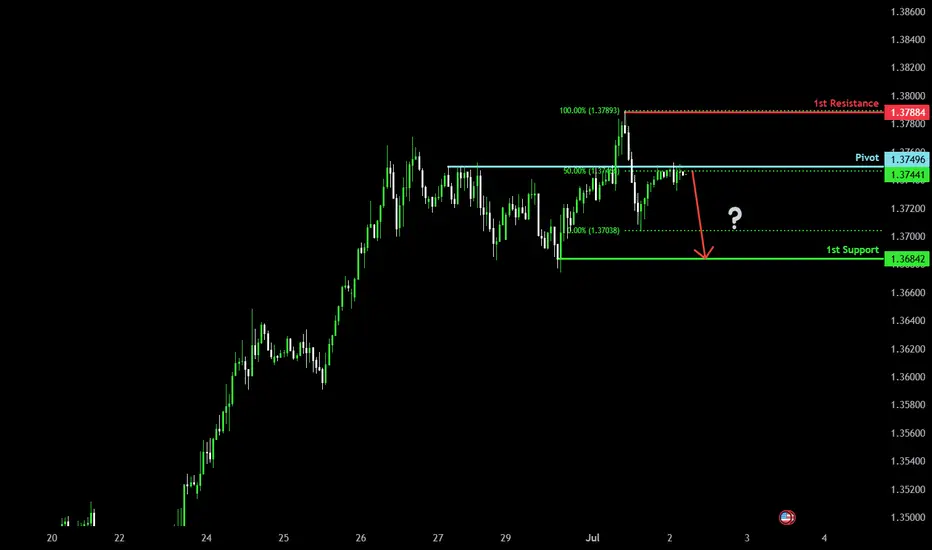
Bearish drop?The Cable (GBP/USD) is reacting off the pivot and could drop to the 1st support.
Pivot: 1.3749
1st Support: 1.3684
1st Resistance: 1.3788
Risk Warning:
Trading Forex and CFDs carries a high level of risk to your capital and you should only trade with money you can afford to lose. Trading Forex and CFDs may not be suitable for all investors, so please ensure that you fully understand the risks involved and seek independent advice if necessary.
Disclaimer:
The above opinions given constitute general market commentary, and do not constitute the opinion or advice of IC Markets or any form of personal or investment advice.
Any opinions, news, research, analyses, prices, other information, or links to third-party sites contained on this website are provided on an "as-is" basis, are intended only to be informative, is not an advice nor a recommendation, nor research, or a record of our trading prices, or an offer of, or solicitation for a transaction in any financial instrument and thus should not be treated as such. The information provided does not involve any specific investment objectives, financial situation and needs of any specific person who may receive it. Please be aware, that past performance is not a reliable indicator of future performance and/or results. Past Performance or Forward-looking scenarios based upon the reasonable beliefs of the third-party provider are not a guarantee of future performance. Actual results may differ materially from those anticipated in forward-looking or past performance statements. IC Markets makes no representation or warranty and assumes no liability as to the accuracy or completeness of the information provided, nor any loss arising from any investment based on a recommendation, forecast or any information supplied by any third-party.
GBPUSD TRADE SETUPWait for Retest the entry level and Bullish momentum candle then take a trade for Buy otherwise skip this setup

Trading Recommendation and Analysis for GBP/USDThe British pound is rising, but the accompanying Marlin oscillator is quite weak. Before the bulls are not just the desired targets - 1.3834, 1.3935, etc. - but also potential traps from which the bears could launch an unstoppable offensive.
On the daily chart, the trend remains upward, which is also confirmed by the Marlin oscillator breaking upward out of its own descending channel. However, there is also suspicion that this might be a trap - it may be a false breakout from the channel, similar to what occurred on May 12, when it was a breakout to the downside (highlighted by a yellow rectangle) .A trend reversal would occur if the price breaks below the support level at 1.3635, which is additionally reinforced by the MACD line.
On the four-hour chart, the price appears to be finishing a consolidation phase. During this consolidation, the Marlin oscillator has had time to decompress and prepare for further growth. As long as the trend remains intact the no signs of reversal appear, we expect the price to continue moving gradually upward.

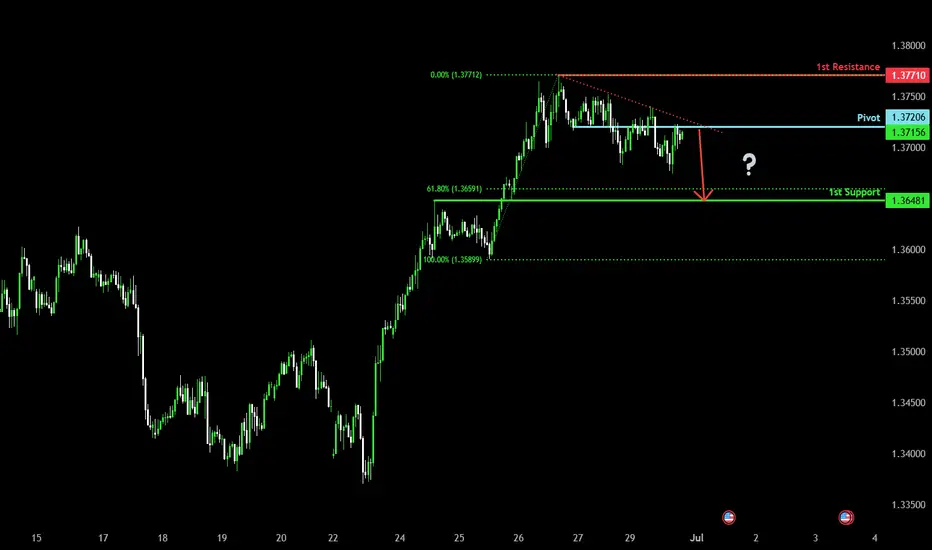
Bearish drop?The Cable (GBP/USD) is reacting off the pivot and could drop to the 1st support.
Pivot: 1.3720
1st Support: 1.3648
1st Resistance: 1.3771
Risk Warning:
Trading Forex and CFDs carries a high level of risk to your capital and you should only trade with money you can afford to lose. Trading Forex and CFDs may not be suitable for all investors, so please ensure that you fully understand the risks involved and seek independent advice if necessary.
Disclaimer:
The above opinions given constitute general market commentary, and do not constitute the opinion or advice of IC Markets or any form of personal or investment advice.
Any opinions, news, research, analyses, prices, other information, or links to third-party sites contained on this website are provided on an "as-is" basis, are intended only to be informative, is not an advice nor a recommendation, nor research, or a record of our trading prices, or an offer of, or solicitation for a transaction in any financial instrument and thus should not be treated as such. The information provided does not involve any specific investment objectives, financial situation and needs of any specific person who may receive it. Please be aware, that past performance is not a reliable indicator of future performance and/or results. Past Performance or Forward-looking scenarios based upon the reasonable beliefs of the third-party provider are not a guarantee of future performance. Actual results may differ materially from those anticipated in forward-looking or past performance statements. IC Markets makes no representation or warranty and assumes no liability as to the accuracy or completeness of the information provided, nor any loss arising from any investment based on a recommendation, forecast or any information supplied by any third-party.
Bullish continuation?The Cable (GBP/USD) is falling towards the pivot, which acts as a pullback support and could bounce to the 1st resistance.
Pivot: 1.3617
1st Support: 1.3442
1st Resistance: 1.3795
Risk Warning:
Trading Forex and CFDs carries a high level of risk to your capital and you should only trade with money you can afford to lose. Trading Forex and CFDs may not be suitable for all investors, so please ensure that you fully understand the risks involved and seek independent advice if necessary.
Disclaimer:
The above opinions given constitute general market commentary, and do not constitute the opinion or advice of IC Markets or any form of personal or investment advice.
Any opinions, news, research, analyses, prices, other information, or links to third-party sites contained on this website are provided on an "as-is" basis, are intended only to be informative, is not an advice nor a recommendation, nor research, or a record of our trading prices, or an offer of, or solicitation for a transaction in any financial instrument and thus should not be treated as such. The information provided does not involve any specific investment objectives, financial situation and needs of any specific person who may receive it. Please be aware, that past performance is not a reliable indicator of future performance and/or results. Past Performance or Forward-looking scenarios based upon the reasonable beliefs of the third-party provider are not a guarantee of future performance. Actual results may differ materially from those anticipated in forward-looking or past performance statements. IC Markets makes no representation or warranty and assumes no liability as to the accuracy or completeness of the information provided, nor any loss arising from any investment based on a recommendation, forecast or any information supplied by any third-party.

GU-Tue-08/07/25 TDA-GU stagnant ahead of tomorrow's FOMC minutesAnalysis done directly on the chart
Follow for more, possible live trades update!
I often share my live trades in Tradingview public chat in London session, stay tuned!
Green flags, Red flags when you follow someone in trading:
Red flags:
-Always and only share winning trades
-No track records
-A lot of marketing campaign, offering paid courses and more but
with no proof of real trading skills
(I'm not against paid course etc... Just to keep in mind)
-Just sharing buy or sell but without explaining the confluences,
the setups, the reasons, the lot size, how risk manage the trade...
-Simply don't even know where to put sl and tp in advance
Green flags:
-Do live streaming in real time
-Keeping transparent about trade setups, ideas,
about wins and losses
-Share live track record of an account
These are just some signs (could be more green and red flag signs),
and should not be used as effective methods.
If you have more of green flags or red flags ideas, comment down below!
Premise:
A simple idea plan (like Tradingview public posts) won't describe everything.
No one can predict how market will move, it's always good to react to how it moves.
It gives an idea of how price might move, but no one come from FUTURE.
So I always encourage people to openly and actively discuss in real time.
For example discussing on Tradingview public chat (and more).
I don't give signals blindly, people should learn
and understand the skill.
Following blindly signals you won't know how to
manage the trade, where precisely put sl and tp,
lot size and replicate the move over time.
That's why you need active real time discussions.
Trading is not get rich quick scheme!
Active in London session!
Not financial advice, DYOR.
Market Flow Strategy
Mister Y

GBP/USD - Channel BreakoutThe GBP/USD pair on the M30 timeframe presents a Potential Buying Opportunity due to a recent Formation of a Breakout Pattern. This suggests a shift in momentum towards the upside and a higher likelihood of further advances in the coming hours.
Possible Long Trade:
Entry: Consider Entering A Long Position around Trendline Of The Pattern.
Entry: 1.36498
Stop Loss: 1.36245
Take Profit: 1.37596

Bullish bounce?The Cable (GBP/USD) has bounced off the pivot and oculd rise to the 1st resistance which is a an overlap resistance.
Pivot: 1.3531
1st Support: 1.3423
1st Resistance: 1.3675
Risk Warning:
Trading Forex and CFDs carries a high level of risk to your capital and you should only trade with money you can afford to lose. Trading Forex and CFDs may not be suitable for all investors, so please ensure that you fully understand the risks involved and seek independent advice if necessary.
Disclaimer:
The above opinions given constitute general market commentary, and do not constitute the opinion or advice of IC Markets or any form of personal or investment advice.
Any opinions, news, research, analyses, prices, other information, or links to third-party sites contained on this website are provided on an "as-is" basis, are intended only to be informative, is not an advice nor a recommendation, nor research, or a record of our trading prices, or an offer of, or solicitation for a transaction in any financial instrument and thus should not be treated as such. The information provided does not involve any specific investment objectives, financial situation and needs of any specific person who may receive it. Please be aware, that past performance is not a reliable indicator of future performance and/or results. Past Performance or Forward-looking scenarios based upon the reasonable beliefs of the third-party provider are not a guarantee of future performance. Actual results may differ materially from those anticipated in forward-looking or past performance statements. IC Markets makes no representation or warranty and assumes no liability as to the accuracy or completeness of the information provided, nor any loss arising from any investment based on a recommendation, forecast or any information supplied by any third-party.

SHORT and SHORT in GBPUSDHello Fellow traders,
I am sharing my short position in GBP/USD today.
I have decided to go short on GBP/USD, following the announcement of steep U.S. tariffs. Fundamentally, this aligns with my outlook: the USD is acting as a safe haven, while the GBP remains more risk-sensitive amidst global uncertainty.
From a technical standpoint—though I keep things simple—my analysis supports the bearish sentiment, and I have entered a short position accordingly.
Good luck, everyone, and trade safe!
