GBPUSD Chart Analysis & Scenarios✅ Bullish Breakout (if breaks 1.3666):
Target: 1.3680–1.3700
Confirmation: Price closes above resistance with strong volume
❌ Bearish Rejection (if rejected at 1.3637–1.3666):
Target: 1.3610, possibly 1.3588
Watch for: Bearish candlestick pattern at resistance + drop in volume
✅ Summary:
GBP/USD is recovering strongly but faces heavy resistance at 1.3637–1.3666.
Breakout above could open room toward 1.3700.
Rejection likely if momentum weakens near resistance, targeting previous lows.
USDGBP trade ideas

GBPUSD swing shortKeeping yesterday long open after taking profit setting limits for short swing on GPBUSD with fraction of profits of yesterday, price did close above weekly high so caution advised

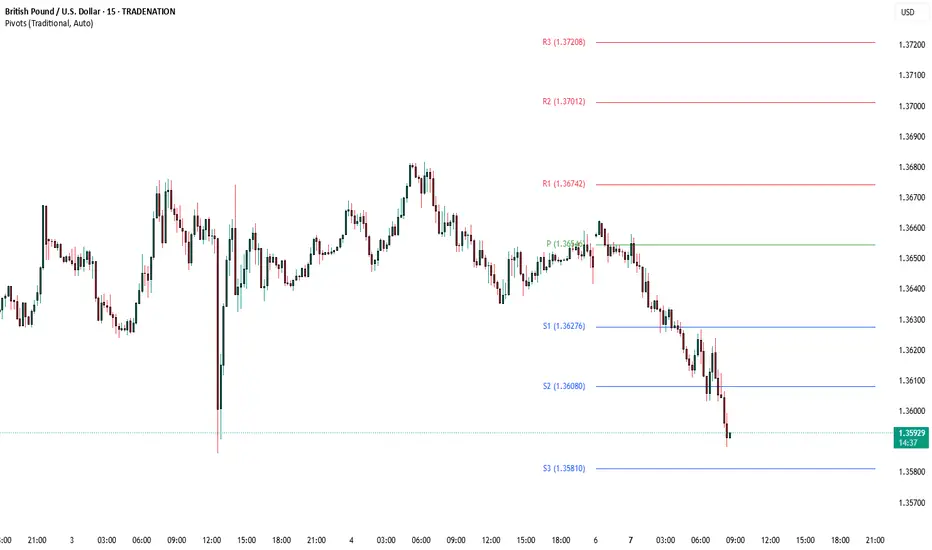
GBPUSD Is Going Up! Buy!
Take a look at our analysis for GBPUSD.
Time Frame: 9h
Current Trend: Bullish
Sentiment: Oversold (based on 7-period RSI)
Forecast: Bullish
The market is testing a major horizontal structure 1.360.
Taking into consideration the structure & trend analysis, I believe that the market will reach 1.370 level soon.
P.S
We determine oversold/overbought condition with RSI indicator.
When it drops below 30 - the market is considered to be oversold.
When it bounces above 70 - the market is considered to be overbought.
Disclosure: I am part of Trade Nation's Influencer program and receive a monthly fee for using their TradingView charts in my analysis.
Like and subscribe and comment my ideas if you enjoy them!

GBPUSD swing sell GBPUSD brexit was never a good idea, it looks bullish, many will have that bias and if you look carefully tapped into 4h supply multiple times, and its due for a correction

GBP/USD Pair Analysis📈 GBP/USD Pair Analysis – Monday, July 7, 2025
1️⃣ The pair is moving within an ascending price channel, indicating a continued positive trend in the medium term.
2️⃣ Strong demand areas have been identified on the larger time frames, which are expected to support the price in the event of a decline to these areas.
3️⃣ The MACD indicator is oversold, increasing the possibility of a rebound and upward movement from the current or nearby areas.
📌 Summary and Recommendations:
🔹 General Trend: Upward
🔸 The price is currently making a temporary downward correction.
✅ We expect the pair to rise again towards the upper limit of the price channel, provided it holds above the specified demand areas.
GBP/USD – Uptrend Channel Analysis!GBP/USD is trading inside a strong uptrend channel on the 4-hour chart.
Recent price action confirmed a Break of Structure (BOS), signaling solid bullish control.
Buyers have pushed price firmly above previous resistance zones.
Price is now near the upper boundary of the channel.
Signs of short-term exhaustion suggest a likely retracement ahead.
A pullback into the retracement level or channel midline would offer better risk-reward.
Key Levels to Watch:
Channel support for potential bounce.
Retracement zone as a buy opportunity.
Trade Plan:
Wait for a clean retracement toward support.
Look for bullish confirmation before entering long.
Avoid chasing highs – focus on discounted entries.
Bias: Bullish while price holds the uptrend channel structure.
Expect continuation after healthy correction.
Patience is critical – let the market set up a quality entry.
Traders should align with the dominant trend and manage risk carefully.
Like, comment, share, and follow for more trading ideas.

GBPUSD InsightHello to all subscribers,
Please feel free to share your personal opinions in the comments. Don’t forget to hit the booster and subscribe!
Key Points
- According to the ADP National Employment Report, U.S. private employment in June decreased by 33,000 compared to the previous month — the first negative figure since March 2023. This has strengthened expectations for interest rate cuts.
- U.S. President Donald Trump announced that a trade agreement has been reached with Vietnam. Reportedly, Vietnam has agreed to significantly lower its tariffs to 20% in exchange for opening its market. This has raised hopes for progress in ongoing trade negotiations with other countries.
- The EU trade team is currently in Washington, D.C., negotiating with the U.S. side and is reportedly requesting preemptive tariff exemptions in certain sectors.
- In the U.K., the welfare reform plan proposed by the Labour government has been significantly scaled back. Prime Minister Keir Starmer has not confirmed his confidence in Chancellor Rachel Reeves, leading to growing speculation that she may be replaced. If Reeves — who has emphasized fiscal discipline — is replaced, there are concerns that fiscal control could loosen.
Key Economic Events This Week
+ July 3: U.S. Non-Farm Payrolls (June), U.S. Unemployment Rate (June)
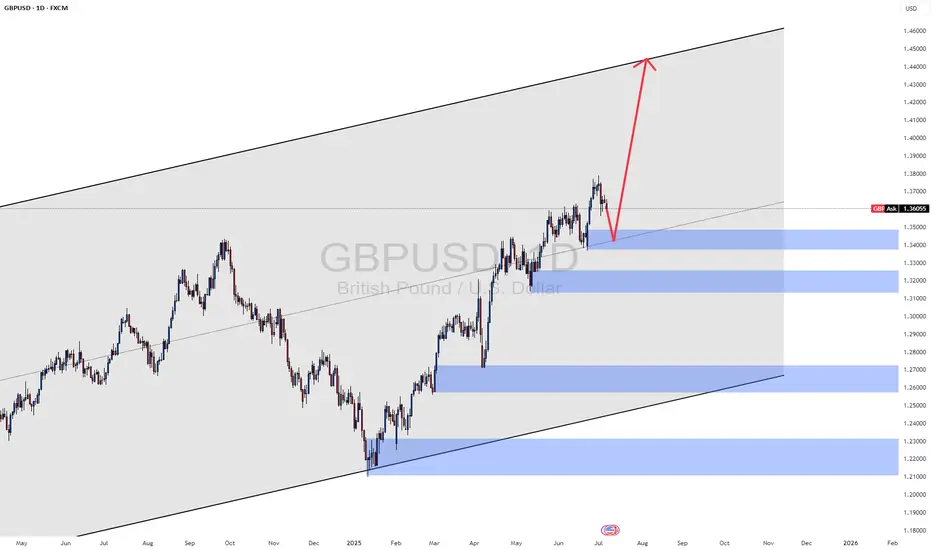
GBPUSD Chart Analysis
After maintaining an upward trend, GBPUSD experienced a sharp drop. However, the pair appears to have regained its bullish momentum with support from the trendline. The upward view will be maintained toward the resistance level of 1.40000, the trend’s previous high.
That said, caution is advised near the 1.38000 level, where the previous sharp decline occurred, as this zone could introduce volatility.

Sell to Buy ModelTho the sell hit sl but still went according to plan. Still Bullish and holding this buy for NFP happening tomorrow

check the trendIt is expected that a trend change will form within the current support range and we will witness the start of an upward trend.
If the price breaks through the support range, a continuation of the downward trend will be likely.
GBPUSD Forecast – Clean Supply Rejection, Eyes on Next Liquidit📉 GBPUSD Forecast – Clean Supply Rejection, Eyes on Next Liquidity Level (1.35130)
Price rejected perfectly from our 1.36349–1.36481 supply zone, showing clear bearish intent. Now all eyes are on the next major liquidity pool.
🟥 Supply Zone: 1.36349–1.36481
📍 Target: 1.35130 – Marked liquidity level
🔍 This is the power of zone + structure confluence — no indicators, just precision levels.
💡 Mark → Wait → Execute
That’s the FXFOREVER approach.
#FXFOREVER #GBPUSD #ForexForecast #SmartMoneyZones #SupplyAndDemand #PriceAction #ForexTrading

GBPUSD(20250708)Today's AnalysisMarket news:
Warsh, a popular candidate for the chairman of the Federal Reserve, said that interest rates should be cut to a lower level; White House trade adviser Navarro also called on the Federal Reserve Board to intervene in Powell's position.
Technical analysis:
Today's buying and selling boundaries:
1.3612
Support and resistance levels:
1.3696
1.3665
1.3644
1.3579
1.3559
1.3527
Trading strategy:
If the price breaks through 1.3612, consider buying in, with the first target price of 1.3644
If the price breaks through 1.3579, consider selling in, with the first target price of 1.3559

Gbpusd long scalpWe've taken some sellside liquidity. I am expecting price revert back into the range. Simulated trade #6 already triggered at 1.35792 any return into this level would be a good entry or near this level allowing 3 pips.

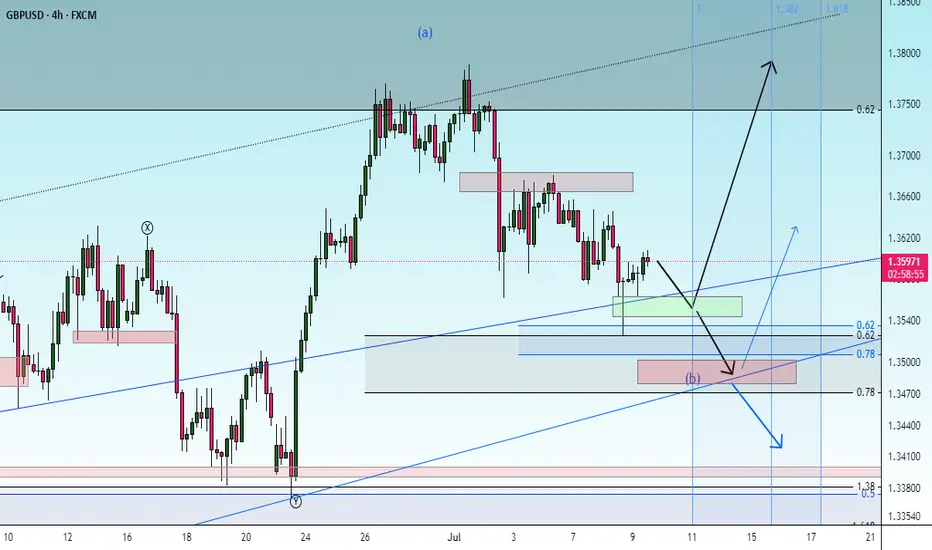
GBPUSD📌 GBPUSD – Scenario-Based Plan
The first level I’ve marked is a short-term zone.
If we get a strong buy signal there with good R/R, I’ll enter and trail aggressively.
The second level is a stronger demand zone and a better area for potential long setups.
❗️Remember: These are just scenarios — not predictions.
We stay ready for whatever the market delivers.

GBPUSD politics and the upcoming NFPFX_IDC:GBPUSD trading was influenced by politics in UK. The pair recovered half of the losses, but the downside risk still remains. NFP could be a trigger. Let's dig in.
MARKETSCOM:GBPUSD
Let us know what you think in the comments below.
Thank you.
77.3% of retail investor accounts lose money when trading CFDs with this provider. You should consider whether you understand how CFDs work and whether you can afford to take the high risk of losing your money. Past performance is not necessarily indicative of future results. The value of investments may fall as well as rise and the investor may not get back the amount initially invested. This content is not intended for nor applicable to residents of the UK. Cryptocurrency CFDs and spread bets are restricted in the UK for all retail clients.

GBPUSD: Market of Sellers
The analysis of the GBPUSD chart clearly shows us that the pair is finally about to tank due to the rising pressure from the sellers.
Disclosure: I am part of Trade Nation's Influencer program and receive a monthly fee for using their TradingView charts in my analysis.
❤️ Please, support our work with like & comment! ❤️

SELL CONTINUATION Price has broken structure twice to the downside creating a protected high at the lower high( below 1.36600). Also price has created a nice looking order block, inducement that closed above a high! Further confirmation tells us that price is also now at the premium level of the swing leg, suggesting a good short set up. Now we wait for price to tap into the order block, a good change of character on the lower time frame will give a nice sell action to the external low!
TRADE CAREFULLY AND RISK WISELY

GU breaker block analysisSo as GU broke 1.3600 with strong impulse on 25th June, price left behind an OB at that same 1.3600 level. I see price has come back to that OB with a very strong drop on 2nd July and completely gone through the OB. As that OB or 1.36000 level has acted as support, it has been tested multiple times but price has now broken through couple of times, turning the 25 June OB into a breaker block, which now acts as resistance and I expect price to drop lower towards the next 4h OB at 1.34000 level.
I'm now waiting for price to reach the 4h OB left at 1.36190 on 8th July to short down towards 1.34000 level. For entry I'm going lower to 15min chart to see the Choch for extra entry confirmation.

GBPUSD Bank of England (BoE) Bank Rate
Current Rate: 4.25% ,the 10 year bond yield GB10Y =4.632%
The BoE reduced its base rate from 4.50% to 4.25% in May 2025 and has maintained it at 4.25% since then (including the June 19, 2025 meeting).
The Monetary Policy Committee (MPC) has signaled a likely gradual easing path with expectations of a 25 basis point cut possibly at the August 7, 2025 meeting, potentially bringing the rate down to around 4.00%.
The BoE’s decision reflects easing inflation pressures as inflation stands at 3.4% but remains cautious due to ongoing economic uncertainties and inflation still above target.
Federal Reserve (Fed) Funds Rate
Current Rate: Approximately 4.50%-4.25% (mid-2025 consensus)
The united state 10 year government bond yield US10Y=4.407%
The Fed has held rates steady at around 4.50% -4.25%, with markets expecting a cautious approach to rate cuts amid inflation concerns and economic data.
The Fed’s policy remains more restrictive compared to the BoE, though some easing is anticipated later in 2025 depending on inflation and growth.
Context
bond yield differential
GB10Y-US10Y=4.632%-4.407%= 0.225% advantage for carry traders in favour GBP.
Interest rate differential
GBP IRT-USD IRT= 4.25%-4.5%=-0.25% ,The Fed rate is about 0.25 percentage points higher than the BoE rate, giving a slight interest rate advantage to the USD over GBP at the short-term policy rate level.
Carry Trade Impact
The carry trade involves borrowing in a currency with a lower interest rate and investing in a currency with a higher rate to earn the spread.
Despite the Fed’s slightly higher policy rate, the BoE’s historically higher rates earlier in 2025 and expectations of a slower pace of Fed cuts have supported GBP carry trades.
The interest rate differential is relatively narrow, so carry trade flows are moderate but still contribute to demand for GBP assets.
The bond yield differential slightly favors GBP at 4.632% gb10y as against USD 4.407% , attracting fixed-income capital to uk treasury giving gbp short term advantage.
#GBPUSD


Gbpusd long scalp Same idea as previous post, I want to see a close above 1.35832 and a return into that level would be my entry. 3 targets as depicted.

GBPUSD LONG FORECAST Q3 D8 W28 Y25GBPUSD LONG FORECAST Q3 D8 W28 Y25
Professional Risk Managers👋
Welcome back to another FRGNT chart update📈
Diving into some Forex setups using predominantly higher time frame order blocks alongside confirmation breaks of structure.
Let’s see what price action is telling us today!
💡Here are some trade confluences📝
✅Daily order block
✅1H Order block
✅Intraday breaks of structure
✅4H Order block
🔑 Remember, to participate in trading comes always with a degree of risk, therefore as professional risk managers it remains vital that we stick to our risk management plan as well as our trading strategies.
📈The rest, we leave to the balance of probabilities.
💡Fail to plan. Plan to fail.
🏆It has always been that simple.
❤️Good luck with your trading journey, I shall see you at the very top.
🎯Trade consistent, FRGNT X

GBPUSD overbought pullback support at 1.3544The GBPUSD remains in a bullish trend, with recent price action showing signs of a corrective pullback within the broader uptrend.
Support Zone: 1.3544 – a key level from previous consolidation. Price is currently testing or approaching this level.
A bullish rebound from 1.3544 would confirm ongoing upside momentum, with potential targets at:
1.3770 – initial resistance
1.3830 – psychological and structural level
1.3890 – extended resistance on the longer-term chart
Bearish Scenario:
A confirmed break and daily close below 1.3544 would weaken the bullish outlook and suggest deeper downside risk toward:
1.3500 – minor support
1.3440 – stronger support and potential demand zone
Outlook:
Bullish bias remains intact while the FTSE holds above 1.3544. A sustained break below this level could shift momentum to the downside in the short term.
This communication is for informational purposes only and should not be viewed as any form of recommendation as to a particular course of action or as investment advice. It is not intended as an offer or solicitation for the purchase or sale of any financial instrument or as an official confirmation of any transaction. Opinions, estimates and assumptions expressed herein are made as of the date of this communication and are subject to change without notice. This communication has been prepared based upon information, including market prices, data and other information, believed to be reliable; however, Trade Nation does not warrant its completeness or accuracy. All market prices and market data contained in or attached to this communication are indicative and subject to change without notice.

The Day Ahead Data Highlights:
China Foreign Reserves (June):
China's FX reserves data will be closely watched for signs of capital outflows or PBoC intervention, especially amid ongoing yuan stability efforts and recent volatility in global markets.
Japan Labor Cash Earnings & Economic Indices (May):
Labor cash earnings are a key wage inflation indicator. Any upside surprise could fuel speculation around BoJ normalization. The leading and coincident indices will offer insight into Japan's near-term growth trajectory, particularly in the context of subdued domestic demand.
Germany Industrial Production (May):
As a bellwether for the Eurozone, this release will help assess the strength of Germany’s industrial rebound. Weakness could reinforce concerns about stagnation in Europe’s largest economy, especially given recent soft factory orders.
Eurozone Retail Sales (May):
Consumer spending remains critical for the ECB’s policy path. This data will provide clues on household demand resilience amid still-high core inflation and restrictive policy settings.
Sweden CPI (June):
A key input for Riksbank policy. Any persistent inflationary pressure may challenge the case for further rate cuts, especially as the central bank navigates a weak krona and external pressures.
Central Bank Speakers:
ECB’s Nagel and Holzmann:
Both are considered hawkish members. Their commentary will be scrutinized for signals on the timing and pace of additional rate cuts following June’s initial move. Markets will be sensitive to any shift in tone on inflation persistence or the economic outlook.
Implications:
The day is rich in second-tier but thematically important data that could shape regional monetary policy expectations.
The euro and European rates markets may see modest volatility depending on German IP and ECB commentary.
Japanese wage data could revive BoJ tightening bets if stronger than expected.
China’s reserve position may reflect broader macro-policy adjustments ahead of key summer policy meetings.
This communication is for informational purposes only and should not be viewed as any form of recommendation as to a particular course of action or as investment advice. It is not intended as an offer or solicitation for the purchase or sale of any financial instrument or as an official confirmation of any transaction. Opinions, estimates and assumptions expressed herein are made as of the date of this communication and are subject to change without notice. This communication has been prepared based upon information, including market prices, data and other information, believed to be reliable; however, Trade Nation does not warrant its completeness or accuracy. All market prices and market data contained in or attached to this communication are indicative and subject to change without notice.