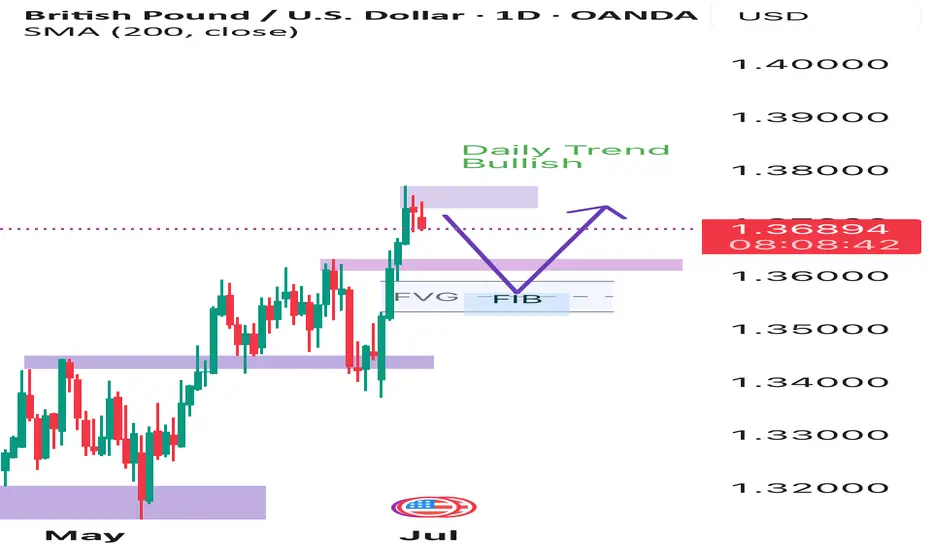
GBPUSD DAILY TIMEFRAME ANALYSIS -Bullish Continuation setupChecking my previous analysis which I published we can see that GBPUSD price action retraced to our desired entry which I indicated with a colored rectangle now we are expecting more bullish price action
USDGBP trade ideas

GBP/USDPrice action trading is a methodology in financial markets where traders make decisions based on the actual price movements of an asset over time, rather than relying heavily on technical indicators or fundamental analysis. It involves observing and interpreting patterns and trends in price charts to predict future price movements.

GBPUSD LongLooking to the upside got BoS pull back into FVG with the second retest. Looking for the bullish extension to the upside.

NFP DAY! Could we see a bullish bounce in London?Morning everyone,
Forecasting a potential bullish leg this morning towards the 1h order block area, a retracement of yesterdays bearish leg.
Kind regards,
Aman | SMC Wolf FX

GBPUSD TRADE IDEA We're looking out for a trade on GBPUSD.
We await a pullback to the downside for a continuation in the original upward movement of the market
GBPUSD BUY and SELL LIQUIDITY SETUP GBPUSD : A sweep of this liquidity below will open our Buy entry at $1.35702 with SL at $1.35496 and TP at $1.36576.
Watching for a Sell after Buy trade hits TP.
#GBPUSD

GBPUSD Buy Outlook!Soon,the market will be opened,let's see what the GBPUSD will present to us.
Buy View 📊📊

GBPUSD-SELL strategy 6 hourly chart Reg.ChannelThe pair is overbought considering the longer time frames. we are still positive on indicators short-term, so we seek a SELL level rather than rushing in.
Strategy SELL @ 1.3760-1.3790 and take profit near 1.3617.

GBPUSD GBPUSD will either fall or breakout from the supply roof an ascending trendline ...structure never lies only traders lie.
#gbpusd

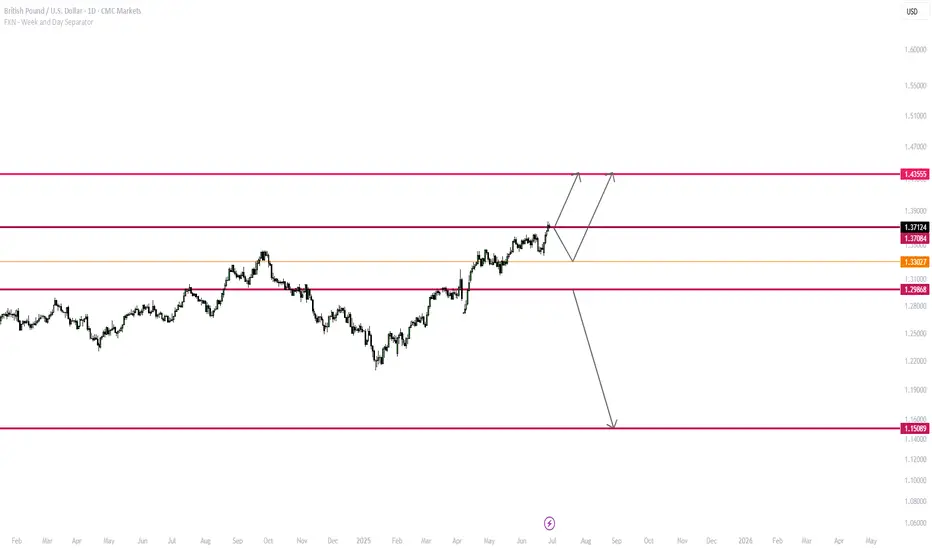
GBPUSD: Targeting 1.4200 Swing Move Target! Swing Trading GBPUSD: We’ve identified a key reversal zone where our long-term take-profit target is set at 1.4200. This is a long-term approach, but in the short term, we could target 1.3900, which is a reasonable take-profit area. Before taking any buying entry, please do your own analysis.
Good luck and trade safely!
Like
Comment
Share
Team Setupsfx_

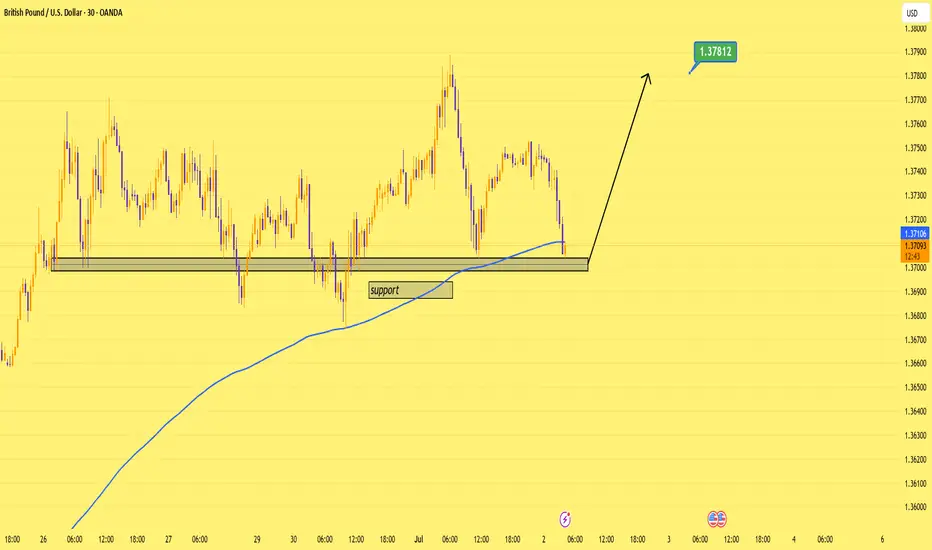
GBPUSD Bounced the Block — 1.3780 in Sight.Price is reacting off a strong support zone and the 200 EMA.
This move is also based on my expectation that upcoming U.S. data will come in weaker than forecasted, which should push USD lower and support GBP strength.
Target: 1.3780 📈
Let’s see how it plays out.
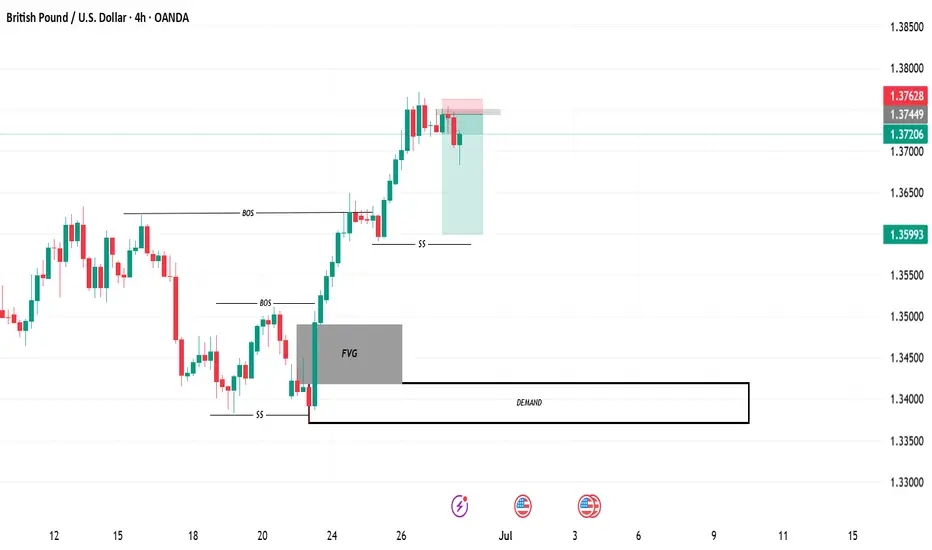
A valid Demand zone has been spotted on H4 timeframe📊 GBP/USD 4H Analysis – Smart Money Structure in Play
On the 4-hour chart, GBP/USD has been exhibiting a clear bullish structure following a series of Breaks of Structure (BOS) and higher lows. Here’s a breakdown of my analysis and current trade idea:
1. Market Structure
We saw a clear BOS around June 20, indicating a shift in direction as price broke above previous swing highs.
A second BOS occurred shortly after, confirming bullish intent with strong momentum candles.
This was followed by a minor retracement and another bullish rally — forming a higher low supported by a Short-Term Support (SS).
2. Fair Value Gap (FVG)
During the bullish impulse, an FVG was left behind between the BOS levels and the rally base.
Price respected this FVG zone as a demand imbalance and pushed higher, reinforcing the presence of institutional interest.
3. Supply Rejection & Entry
Price has recently tapped into a minor supply area (highlighted by the red zone) and showed early signs of rejection via bearish candles.
This coincides with a premium pricing area in the current bullish leg, providing a potential short-term sell opportunity targeting liquidity below.
4. Demand Zone Below
The next major Demand Zone lies between 1.33900 – 1.34600 (highlighted on the chart).
This area aligns with a previous SS and the origin of the bullish BOS, suggesting a high-probability reversal zone if price retraces that far.
🎯 Trade Idea
Bias: Short-term bearish into a higher timeframe bullish continuation.
Entry: Taken at 1.37449 (reaction to supply).
Stop Loss: Above supply zone – around 1.37628.
Take Profit: Just above the demand zone at 1.35993, locking in profit before potential reversal.
Risk-to-Reward: Approx. 1:5
Final Thoughts
This trade idea aligns with a smart money framework — BOS confirms directional intent, FVG and SS show institutional footprints, and the supply zone gives a clean entry.
If price aggressively taps into the demand zone and shows bullish confirmation (engulfing, BOS, or FVG fill), I’ll look to flip long for a continuation of the larger uptrend.
GBPUSD is in Bearish Trend !GBPUSD in Bearish Trend Because in 1 hour Chart Pattarn Double Top Found there and in RSI Bearish Divergence also there so the Meaning is Market IS Down

GBP/USD What do people’s think about my chart 😅 waiting for hourly to match daily trend before placing a trade
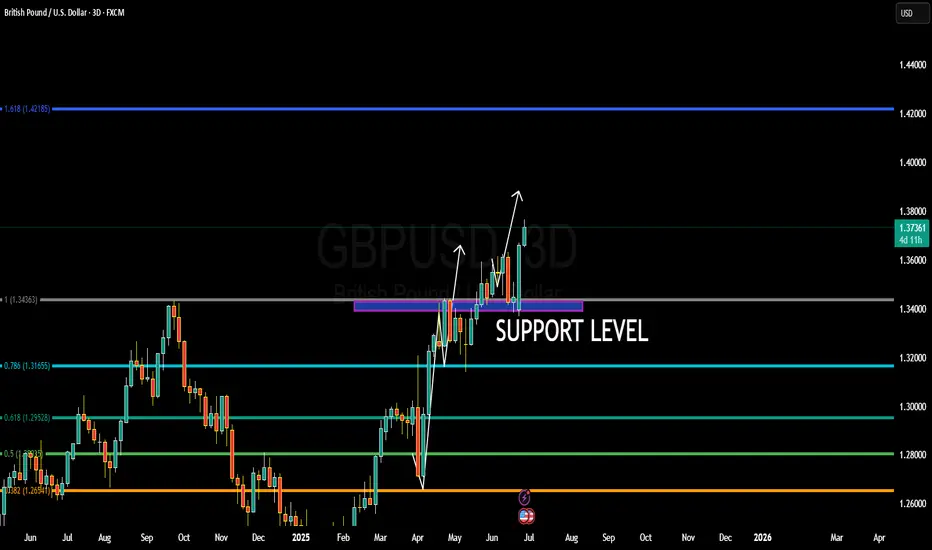
WHY GBPUSD BULLISH ???GBPUSD is unfolding exactly as anticipated, with price now hovering around the 1.3740 region and maintaining strong bullish momentum. Price has successfully bounced from the key support zone near 1.3430, which was previously a major resistance turned into solid demand. This level held firmly during multiple retests, confirming a clean breakout-retest continuation pattern. As long as this structure remains intact, I continue to hold a bullish bias targeting 1.4000 in the coming sessions.
From a fundamental perspective, the British Pound is gaining strength on the back of improved UK economic sentiment. The latest UK inflation data surprised to the upside, pushing annual CPI back above 3%, which reinforces expectations that the Bank of England may need to act sooner rather than later on rate hikes. Markets are now pricing in higher probability of a rate adjustment before the end of Q3 2025. Meanwhile, the US Dollar is under moderate pressure as recent soft labor data and downward revisions in consumer confidence readings have dampened expectations for further tightening from the Fed.
Technically, GBPUSD has cleared major Fibonacci resistance levels and is now forming higher highs and higher lows across the higher timeframes. The current bullish wave is fueled by clean institutional demand and strong price action momentum. If the pair can sustain above 1.3650–1.3680, a swift move toward the psychological 1.4000 handle is highly probable. The 1.4218 Fibonacci extension aligns as a longer-term secondary target for swing traders holding this bullish continuation.
This setup offers a solid blend of macroeconomic backing and technical structure. GBPUSD remains one of the top trending forex pairs right now, favored by strong price action, central bank divergence, and global capital rotation. I'm closely monitoring for intraday pullbacks to add long positions, aiming for extended upside as the market follows through on this bullish breakout continuation.
What Is a Change of Character (CHoCH) and How Can You Trade It?What Is a Change of Character (CHoCH) and How Can You Trade It?
Navigating the nuances of Smart Money Concept (SMC) trading requires a keen understanding of market signals like the Change of Character (CHoCH). This concept can help traders detect and react to potential trend reversals. Today, we’ll delve into the mechanics of CHoCHs, explaining how they manifest in different market conditions and how they can be strategically leveraged for trading decisions.
Understanding Breaks of Structure
Understanding Breaks of Structure (BOS) is essential for traders before delving into concepts like Change of Character (CHoCH). A BOS in trading signifies a continuation within the current trend and is marked by a clear deviation from established swing points that indicate previous highs and lows.
In the context of an uptrend, a BOS is identified when the price exceeds a previous high without moving below the most recent higher low. This action confirms that the upward momentum is still strong and likely to continue as buyers push the market to new heights.
Similarly, in a downtrend, a BOS occurs when prices drop below a previous low without breaking the prior lower high, suggesting that sellers remain in control and the downward trend is set to persist.
By recognising these points where the market extends beyond its former bounds, traders can confirm that the current trend is robust and act accordingly. This foundational concept of BOS not only helps in assessing trend strength but also sets the stage for understanding more complex patterns like CHoCH, where the focus shifts from trend continuation to potential trend reversals.
CHoCH Trading Meaning
In trading, a Change of Character (CHoCH) signals a potential shift in market dynamics, often indicating a reversal from the prevailing trend. This concept is particularly valuable as it helps traders discern when the momentum is shifting, offering a strategic point to consider adjusting their positions.
A CHoCH occurs when there's a noticeable deviation in the market's price trend. For example, in a bullish trend characterised by a series of higher highs and higher lows, a CHoCH is indicated by the price failing to set a new high and subsequently falling below a recent higher low. This suggests that buyers are losing control, and a bearish trend could be emerging.
Similarly, during a bearish trend marked by lower highs and lower lows, a bullish CHoCH would occur if the price unexpectedly breaks above a recent lower high. This break indicates that sellers are losing their grip, and a bullish trend may be starting.
The Significance of CHoCHs Across Timeframes
The fractal nature of financial markets means that patterns and behaviours recur across various timeframes, each providing unique insights and implications for trading. Understanding CHoCHs in different timeframes is crucial for traders to effectively align their strategies with both short-term opportunities and long-term trend shifts.
In intraday trading, where decisions are made on lower timeframes (like minutes or hours), a CHoCH can signal a possible short-term trend reversal. For example, if a currency pair in a downtrend on a 15-minute chart suddenly posts a higher high, this could indicate a weakening of the bearish momentum, suggesting a potential bullish reversal.
Traders might use this information to close short positions or to consider a long position, capitalising on the emerging upward trend. These short-term CHoCHs allow traders to respond quickly to market changes, potentially securing returns before larger market shifts occur.
Conversely, CHoCHs observed on higher timeframes, such as daily or weekly charts, are particularly significant because they can indicate a shift in the broader market trend that might last days, weeks, or even months. Such changes can then be used by both long and short-term traders to adjust their positioning and directional bias.
How to Identify a CHoCH
The initial step to identify a CHoCH in trading involves clearly defining the existing trend on a specific timeframe. This is done by marking the significant swing highs and lows that delineate the trend's progress. These points should represent somewhat meaningful retracements in the price, providing clear markers of trend continuity or potential reversal points.
According to the Smart Money Concept (SMC) theory, the integrity of an uptrend is maintained as long as the price does not trade through the most recent significant higher low. Conversely, a downtrend is considered intact if the price does not surpass the most recent significant lower high. Therefore, traders focus their attention on these critical points.
To identify a CHoCH, traders watch for a break in these crucial high or low points. For instance, in an uptrend, a bearish CHoCH is indicated when the price achieves a higher high but then reverses to descend below the previous significant higher low.
Similarly, in a downtrend, a bullish CHoCH occurs when the price drops to a lower low before reversing to break above the previous significant lower high, setting a new high. Both types of breaks signal a potential reversal in the trend direction.
How to Trade a CHoCH
When trading a CHoCH, it’s essential to recognise that it should be integrated with other aspects of the SMC framework to get the best results. This includes the use of order blocks and imbalances, which are key components in identifying potential reversals.
Order Blocks and Imbalances
An order block is essentially a substantial consolidation area where significant buying or selling has occurred, and prices often revisit these zones before reversing. These blocks can be seen as levels where institutional orders were previously concentrated.
An imbalance, also known as a fair value gap, occurs when the price moves sharply up or down, leaving a zone that has not been traded extensively. Price often returns to these gaps to 'fill' them, establishing equilibrium before a potential reversal happens.
In practice, traders can look for a sequence where the price first approaches an order block and begins to fill any existing imbalances. This setup increases confidence in a potential reversal. As the price meets these criteria and a CHoCH occurs, this indicates that the influence of the order block is likely to initiate a price reversal.
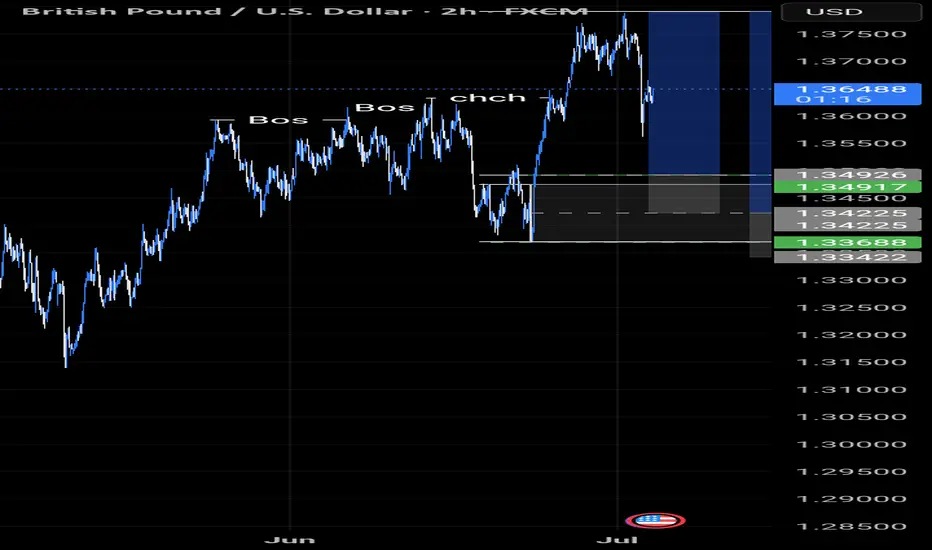
Practical Example on GBP/USD
Consider the 4-hour chart of the GBP/USD pair above. We see the pair encounter an order block on the left, one that’s visible on the daily chart. As the price interacts with this block, it begins to retrace, attempting to fill the imbalance but moves away. Eventually, the price completes the fill of the imbalance and meets the previously established order block.
Switching to a 1-hour timeframe, this scenario unfolds similarly. After reaching the order block on the 4-hour chart, another CHoCH occurs, signalling the start of a new uptrend. This lower timeframe CHoCH, following the meeting of the order block, corroborates the potential for a reversal initiated by the higher timeframe dynamics.
This example illustrates how CHoCHs can be effectively utilised across different timeframes, tying back to the fractal nature of markets discussed earlier. By recognising these patterns and understanding their interaction with order blocks and imbalances, traders can strategically position themselves to capitalise on potential market reversals, aligning their trades with deeper market forces at play.
CHoCH vs Market Structure Shift
A Market Structure Shift (MSS) is a specific type of Change of Character that includes additional signals suggesting a potential trend reversal. Unlike a straightforward CHoCH that typically indicates a trend is shifting but may also be a false break, an MSS can be seen as a higher confluence CHoCH. An MSS occurs after the market first makes a key movement contrary to the established trend—forming a lower high in an uptrend or a higher low in a downtrend—without plotting a higher high or lower low.
Following these preliminary signals, an MSS is confirmed when there is a decisive break through a significant swing point accompanied by a strong displacement (i.e. impulse) move, creating a CHoCH in the process. This sequence not only reflects that the prevailing trend has paused but also that a new trend in the opposite direction is establishing itself.
Due to these additional confirmations, an MSS can offer added confirmation for traders, indicating a stronger likelihood that a new, sustainable trend has begun. This makes the MSS particularly valuable for traders looking for more substantiated signals in their trading strategy.
The Bottom Line
The concept of a CHoCH is instrumental in navigating the complexities of SMC trading. By identifying these crucial market signals, traders may align their strategies to capitalise on market movements efficiently.
FAQs
What Is CHoCH in Trading?
In trading, CHoCH is a technical observation that signifies a change in the trend's character, where the price movement breaks from its established pattern of highs and lows, suggesting a potential reversal or substantial shift in the market's direction.
What Is CHoCH in SMC Trading?
In Smart Money Concept (SMC) trading, a Change of Character (CHoCH) refers to a clear shift in market behaviour that indicates a potential reversal of the prevailing trend. This concept is used by traders to detect early signs of a momentum shift that might lead to significant changes in price direction, enabling strategic adjustments to their trading positions.
What Is a CHoCH in the Market Structure?
A CHoCH in market structure is identified when there is an observable deviation from established price patterns — specifically when new highs or lows contradict the current trend. It signifies that the previous market sentiment is weakening, and a new opposite trend may be starting, prompting traders to reassess their strategies.
How Do You Identify a CHoCH?
Identifying a CHoCH involves monitoring significant swing highs and lows for breaks that are contrary to the existing trend. For instance, in an uptrend, a CHoCH would be indicated by a failure to reach a new high followed by a drop below the recent higher low, suggesting a shift to a bearish outlook.
What Is ChoCH vs BOS in Trading?
While both CHoCH and Break of Structure (BOS) are critical in assessing market dynamics, they serve different purposes. CHoCH indicates a potential trend reversal by highlighting a significant change in the price pattern. In contrast, a BOS indicates a continuation of the current trend by showing the price surpassing previous significant highs or lows, reinforcing the ongoing direction.
This article represents the opinion of the Companies operating under the FXOpen brand only. It is not to be construed as an offer, solicitation, or recommendation with respect to products and services provided by the Companies operating under the FXOpen brand, nor is it to be considered financial advice.

GBP/USD Short Setup – Rising Wedge BreakdownGBP/USD Short Setup – Rising Wedge Breakdown
Timeframe: 2H
The pair has formed a rising wedge pattern, typically a bearish reversal signal. Price has now broken below the lower trendline, suggesting a potential downside move.
Setup Details:
Entry: ~$1.3717 (post-breakout)
Stop Loss: ~$1.3826 (above recent highs)
Target Zone: $1.3477 to $1.3407
Technical Analysis:
Rising wedge pattern breakdown confirmed
Supertrend indicator has flipped bearish
Momentum divergence visible on lower timeframes (not shown)
Fundamental Context:
GBP remains under pressure due to weak UK economic data and ongoing BoE rate cut expectations
USD strength backed by persistent inflation concerns and hawkish Fed tone
Bias: Bearish (Short-Term Swing Trade)
Look for potential retests of broken support for confirmation. Manage risk accordingly as volatility may increase ahead of upcoming macro events

Wednesday Model70% of the time Wednesday is a classic sell
With this Model we take the true Monday high and low(00:00 EST)
Look for a rejection of a Swing high/low from the weekly/monthly TF
4hr CRT and a Market Structure Shift on the 1hr
Entry on the Order Block on the 1hr
Target? the Monday low

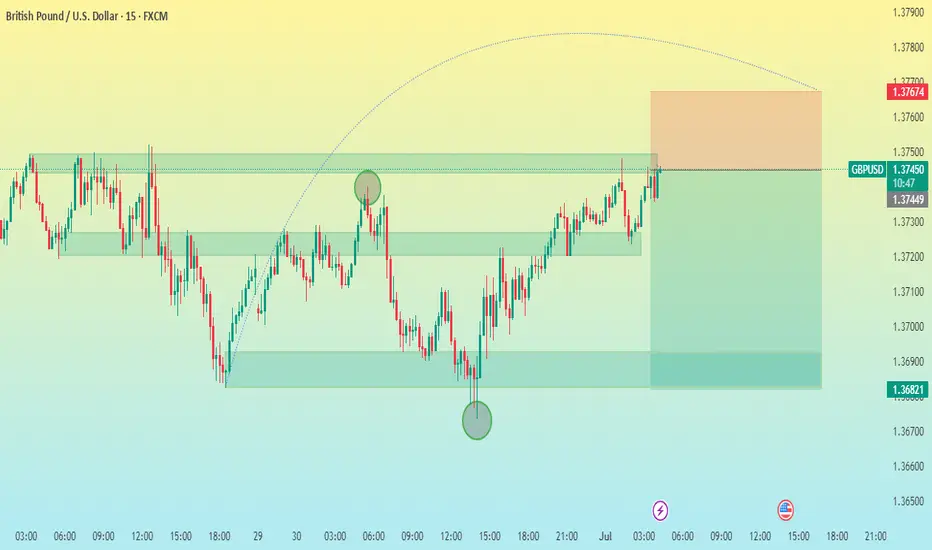
GBP/USD 15M CHART PATTERNHere's a clear summary of your GBP/USD sell trade setup:
---
Trade Type: Sell
Entry Price: 1.37440
✅ Take Profit Targets:
1. TP1: 1.37240
2. TP2: 1.37032
3. TP3: 1.36821
❌ Stop Loss:
SL: 1.37674
---
Risk-Reward Overview:
Risk (SL): 1.37674 - 1.37440 = +23.4 pips
Reward:
TP1: 1.37440 - 1.37240 = 20 pips
TP2: 1.37440 - 1.37032 = 40.8 pips
TP3: 1.37440 - 1.36821 = 61.9 pips
So the best-case reward-to-risk ratio is approximately 2.6:1.
Let me know if you’d like a risk management calculator, trailing stop plan, or chart visualization for this setup.
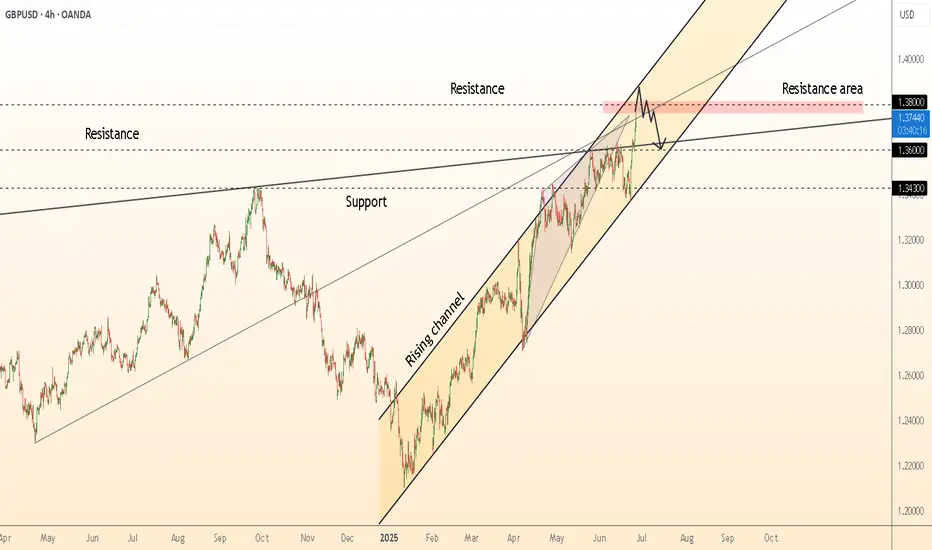
DeGRAM | GBPUSD preparing for a correction📊 Technical Analysis
● Cable is pressing the rising-channel ceiling together with the March swing-high supply at 1.378-1.380; successive long-upper-wicks plus fading 4 h RSI signal bull exhaustion at this dual resistance.
● A tiny evening-star has formed inside the pink resistance band and price is slipping back under the broken inner trend-line; first objective is the former breakout shelf / median line near 1.360, with the lower rail and April pivot at 1.343 next in view.
💡 Fundamental Analysis
● UK election blackout, soft retail-sales surprise and firmer month-end USD funding bids narrow the short-rate gap again, sapping fresh sterling demand.
✨ Summary
Short 1.374-1.380; sustain below 1.360 opens 1.343. Bear view void on a 4 h close above 1.380.
-------------------
Share your opinion in the comments and support the idea with a like. Thanks for your support!
GBP/USD - Long 4H looks has formed bullish FVG
15 mins is also bullish - it might take out buyside liquidity at 1.37500 before retracing to 4H bullish FVG

GBPUSD BullishWe are expecting a long continuation on GU after a clear BOS and liquidity sweep on the 1H candle. We patiently wait for a bullish rejection or strong bullish momentum candle as confirmation for entries. Apply proper risk management.

GBPUSD At A Point of Indecision No clear direction going into the week ahead... Will sit tight, watch Monday and Tuesday before taking action... bullish continuation or not...
Kindly, lets see.