GBP/USD💰Symbol: { GBP/USD }
🟩Price: { 1.37252 & 1.37500 }
🟥Stop: { 1.37731 }
1️⃣profit: { 1.36844 }
2️⃣profit: { 1.36397 }
3️⃣profit: { 1.36072 }
📊Check your chart before entering.
🚨Check before use to make sure there is no important news.🚨
USDGBP trade ideas

GBPUSD InsightHello to all subscribers.
Please feel free to share your personal opinions in the comments. Don’t forget to hit the booster and subscribe.
Key Points
- NATO’s 32 member countries have agreed to increase defense spending to 5% of GDP by 2035, as requested by U.S. President Trump.
- Federal Reserve Chair Jerome Powell, speaking before the Senate, stated that the Fed is "in a position to wait" and noted it is difficult to predict how tariffs will impact inflation.
- The Fed has decided to ease the Supplementary Leverage Ratio (SLR) regulation that applied to major banks. With the regulatory easing, large banks are expected to increase their purchases of U.S. Treasuries, which could lead to lower bond yields.
Key Economic Events This Week
+ June 26: U.S. Q1 GDP
+ June 27: U.S. May Personal Consumption Expenditures (PCE) Price Index
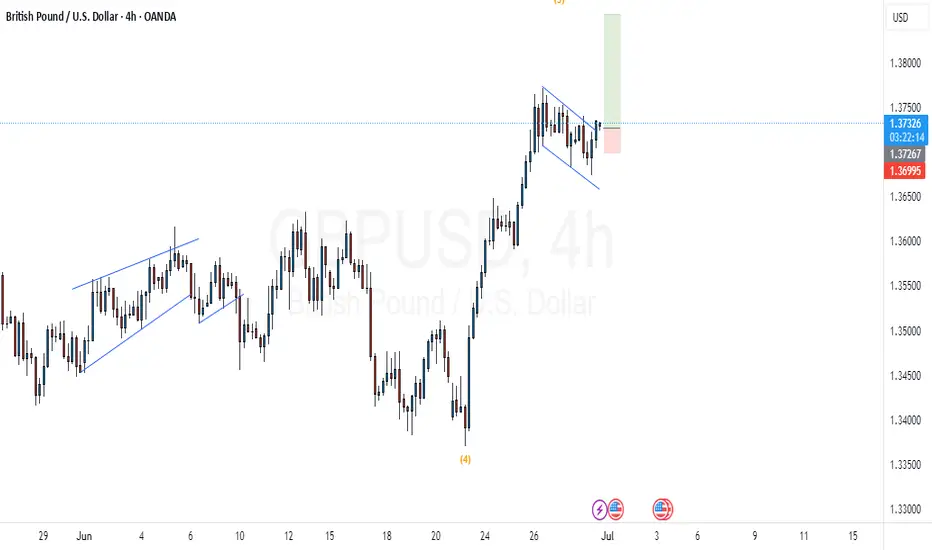
GBPUSD Chart Analysis
Although the pair pulled back after encountering resistance from the trendline, it successfully rebounded from the 1.34000 level and climbed to 1.37000. After breaking through the resistance this time, it is now likely to rise toward the upper trendline. The projected high is expected to be around the 1.40000 level.

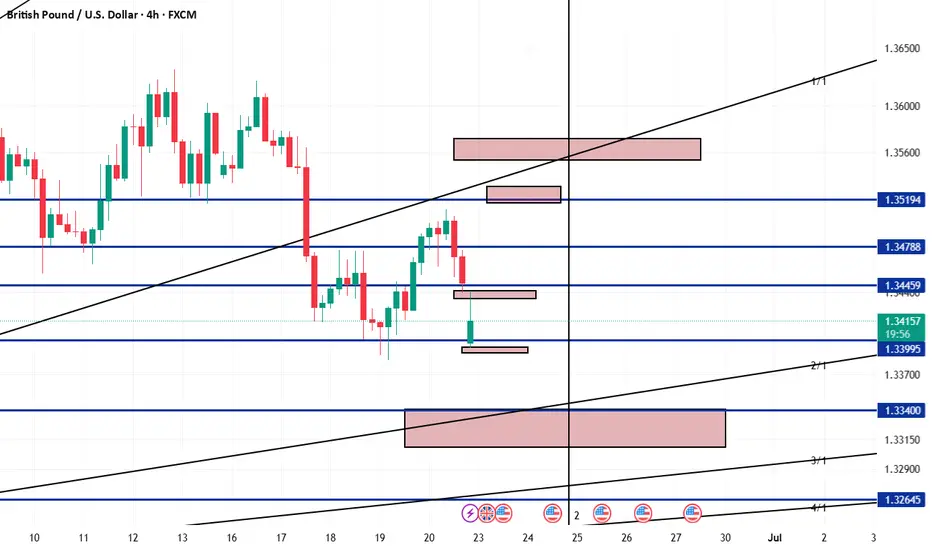
GBPUSD AnalaysisGBPUSD Analaysis on 4H frame According to my own analysis strategy
Selling Zones :
1.35150 - 1.35300
1.35530 - 1.35720
buying zones
1.33427 - 1.33080
#GBPUSD: Bulls are in control, DXY Dropping Sharply!Hello Team,
We have identified a promising opportunity with a favourable price movement. The Pound Sterling to US Dollar (GBPUSD) pair has exhibited strong bullish volume, indicating potential further appreciation.
The current geopolitical tensions, particularly the involvement of the United States in the Iran-Israel conflict, are expected to negatively impact the US Dollar. This decline could potentially lead to an appreciation of the GBPUSD pair and other USD-denominated currencies.
It is advisable to closely monitor the price behaviour of the GBPUSD pair and consider potential investment opportunities based on its current trend.
Best regards,
Team Setupsfx

GBPUSD Next Week MondayThe GBP/USD pair has recently shown resilience, trading above 1.3700 and near multi-year highs, but technical and fundamental indicators suggest that a bearish tone could emerge early next week, particularly on Monday. While the pair is currently supported by a bullish bias according to some short-term indicators, there are several factors that could shift momentum to the downside.

Smart Scalping on GBP/USD: 15-Minute Chart StrategyUnlock the power of precision trading with my exclusive GBP/USD 15-minute scalping strategy. This isn’t just another chart setup—it’s a battle-tested system built on real-time confluence: EMA crossovers, RSI confirmation, Supertrend alignment, and Fibonacci retracement zones. Every trade idea I share is backed by deep analysis, strict risk management, and a clear entry/exit plan.
Whether you're a beginner looking to learn or a trader seeking consistency, my strategy delivers clarity in the chaos of the markets. Join me to gain access to high-probability setups, live breakdowns, and mentorship that turns theory into profit.
💼 Ready to level up your trading? 💸 Invest in insights that pay for themselves. 📈 Let’s grow together—one smart trade at a time.

GBP/USD BEARS ARE STRONG HERE|SHORT
Hello, Friends!
GBP/USD pair is in the uptrend because previous week’s candle is green, while the price is clearly rising on the 3H timeframe. And after the retest of the resistance line above I believe we will see a move down towards the target below at 1.358 because the pair overbought due to its proximity to the upper BB band and a bearish correction is likely.
Disclosure: I am part of Trade Nation's Influencer program and receive a monthly fee for using their TradingView charts in my analysis.
✅LIKE AND COMMENT MY IDEAS✅

GBPUSD opportunity to go SHORTThe pair has been showing weakness for some time through RSI divergence.
On hourly chart it printed the indecision candle followed by two red candles. This gives us the cue for bearish momentum.
Since we need multiple reasons to short sell so we identify the recent low and if the price goes lower than this than we initiate a short trade.
For ready reference the TPs have been marked on chart.
wishing you a PROFIT-able trading.

GBP/USD Bearish Reversal Pattern Detected GBP/USD Bearish Reversal Pattern Detected 🔻🦈
The chart illustrates a potential bearish Gartley pattern formation near the 1.3736 resistance zone, which has historically triggered price rejections (red arrows).
🔍 Key Observations:
📌 Price action completed a bearish harmonic pattern, suggesting a reversal setup.
💡 Multiple rejections at the upper resistance zone (1.3730–1.3780) highlight strong selling pressure.
📉 Break of trendline support confirms shift in structure.
🟠 Historical support zones (orange circles) now align with the projected target level: 1.3512.
🔽 A clean breakdown below 1.3650 could accelerate bearish momentum toward the target.
🎯 Target: 1.35124
🛑 Resistance: 1.3730–1.3780
✅ Support: 1.3510–1.3550 zone

GBPUSD Will Go Up! Buy!
Take a look at our analysis for GBPUSD.
Time Frame: 8h
Current Trend: Bullish
Sentiment: Oversold (based on 7-period RSI)
Forecast: Bullish
The market is on a crucial zone of demand 1.370.
The oversold market condition in a combination with key structure gives us a relatively strong bullish signal with goal 1.378 level.
P.S
Please, note that an oversold/overbought condition can last for a long time, and therefore being oversold/overbought doesn't mean a price rally will come soon, or at all.
Disclosure: I am part of Trade Nation's Influencer program and receive a monthly fee for using their TradingView charts in my analysis.
Like and subscribe and comment my ideas if you enjoy them!

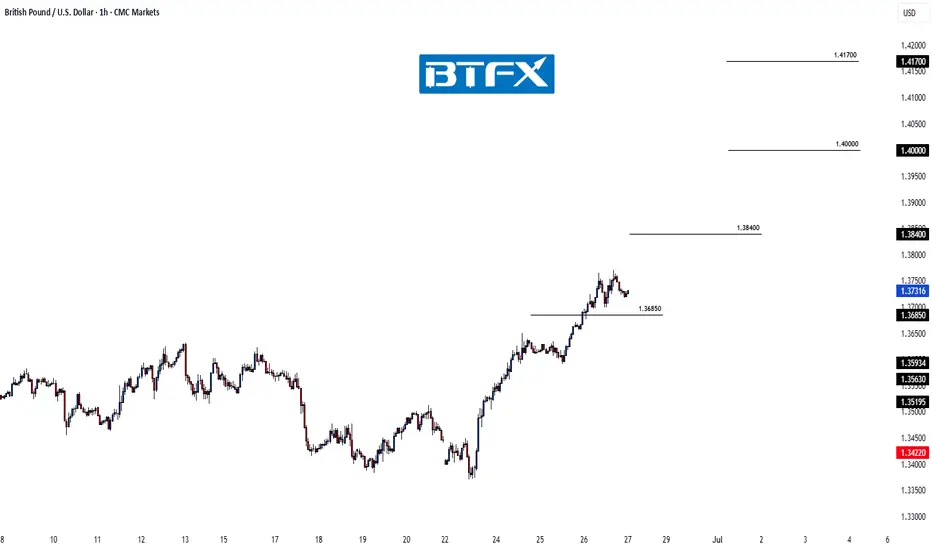
GBP/USD Rally in Full Swing – Bullish Targets AheadHi everyone,
Price achieved the 1.36850 having found support near the 1.33800 level.
As previously noted, the clearance of these levels strengthens our expectation for further upside, with the next key level of interest around 1.38400. We'll be watching to see how price action develops from here.
We’ll continue to provide updates on the projected path for GBP/USD as price approaches this target.
The longer-term outlook remains bullish, and we expect the rally to continue extending further from the 1.20991 January low towards 1.40000 and 1.417000.
We’ll be keeping you updated throughout the week with how we’re managing our active ideas. Thanks again for all the likes/boosts, comments and follows — we appreciate the support!
All the best for the week ahead. Trade safe.
BluetonaFX
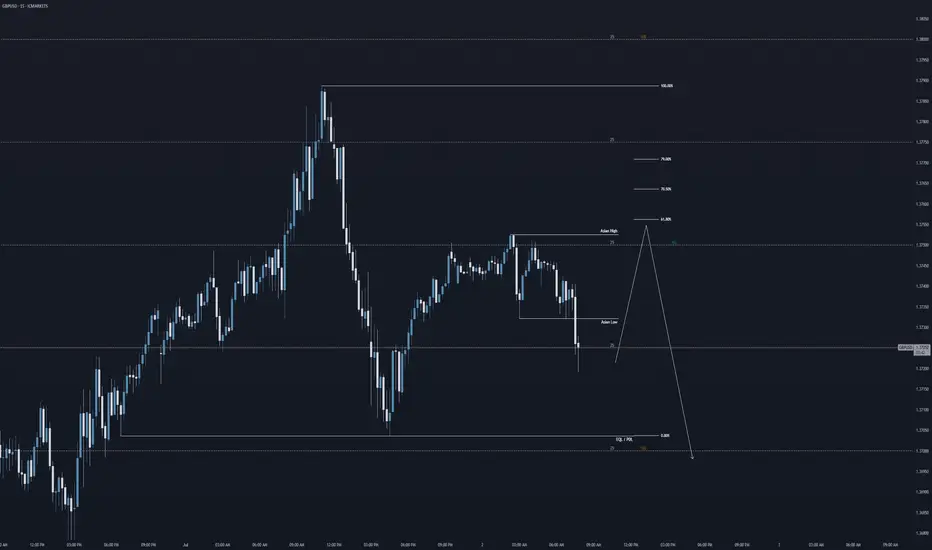
GU: Asian highs > Previous Day Low?Hi everyone,
Here is my forecast this morning for GBPUSD. Overall I'm thinking bearish, but I reckon that price could take out the Asian range highs first and then give us a bearish leg towards the previous day low.
Regards,
Aman | SMC Wolf FX
1-1 student onboarding is currently open (website in my signature & profile)
GBPUSD| - Riding the Bullish Wave with Precision📌 Pair: GBPUSD
📈 Bias: Bullish
🕰 HTF View (4H):
Major external structure (HH) broken to the upside — clear bullish intent from smart money. Strong momentum confirms continued interest in pushing price higher.
🧭 MTF View (30M → 2H clarity):
Refined bullish structure forming on 30M. Using the 2H to filter noise and spot deeper liquidity. Watching closely for a sell-side sweep into OB for cleaner, higher-probability LTF entries.
🎯 Entry Criteria:
CHoCH flip → Liquidity sweep → OB mitigation
Perfect sequence = greenlight for execution.
🎯 Target: Structure highs above
🧠 Mindset Note:
Sometimes the best entries come after everyone else gets taken out. Be the one who waits, confirms, then strikes with intention.
Bless Trading!
Short to Long Waiting for the market to reach the poi and wait for reaction to short to the bullish poi
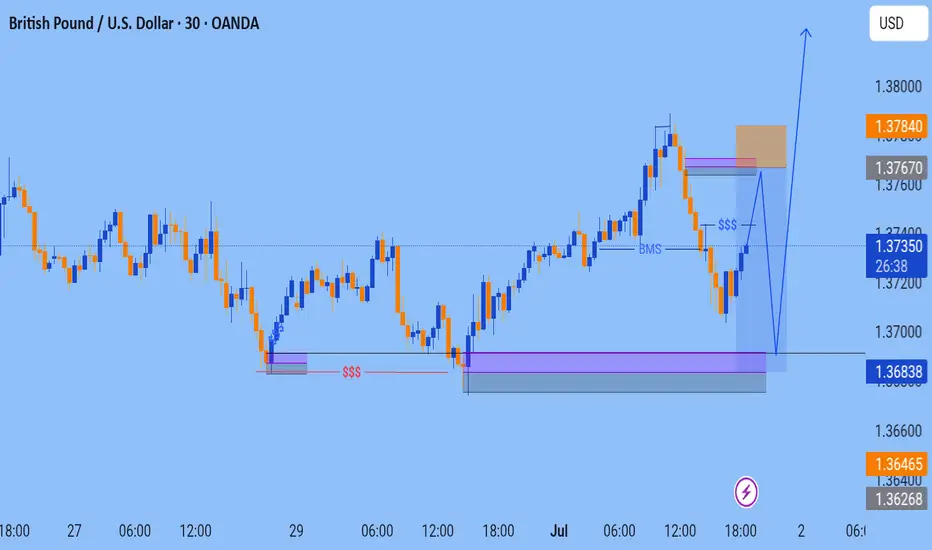
GBPUSD - Bullish Channel (TCB Strategy)📈 GBPUSD – Falling Wedge Breakout Within Bullish Channel (TCB Strategy)
Type: Trend → Countertrend → Breakout
Timeframe: 1H
Status: Trade Running
🔍 Analysis Summary:
GBPUSD is respecting a strong ascending channel, with a recent correction forming a textbook falling wedge pattern. Price has now broken out of the wedge with bullish momentum during the NY session, signaling a potential continuation toward the upper boundary of the channel.
This setup aligns perfectly with my TCB Strategy:
Trend: Bullish market structure intact
Countertrend: Falling wedge correction
Breakout: Clean bullish breakout above wedge resistance
🧠 Trade Plan:
Entry (EP1): 1.37350 (Breakout entry)
SL: 1.36850 (below wedge low)
TP1: 1.37600
TP2: 1.38200 (channel top)
🛠️ Checklist Score: ✅ 100%
All criteria met, including session timing, structure confluence, breakout candle quality, and risk-reward profile.
📌 Watching how price reacts around 1.37600. Clean break above that could open the path to 1.38200+.
Follow for updates.
#GBPUSD #ForexAnalysis #TCBStrategy #BreakoutSetup #FallingWedge #PriceAction

GBPUSD Long, 1 JulyPrice is reacting from a Daily bearish OB, but this setup aims to catch the pullback — making a long valid here despite HTF structure.
LTF gave a clean 15m BOS, followed by reaction from the extreme 15m OB.
Entry was taken after a confirmed 1m BOS + OB retrace, in alignment with structure and location.
🎯 Target: 30 pips (1:3 RR)
⚠️ No clear Asia target, but structure favors this move
📍Entry: 1m OB after BOS
📉 Risk: 0.5%
High-probability pullback play, executed with confirmation and clean structure.

GBPUSDCable still have some upside towards the level highlighted on the chart.
Disclosure: We are part of Trade Nation's Influencer program and receive a monthly fee for using their TradingView charts in our analysis.

GBP_USD WILL KEEP GROWING|LONG|
✅GBP_USD broke the key structure level of 1.3620
While trading in an local uptrend
Which makes me bullish biased
And I think that after the retest of the broken level is complete
A rebound and bullish continuation will follow
LONG🚀
✅Like and subscribe to never miss a new idea!✅
Disclosure: I am part of Trade Nation's Influencer program and receive a monthly fee for using their TradingView charts in my analysis.


GBPUSD buyer in controlDaily candle closed with strong bullish.
Expecting a healthy retracement before another bullish movement
Good Luck

Bullish IdeaMarket forming what seems to be a bullish flag pattern, which results into an upward move. So we expect a good bullish pattern. Break out the structure and we
ready for the show now
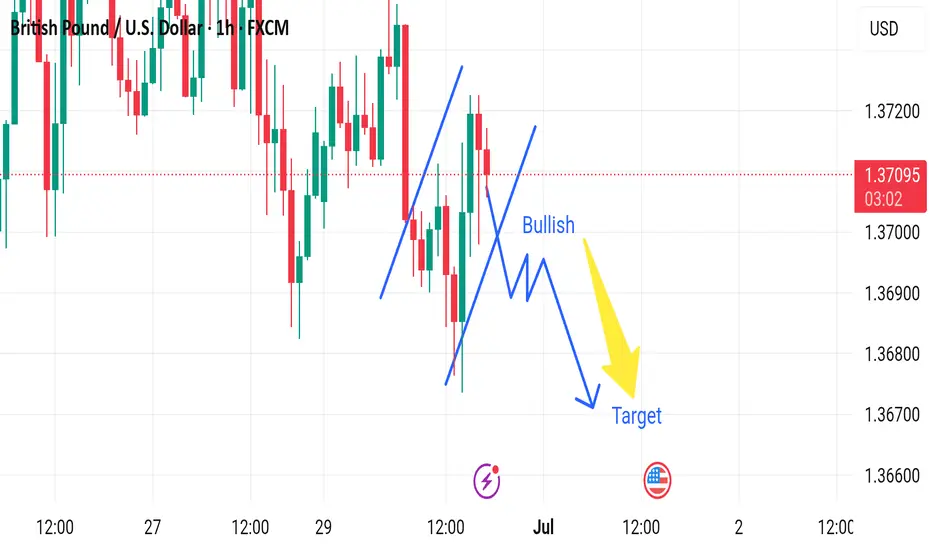
Market next target 🔀 Disruption Analysis – Bullish Alternative Scenario
While the current chart outlines a bearish scenario after a short-term bullish correction, leading to a drop toward the target near 1.36600, here’s how a bullish disruption could unfold instead:
---
🟢 Bullish Disruption Possibility:
1. False Breakdown / Bear Trap:
The market may dip slightly below recent lows to trigger sell stops and liquidity grab, then reverse upward.
If price finds strong buying interest around 1.3690–1.3700, it could spark a bullish reversal.
2. Strong Rejection Candles:
Watch for bullish engulfing or pin bar formations on lower timeframes (15m or 30m) near the dip area.
These would signal loss of bearish momentum.
3. Break of Lower High Structure:
A break above 1.3720 would shift short-term market structure to bullish.
It could lead to a move toward 1.3750–1.3780.
4. Macro Fundamentals:
Hawkish BOE comments or weak U.S. data could reverse USD strength, lifting GBP/USD.
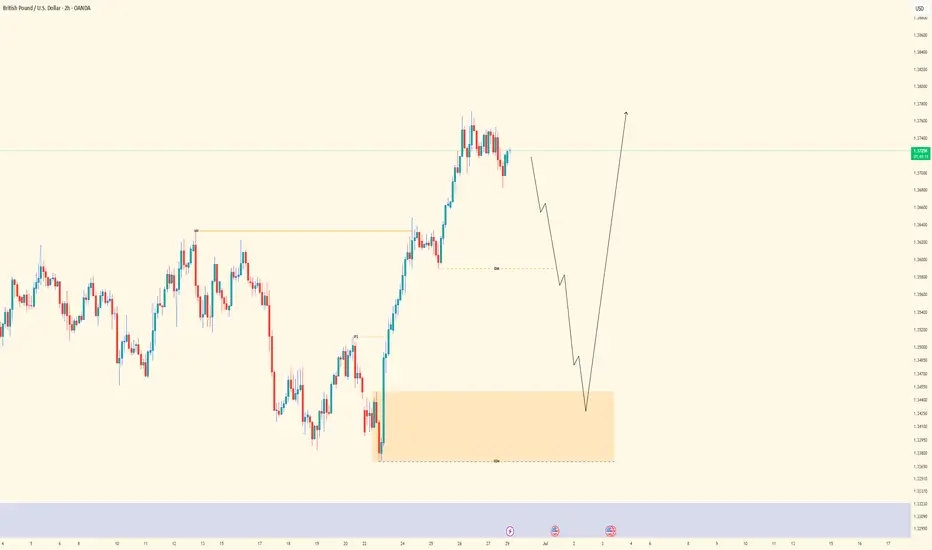
GBPUSD PullbackGBPUSD is in an overall bullish market
However, after a large bullish push, I am expecting price to pullback (sell off).
Price met resistance a weekly supply zone and closed as an indecision candle on the Daily.
The lower blue EMA crossed below the higher RED EMA on the 1hr chart.
Expecting price to selloff and find support at the 50.0 Fib level which also correlates with a demand zone, before continuing the overall trend.
