Bearish Reversal at Supply – GBP/USD🧠 Trade Breakdown:
Price broke structure cleanly to the downside, leaving behind a clear supply zone on the higher timeframes. Now we’re seeing a textbook pullback into that zone — slow, weak volume — signaling distribution before the next potential move down.
📍 Key Confluences:
• Higher timeframe supply zone respected
• Break of structure followed by clean pullback
• Consolidation + order buildup into the zone
• High reward-to-risk (estimated 7:1)
• Supply zone: 1.3718 – 1.3735
• Entry: 1.37206
• SL: Above 1.3735
• TP: 1.36275
📸 Trade Setup:
Waiting for a bearish reaction or engulfing confirmation from inside the purple supply zone. If rejection holds, I’m targeting the green demand zone below.
🧠 Mindset:
No chasing. No forcing. This is a sniper setup only. Full trust in my zone and risk management.
Trade Simple. Live Lavish.
— Quil Lavish
USDGBP trade ideas

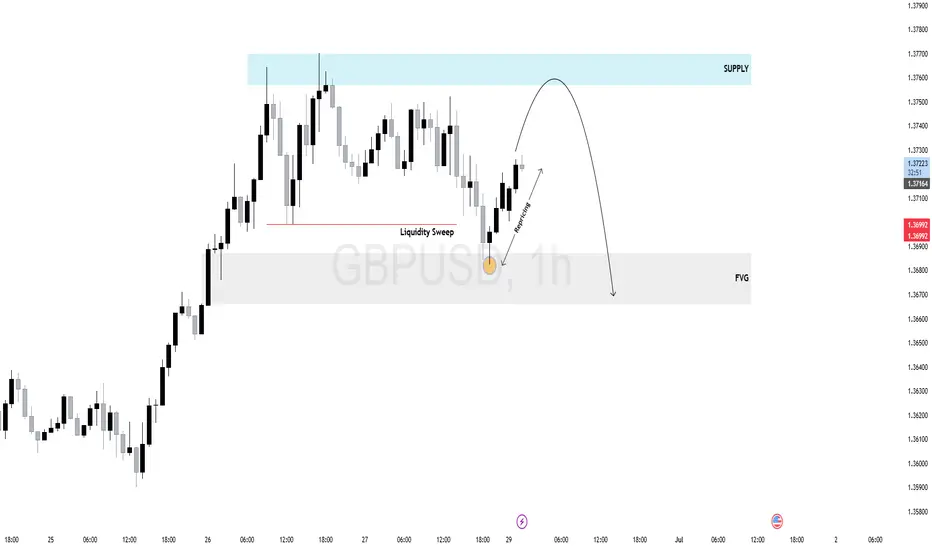
$GU (GBPUSD) 1H AnalysisPrice swept internal liquidity before dropping into a clear 1H Fair Value Gap (FVG), which acted as a draw on liquidity. Following the mitigation, GBPUSD is now retracing toward a high-probability supply zone.
Expect potential rejection as price rebalances inefficiency and seeks sell-side liquidity.
Watch for bearish confirmation inside the supply zone — ideal for intraday shorts if the structure shifts.
Pullbacks = short opportunities.
GBP/USD Daily AnalysisPrice is bullish on the daily time frame.
After 4 consecutive bullish days, price printed a bearish inside candle on Friday.
This could potentially be the start of a correction back towards the moving averages and possibly towards the first Fibonacci retracement levels (38.2% and 50%).
If you agree with this analysis, look for a trade that meets your strategy rules.

GBP/USD HEIST ALERT: Bullish Breakout or Bearish Trap?🌟 Hey! Hola! Ola! Bonjour! Hallo! Marhaba! 🌟
Calling all Market Robbers & Profit Pirates!💸💰
🔥 Thief Trading Intel: Our crew’s latest heist targets GBP/USD "The Cable"—bullish breakout incoming! Long entry only. High-risk Red Zone ahead: overbought, consolidating, and ripe for a reversal. Don’t get caught in the bear trap! 🏴☠️
"Take your loot and run, trader—you’ve earned this steal!" 💪🎯
🚪 ENTRY: The Heist Begins!
📈 "Wait for MA breakout (1.36000) then STRIKE—bullish profits await!"
Option 1: Buy Stop above Pink Resistance (breakout confirmation).
Option 2: Buy Limit at swing low/high (15-30 min TF).
📌 Pro Tip: SET AN ALERT! Don’t miss the breakout.
🛑 STOP LOSS: Escape Route
🔊 "Yo, listen up! 🗣️
Buy Stop orders? NO SL until after breakout! 🚀
Rebels: Place SL wherever—but you’ve been warned! ⚠️🔥
📍 Thief SL (Smart Crew): Recent/swing low (1.35000, 4H TF).
📍 Adjust based on your risk, lot size, and orders.
🎯 TARGET: Loot & Exit!
🎯 1.37500 (or escape early if the market turns!)
⚡ SCALPERS’ QUICK GRAB
👀 Long scalps ONLY!
Big wallets? Raid now.
Small stacks? Join swing traders.
Trailing SL = Your Money Shield! 🛡️💰
📢 WHY THIS HEIST? (GBP/USD Bullish Momentum)
"The Cable" is heating up! Key drivers:
Fundamentals (COT, Macro Data)
Sentiment & Intermarket Trends
Future Targets & Score Outlook
🔗 Full intel? Bio links below! 👉👉
⚠️ TRADING ALERT: News = Danger Zone! 📰🚨
News = Volatility Spikes! Protect your loot:
❌ Avoid new trades during news.
🔒 Trailing SL = Profit Lock.
💖 SUPPORT THE HEIST CREW!
💥 SMASH THAT BOOST BUTTON! 💥
More boosts = easier money grabs!
Stronger crew = bigger heists!
Profit daily with Thief Trading Style! 🏆🚀
Next heist coming soon—stay tuned! 🤑🐱👤🤩

GBPUSD retracement GBP/USD 4H Short Setup – ICT Concept
Price has created relative equal highs in premium, indicating a potential liquidity pool above. Following that, we’ve seen a bearish Break of Structure (BoS) on the 4H timeframe, confirming a shift in order flow.
Currently, price has returned to the discount zone for sells within the previous range (between 0.5–0.79 retracement), offering a potential entry point for shorts.
The setup aligns with smart money concepts:
Liquidity sweep above equal highs.
SMT divergence with EURUSD
BoS confirming bearish intent.
Price retracing into a premium zone for institutional sell interest.
Targets:
First target near the smaller demand zone ~1.36400.
Final target toward the larger imbalance and demand block near 1.34800.
Bias: Bearish below 1.37300 as long as structure and liquidity context remain intact.
GBP/USD will most likely have sell offs during Asia session allowing London session to manipulate into a daily discount before making legs down in New York session on Monday

Analysis of Trades and Trading Tips for the GBP/USDThe test of the 1.3614level occurred when the RSI indicator had already risen significantly above the zero line, which limited the pair's upside potential. For this reason, I did not buy the GBP/USD.
There has been progress in the trade negotiations between China and the United States: yesterday, both sides stated that consensus had been reached on the main issues. This breakthrough, the result of several months of intense discussions, gives hope for the stabilization of global financial markets. Though not disclosed in detail, the agreements likely included key issues such as the export of rare earth materials from China to the U.S. to China. Nevertheless, despite the optimistic statements, analysts advise against excessive enthusiasm. Previous negotiation rounds also ended with promises that were later unfulfilled. The key to success will be boss sides' ability to honor their commitments and show willingness for further concessions. The impact of this progress on the global economy is hard to overestimate. Reducing trade tensions could stimulate the growth of international trade, ease inflationary pressures, and bolster consumer confidence. However, risks remain, and the agreement's long-term outcome will depend on both countries' subsequent actions.
Today, we should pay attention to the speech by Philip Lane, a British Central Bank representative, as there are no macroeconomic releases from the the eurozone. Markets will closely monitor his rhetoric for hints regarding the central bank's plans on interest rates. Investors hope to hear more clarity from Lane about how the ECB intends to proceed with rates and whether the regulator plans further cuts this summer. Overall, Philip Lane's speech will be the key event of the day for financial markets. His comments may influence currency movements in the first half of the day. Investors are advised to watch his remarks closely and consider them in decision-making

GBPUSD - Trade Idea for Today ! Hurry Up !Details on chart. There some important levels here and we might see a downward move here.
CMCMARKETS:GBPUSD FX:GBPUSD OANDA:GBPUSD FX_IDC:GBPUSD

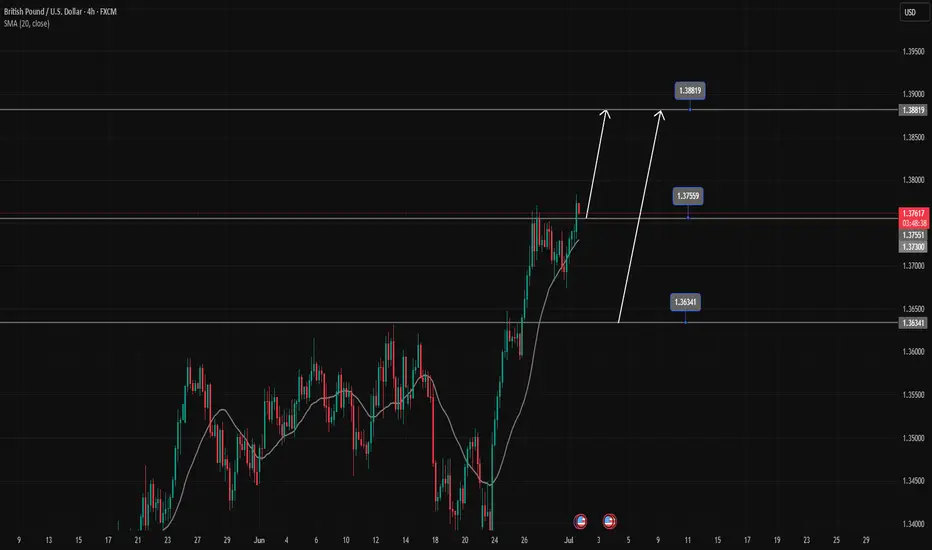
GBPUSD's strong uptrend continuesGBPUSD is in a strong uptrend, Price has just broken the resistance zone of 1.37500.
All the bullish momentum is heading towards the resistance zone of 1.388.
If there is a close of the h4 candle below the resistance zone of 1.375, there will likely be a Pullback to 1.363 to find more buying momentum towards the target at the resistance zone of 1.388
📈 Key Levels
Support: 1.375-1.363
Resistance: 1.388
📊 Recommended Trade Setups
BUY GBPUSD 1.375-1.373 Stoploss 1.37000
BUY GBPUSD 1.363-1.361 Stoploss 1.35800
SELL GBPUSD 1.388-1.390 Stoploss 1.39300
GBPUSD SHORT POSITION I think the price could go down from this range because I think this is a key point.


GBPUSD Ending Diagonal.On the Daily, the pairs grind to the upside is still going on, but we have signs of exhaustion:
- Bearish RSI divergence
- Price is inside a channel with a shallow slope (ending diagonal)
This leads me to consider we are close to finishing blue 5 of black 5, and can expect a correction soon.
Ideally, I'd wait for a lower low / lower high and break of the bottom of the channel.
Initial targets are the 2 purple levels shown in the chart.

GBPUSDHello traders,
With all news that happening in middle east since yesterday.
I hope ending the war with no humanity loss.
That will affect GBPUSD and GOLD, both of them looks like near the ups.
active now,
Good luck for me and you

GU-Tue-01/07/25 TDA-Strong resistance area approaching 1.37500Analysis done directly on the chart
Follow for more, possible live trades update!
I often share my live trades in Tradingview public chat in London session, stay tuned!
Timing!
You might ask yourself why sometimes your
trade idea was good but still ended up hitting your sl before it moves to your direction.
The reason is simple: Timing.
price is just not ready to push at that time
and needed extra liquidity and structure before it finally has the force to push.
Understanding when the market is ready is one of the most difficult thing for a trader to do but with experience you start to understand better and improve.
If you like the way I present and analyze, make sure to boost,
share and follow me for more future posts, ideas and useful informations.
Active in London session!
Not financial advice, DYOR.
Market Flow Strategy
Mister Y

Updated GBP/USD Trade Idea: New Setup If Price Reaches Key LevelAfter successfully executing the previous trade, I’m now monitoring GBP/USD for a fresh opportunity. If the price reaches this point, it aligns with a high-probability zone where market structure suggests a potential reaction. This area has historically acted as a decision point, and I’ll be watching closely for confirmation before entering the next position.
This updated idea reflects a disciplined, price-action-based approach—focused on timing, structure, and market behavior. Whether you're a day trader or swing trader, this setup offers a clean risk-to-reward profile and fits well within an intraday strategy.
📈 Stay tuned for real-time updates, trade management insights, and detailed breakdowns. 💬 Follow for more GBP/USD strategies and actionable forex content.

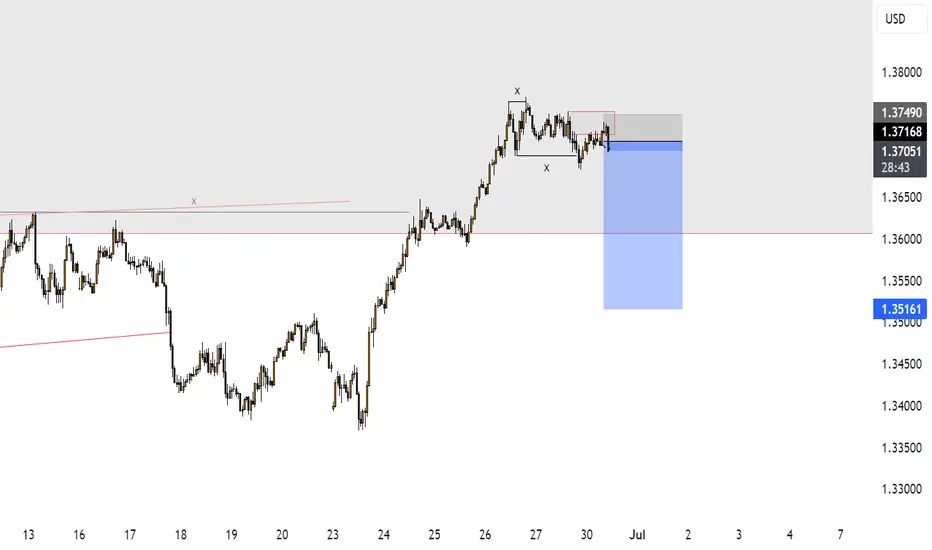
GBP/USD Tactical Shift: Long Closed, Short Bias ActivatedAfter successfully capturing the upside move on GBP/USD, price has now reached a key resistance zone where bullish momentum appears to be fading. The recent price action shows signs of exhaustion, with lower highs forming near the top and a noticeable slowdown in buying pressure.
This shift in structure suggests a potential reversal opportunity. I'm now positioning for a short setup, anticipating a corrective move as sellers begin to step in. The risk is clearly defined above the recent highs, with downside targets aligned with previous reaction zones and intraday support levels.
This transition from long to short reflects a dynamic response to evolving market conditions—focused, disciplined, and opportunity-driven.

GBPUSD Potential DownsidesHey Traders, in the coming week we are monitoring GBPUSD for a selling opportunity around 1.37400 zone, GBPUSD is trading in a downtrend and currently is in a correction phase in which it is approaching the trend at 1.37400 support and resistance area.
Trade safe, Joe.

GBP/USDPrice action trading is a methodology in financial markets where traders make decisions based on the actual price movements of an asset over time, rather than relying heavily on technical indicators or fundamental analysis. It involves observing and interpreting patterns and trends in price charts to predict future price movements.


GBPUSD Selling from resistance at 1.37600📈 GBPUSD – Technical Analysis (4H Timeframe)
The pair is currently respecting an ascending channel, but price is reacting to a key resistance at 1.37600, indicating a potential short opportunity.
🔻 Sell Scenario:
If rejection holds, we could see a move toward the following technical targets:
📍 1st Target – 1.36000 (Demand Zone)
📍 2nd Target – 1.34000 (Demand Zone)
📍 3rd Target – 1.32500 (Bullish Order Block)
Stay sharp — structure remains bullish overall, but short-term corrections are in play!
---
📲 Like, Follow & Comment
💬 Drop your thoughts below & join us for more real-time trade setups and market insights!
#Forex #GBPUSD #PriceAction #TechnicalAnalysis #ForexSignals #LiviaTrades 😜

GBPUSD - trade - Market Structure GBPUSD - trade - Market Structure , this is a short trade, very clean setup, use risk and trade managment for best result
GU-Mon-30/06/25 TDA-Good support 1.37000&Good resistance 1.37500Analysis done directly on the chart
Follow for more, possible live trades update!
I often share my live trades in Tradingview public chat in London session, stay tuned!
The reality of life is that if you don't work for yourself,
you'll never achieve what you want.
Don't expect things to come, work for it, act on it.
Notice the difference between DOers and Dreamers.
Comment down below what do you think!
Active in London session!
Not financial advice, DYOR.
Market Flow Strategy
Mister Y


Exclusive: GBP/USD Swing Heist – Limited-Time Opportunity!🏴☠️ GBP/USD HEIST ALERT: Bullish Loot Grab Before the Cops Arrive! 🚨💰
🌟 Attention, Market Pirates & Profit Raiders! 🌟
"The vault is unlocked—time to swipe those pips!"
🔥 THIEF TRADING STRATEGY (Swing/Day) 🔥
Based on high-risk, high-reward technical & fundamental analysis, here’s the master plan to plunder GBP/USD ("The Cable")!
📈 ENTRY (Bullish Heist Zone)
"The vault is OPEN!" – Long at any price, but for precision:
Buy Limit orders preferred (15m-30m timeframe).
Pullback entries from recent swing lows/highs = sneakiest loot grab!
🛑 STOP LOSS (Escape Route)
Thief SL: Nearest swing low (4H chart).
Adjust based on: Risk tolerance, lot size, & number of orders.
"A good thief always has an exit plan!"
🎯 TARGETS
1.37500 (or escape early if the cops 🚓 (bearish traps) show up!).
Scalpers: Only long-side raids! Use trailing SL to lock profits.
💥 WHY THIS HEIST? (Bullish Momentum)
Technicals + Fundamentals align for a potential breakout.
Overbought? Risky? Yes—but the best loot is guarded!
📢 TRADING ALERT (News & Risk Mgmt)
Avoid new trades during high-impact news (volatility = police sirens!).
Trailing stops = Your getaway car. Protect profits!
🚀 BOOST THE HEIST!
💖 Hit "Like" & "Boost" to fuel our next raid!
💬 Comment your loot tally below!
"Stay sharp, thieves—see you at the next heist! 🤑🔥"
