USDIDR trade ideas
Chasing news to bet on marketA follower sent me this and asked if he can still LONG the USDIDR pair.
jakartaglobe.id
If we look at the weekly chart, we can see the first peak was in 1998, then 2020 and soon, possibly and most probably will hit the 17000 psychological level.
What happens after that ? I dunno, that is the truth. If it is certain to go to 20,000 or more, then I would sell my organs and bet big on it. Forex is a trillion dollars market and many factors can affects its price movements and I do not have vested interest (properties, stocks in Indonesia) that requires me to hedge my positions.
In short, the LONG days are around 2011 to 2014 period, if not earlier. Of course, I am looking at hindsight based on this chart pattern.
Would I long if you put a gun on my head? No, the risk reward ratio is too negligible. When you learn to manage your risk, the returns are easier to assess, in this case, it could retrace to 15000 price level and goes sideways before rallying again. That means, unnecessary risk + unnecessary funds tied in this position. Move on to other better propositions. If there is NONE, relax and chill, the market always offers you opportunities, just need to be on the lookout.
USDIDR - Short Opportunity from resistance zonePEPPERSTONE:USDIDR is testing a significant resistance zone that has consistently reversed bullish trends into bearish moves. The recent bullish push into this area suggests potential selling opportunities.
I personally anticipate a move toward 16,215.2.
On the other hand, a break above this resistance could indicate a shift in sentiment.
Traders should monitor this zone closely and wait for confirmation before entering short positions. If you have any thoughts on this setup or additional insights, drop them in the comments!
USD/IDR Flirts with Key Weekly Resistance Amid VolatilityThe Indonesian Rupiah (IDR) is currently at a critical juncture, with technical indicators suggesting potential upside for the USD/IDR exchange rate, while fundamental factors introduce significant uncertainties. A recent technical breakout points to a bullish trend; however, economic policies, global trade dynamics, and geopolitical developments present potential headwinds.
Technical Analysis: Ascending Triangle Breakout
On the weekly timeframe, the USD/IDR chart has exhibited a significant technical development. After a period of consolidation, the pair formed an ascending triangle pattern, characterized by a horizontal resistance line around the 16,263 level and an ascending trendline connecting successive lows.
It's important to note that breakouts often experience volatility, and it may be prudent to set a stop-loss order to protect against false breakouts.
The Ascending Triangle Formation
Over the course of several years, the USD/IDR chart has formed an ascending triangle pattern. This pattern is characterized by:
Horizontal Resistance: A flat resistance line, around the 16,263 IDR level. This line marks the upper bound of the price consolidation, indicating that the price has had trouble moving above this level on previous attempts.
Ascending Trendline: A rising trendline connecting successive lows. This line indicates an underlying upward pressure on the price, with each subsequent low being higher than the previous one.
These two components together create the ascending triangle shape, with the resistance line forming a flat top, and the trendline forming the rising base. This is a bullish continuation pattern, which typically resolves itself by breaking upwards.
Waiting for Breakout Confirmation
The USD/IDR pair is currently in a holding pattern, awaiting confirmation of a breakout above the horizontal resistance level. If the current candle closes decisively above the resistance, which is approximately at 16,850 IDR, it would signal a confirmed breakout. This development could pave the way for bullish momentum to overpower the resistance, potentially triggering a strong upward trend.
Implications of the Breakout
Bullish Momentum: The breakout signals a potential shift in momentum towards the bulls. The previously stagnant trading range has been broken, and the market is now expecting the pair to move higher.
Pattern Projection: Ascending triangle breakouts often project a potential price target. A common way to estimate this target is to measure the vertical height of the base of the triangle (the widest part of the triangle) and project that distance upward from the point of breakout. In this case, this method would give a long-term price projection.
Increased Volatility: Breakouts are generally accompanied by increased volatility as the market adapts to the new trend. The recent trading range which has been seen is now broken and the price is expected to trend upwards in a less volatile manner.
Fundamental Analysis
Bank Indonesia's Monetary Policy
On January 15, 2025, BI unexpectedly reduced its benchmark 7-day reverse repurchase rate by 25 basis points to 5.75%, marking the first cut since September 2024. This decision aims to stimulate economic growth amid global uncertainties and a low inflation outlook. However, the rate cut led to the Rupiah depreciating to a six-month low, reflecting market concerns about potential capital outflows and currency stability.
National Debt Obligations
In 2025, Indonesia faces substantial debt servicing responsibilities, with approximately Rp 800 trillion of central government debt maturing. This includes Rp 705 trillion in Government Securities (SBN) and Rp 95 trillion in loans from bilateral, multilateral, and commercial sources. The significant debt repayment obligations may limit fiscal flexibility, necessitating prudent financial management to maintain economic stability.
Domestic Economic Growth
The Indonesian government has set an economic growth target of 5.2% for 2025, consistent with its 2024 goal. International organizations offer similar projections, with the International Monetary Fund (IMF) estimating growth at 5.1%. Despite these optimistic forecasts, BI's recent rate cut indicates concerns over weaker-than-expected economic performance in late 2024, highlighting the need for policies that bolster domestic consumption and investment.
These factors collectively impact the Rupiah's performance, underscoring the importance of vigilant economic monitoring and responsive policy measures to navigate the challenges ahead.
Disclaimer: This is not a financial advisor. This analysis is purely for informational purposes and should not be considered as investment advice. Trading involves risk, and you should consult with a financial professional before making any decisions.
USDIDR Buy On WeaknessThis chart shows the USD/IDR pair (U.S. Dollar/Indonesian Rupiah) on a weekly timeframe. Below is the analysis based on the visible trend lines, price action, and channels:
1. Ascending Channel:
The chart illustrates a clear upward channel that has been maintained since 2017, suggesting a long-term bullish trend in the USDIDR pair.
The price has bounced from the lower bound of the channel, which indicates that the support line around the 15,200 region is holding well.
2. Support and Resistance:
Support: The price is currently hovering around 15,459. The nearest strong support zone is at 15,200 as it coincides with both historical price levels and the lower bound of the upward channel.
Resistance: There are several resistance levels ahead:
16,400 (the dotted line): This seems to be a mid-level resistance line within the channel.
16,600: This appears to be the next major resistance, as indicated by the chart and could represent a key decision zone.
3. Possible Future Movement:
The chart suggests a bullish bias in the future, as indicated by the projected zigzag path. The price is expected to bounce between resistance and support lines before possibly reaching towards the upper boundary of the channel near 16,600.
Short-term correction: Before further bullish movement, the price might dip slightly towards the 15,400 or 15,200 support levels.
4. Long-Term Outlook:
The price trend continues to suggest an upward movement in the long term, as the channel is clearly moving upwards. A breakout above the 16,400–16,600 resistance zone could accelerate the USDIDR towards new highs.
Conclusion :
Bullish Outlook: The USDIDR seems to be in a long-term bullish channel. After potentially testing support at 15,200, the price may resume its upward trajectory, targeting 16,400 and possibly 16,600 in the coming months.
Trade Like A Sniper - Episode 41 - USDIDR - (13th June 2024)This video is part of a video series where I backtest a specific asset using the TradingView Replay function, and perform a top-down analysis using ICT's Concepts in order to frame ONE high-probability setup. I choose a random point of time to replay, and begin to work my way down the timeframes. Trading like a sniper is not about entries with no drawdown. It is about careful planning, discipline, and taking your shot at the right time in the best of conditions.
A couple of things to note:
- I cannot see news events.
- I cannot change timeframes without affecting my bias due to higher-timeframe candles revealing its entire range.
- I cannot go to a very low timeframe due to the limit in amount of replayed candlesticks
In this session I will be analyzing USDIDR, starting from the 3-Month chart.
If you want to learn more, check out my TradingView profile.
Targeting Sub 15200 IDR with Potential for 15600 IDR - 15700 IDRBased on my analysis of the USIDR chart, I have observed a V bottom formation in the weekly timeframe, suggesting a potential bullish trend in the near future. Currently, the price is trading just above the neckline, indicating a possible short-term retest towards sub-15200 IDR levels.
However, with a target range between 15600 IDR - 15700 IDR, there could be potential gains for traders who decide to enter into a long position. As with any trading strategy, it's important to exercise caution and perform your own due diligence before making any decisions.
Indonesia Rupiah vs Dollar USDIf we see here, USD has gain momentum to breakout the IDR resistance that holding USD value not over 14.600, since ending 2020 and beginning 2021, only once tested in 14 Apr 2021.
But, now we can see that Resistance has broken and USD seems to test the ATH in 2020 around 14.975, when we know due covid and stock market is super volatile.
If USD broke the 14.975, we can see quick pump to 2018 ATH around 15.200, where we know theres also market crash in 2018, this is similar where we see at the time, the FED is increasing rate to 2%, and currently FED is already increasing rates to 1.75%.
We should prepare if this is happening, could cause investment in Indonesia to be slow and growth due dependency with other country and food crisis is currently happening.
Be safe and manage money risk management to ensure to be stay liquid at times like this.
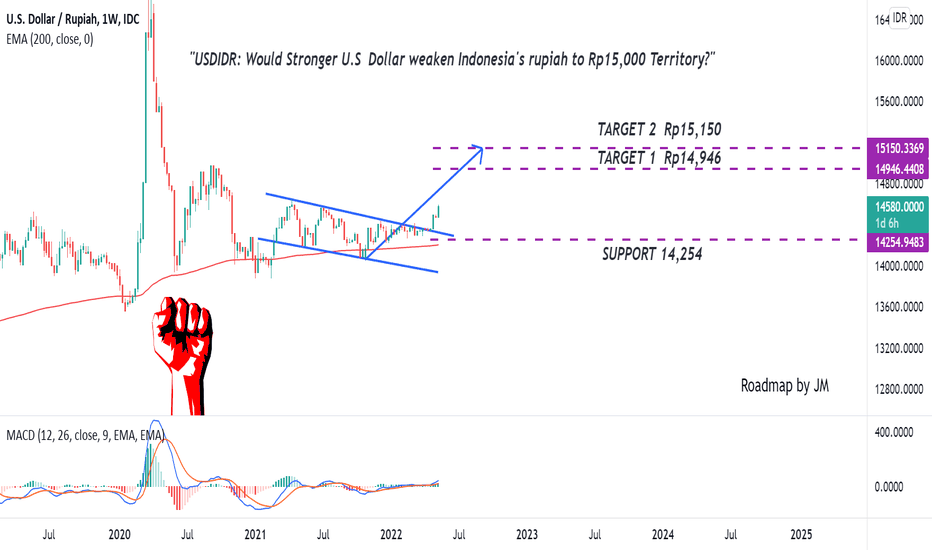
Would Stronger Dollar Weaken Indonesia's rupiah to Rp15,000?The inflation rate has reached above 8% territory in the U.S. Higher Inflation Rate forced the Fed to raise the interest rate again by 50 basis points in May 2022 and it seems the Fed will remain hawkish for stabilizing inflation to a more normalized level. Commonly, the Increasing interest rate will make a stronger dollar because it will attract investment capital from investors abroad seeking higher returns on bonds and interest-rate products. Therefore, a bullish/Stronger Dollar outlook might prevail and potentially weakens Indonesia's Rupiah.
From Chart Perspective:
USD/IDR is moving above the Exponential moving average of 200, which means a bullish bias. Recently, The pair has broken out of the falling wedge pattern, accompanied by a golden cross in the MACD indicator. it signifies a potential bullish bias to the target area.
Smash the Follow and Give us Thumbs up for More Educational content!
* Disclaimer: This is for educational purposes only, We are not responsible for any of your financial decision.
Sharing Trading ContestGood morning,
I am one of the new traders in Indonesia, I use Maxco broker.
That morning my phone rang, a Maxco salesman who had been helping me provide daily market information told me that they were collaborating with a trading platform called FOLLOWME,
I'm not interested because I think I have to open a new investment there, and have to make a deposit,
I am very careful in trading and of course because I am a beginner it seems that having 1 broker is better.
but this sales said about Trading CONTEST, I'm a bit interested after hearing that word
This Trading Contest is held on FOLLOWME and you only need to connect an account, for fun the prize is a hefty $1000.
I think there's no harm in trying, even if I fail it won't hurt me, I just need to connect my account and trade as usual, FOLLOWME doesn't give any missions
they will only take data from the trades that we do and then compare with other traders. I don't think this will be a waste of my time, and why not?
10 STEPS TO BECOMING A SUCCESSFUL FOREX TRADERForex is simply a battle with the next person, if you predict the right thing, you win. The profitability in this industry is mind blowing. These 10 points I would list below would ensure that you become a successful forex trader.
1. DEVELOP THE RIGHT SKILLS
· Diligence : You CAN Achieve anything by not being of lazy, you Should the know by now! Just That. In the case of forex, diligence comes in when it is time to make transactions. When making transactions, you do not want to put your money into anything that you have not made prior research on. You should be able to make your research and find the good and bad parts of any deal before putting your money into it.
· Good Research Skills: Going further on the first point, good research skills are vital. You see that a currency has been doing well and is on the rise now, and you feel it is time to cash in your chips. Good research skills, gives you the ability to find the reason for the value fluctuation from different sources.
· Good with Numbers: the Forex deals with numbers, graphs and charts to show For you the Different currency patterns. You should be able to understand this easily in order to be a better forex trader
· Discipline: There are some Transactions That you may have ENTERED Into and for the first couple of trades, the make you profits and the then you start to Lose. But you keep trying and trying until all the profits you made go down the drain. Many traders fall into this situation, time and time again. Before you enter into a transaction, it is important that you have a plan. Come up with trading strategies that you would stick to no matter what. After every transaction, try to record it down in a book, to keep you in line.
2. EDUCATE YOURSELF ABOUT FOREX
The forex market is always changing and every day, there are new patterns. There are really no set of rules controlling the forex market to succeed, you need to be open minded to new information.
There are basically two ways to keep you current about the latest changes. You can either learn from an online course or through a Foreign Exchange consultant .
Your aim should be able to talk about charts, graphs, ratios, trading options and profitable pairs proficiently.
3.START SMALL
Following such means would cost you lots of money and would make you really miserable. Rome wasn't built in a day, so do not expert that your forex trading career would boom in one day.
Open a micro account, then write down how much you can risk losing in a journal and stick to it. This is where your discipline comes in; ensure that you do not make trades based on greed, fear, and biases. As you gain more experience, you can begin to increase the size of transactions you enter into.
4.START WITH A DEMO ACCOUNT
You would also be able to test different trading strategies and taking on transactions without having to lose personal funds.
5.FIND A TRADING EXPERT
This trading expert would keep you safe from negative balance situations and would let you in on competitive trading options. Having this expert at your side is very vital to your success in the Forex trading industry.
6.TRADE WITH A STRATEGY AND STICK TO IT
Your strategy should keep developing and getting better from time to time with the market; the deeper your knowledge, the better your strategy gets.
Decisions about making profits in the short term or long term should be identified in your strategy. Many beginners make one common mistake of jumping from one strategy to another, searching for the next best thing; the secret that many traders do not understand is, no strategy works 100% of the time.
7.DO NOT BE AFRAID OF LOSSES
Being scared of losses would make you scared of going into traders which would keep you failing continuously. You have to be okay with the fact that you can lose everything you can in the trading business. It is all part of the process.
8.KEEP YOUR EMOTIONS ASIDE
There are some cases where you would not want to follow your strategies because of fear or the urge to win back your losses because you may have been on a losing streak. Kill that urge to go into trades without your strategy.
If you cannot put these emotions away, you would have a hard time as a forex trader
9.MAINTAIN A LOW RISK PER TRADE MARGIN
The type of trader you are should affect density of the risk you put in per trade. You do not want to be risking big per transaction. It is not a good strategy to use.
Try to enter into high reward-low risk trades at all times. Your risk margin should not be more than 2% at any point.
10.USE STOP-LOSSES
You can set your stop-losses based on market conditions because you never really know what the market will bring on specific days.
11.KEEP PRACTICING
ou would be better at trusting your strategies and not be controlled by your emotions.
In conclusion, if you do not have so much time to do trading by yourself and still want to maintain profit. Getting a Forex Robot that would do your trading for you. Forex Robots is a top notch technology for foreign exchange. It helps ensure that you make profits from trades.
Best Ways to Learn Technical AnalysisKEY TAKEAWAYS
Technical analysis is the study of charts and patterns, but can also include aspects of behavioral economics and risk management.
Novice traders can turn to books and online courses to learn about technical analysis.
Many online trading courses promise spectacular results and use high-pressure sales tactics, but then fail to deliver the promised results.
Simulated or "paper" trading can help traders see how technical indicators work in live markets.
1. Build a Foundation
The first step in learning technical analysis is gaining a fundamental understanding of the core concepts, which is best accomplished by reading books, taking online or offline courses, or reading through educational websites covering these topics. Many of these resources are free, but some educators, workshops, or courses charge a fee
2. Practice and Develop Your Skills
Traders developing automated trading systems can use backtesting to see how a set of rules would have performed using historical data. For example, a trader might develop a moving average crossover strategy that generates a buy signal when a short-term moving average crosses above a long-term moving average and vice versa. The trader could then backtest the system to see how it would have performed over the past several years.
What Is Technical Analysis?
In the financial markets, technical analysis is the study of behavioral economics, risk management and trends, all of which can be applied to trading. It involves using price action to make predictions about future stock movements.
How Does Technical Analysis Work?
Traders use technical charts to assess a stock or index's strengths and weaknesses, price action, trends, and volume. Through this process, traders can predict stock movement, typically in the short-term
What Are Some of the Best Technical Analysis Courses?
The overall best technical analysis course, as determined by Investopedia, is through Udemy, but other highly-ranked ones include Bullish Bears, and The Chart Guys.
The Bottom Line
The best way to learn technical analysis is to gain a solid understanding of the core principles and then apply that knowledge via backtesting or paper trading.
Learn the Basics of Trading and Investing
Looking to learn more about trading and investing? No matter your learning style, there are more than enough courses to get you started. With Udemy, you’ll be able to choose courses taught by real-world experts and learn at your own pace, with lifetime access on mobile and desktop. You’ll also be able to master the basics of day trading, option spreads, and more. Find out more about Udemy and get started today.
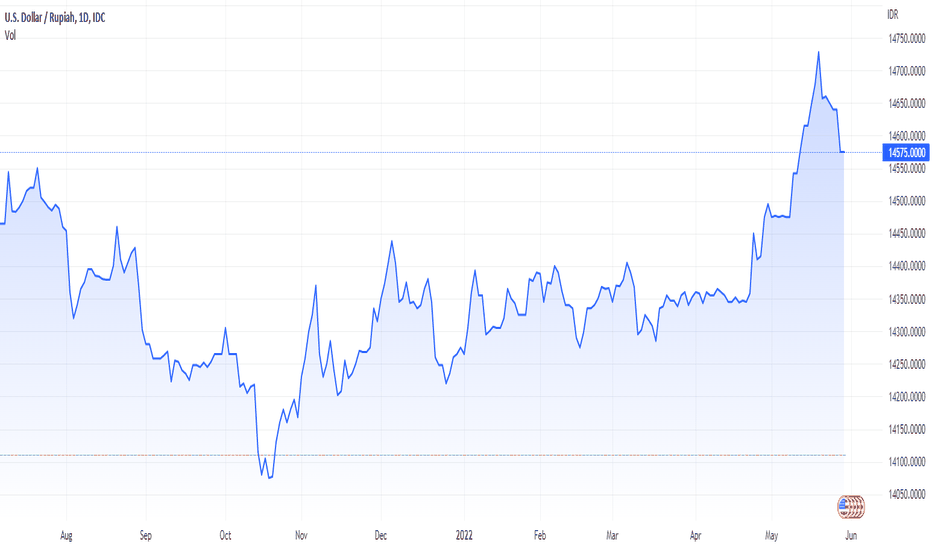
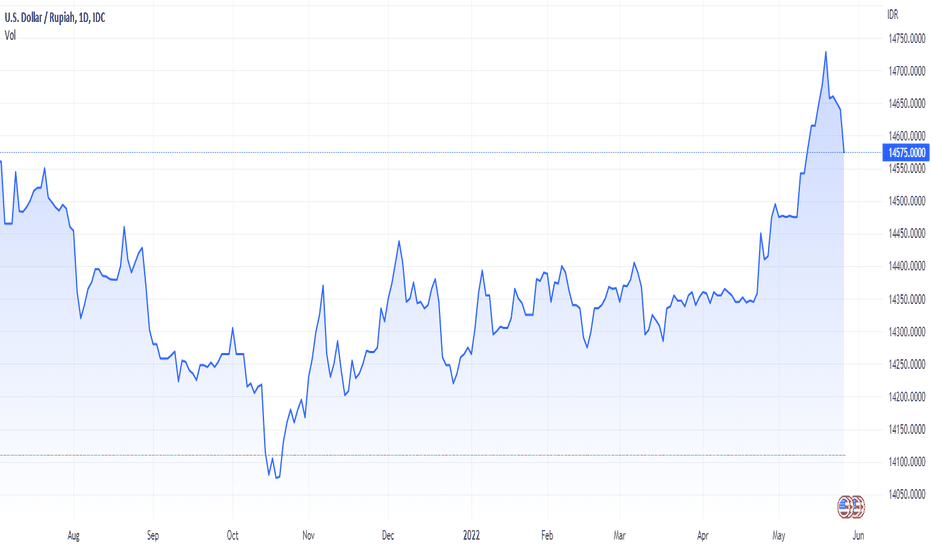
USDIDR 19th APRIL 2022Rupiah tends to move flat despite the strengthening of the US dollar against major currencies. In addition, the demand for the dollar has increased, and the demand for other safe haven assets has also increased, as indicated by the increase in gold prices and also followed by an increase in the yield of the US Treasury to the level of 2.88%. In addition, the release of Indonesia's trade balance data as of March 2022 recorded a surplus of US$ 4.53 billion, wherein March's export performance was the highest in history, which also limited the weakening of rupiah.
Rupiah will strengthen in a limited range of Rp.14,000 - Rp.14,700 per USD.
Bullish Bias on USDIDRIndonesia rupiah would like to weakening since we've got a pennant pattern on this market as their bullish continuation signal. Buy on break should be your consideration with the supply area as price target and 14300 as a bullish invalidation if the price goes down and close below it
USD losing its value!!!Well... as I charted before (months ago), we will see a break down of USD, but still, if U zoom it out, it still in the up-trend!!!
My worst-case level for USD-IDR pair would be at 14,000 which align with my trending up blue line!!!
It may not even reach that point, as USD itself has many supports line before breaks and touch the 14,000 area!!!
#not financial advice
#Personal View
USD IDR Chart AnalysisLooking at the prospect of current economic situation for both the US and Indonesia, I believe there is still room for an uptrend in coming years as shown in the chart before a break to the downside in the coming future (probably will take years). #not Financial advise #Trade at your own risk
USD to lose its valueWith the trillions of USD being printed in the last 1 or so year since the pandemic, it is only a matter of time before everyone realize USD is simply made out of thin air and given for free for everyone, somehow US are able to fund everything and grow beyond your wildest dream even in pandemic simply by printing and printing and printing... It will soon lose its value as people who understands economics will think "wait a minute... did you just pump so much dollar that Money Supply simply quadruple in a year? this is BS". The only way for this not to happen is if Indonesia government decide to manipulate the market, and devalue its currency over and over again, which would only make matters worse when USD ponzi-scheme bubble pops


