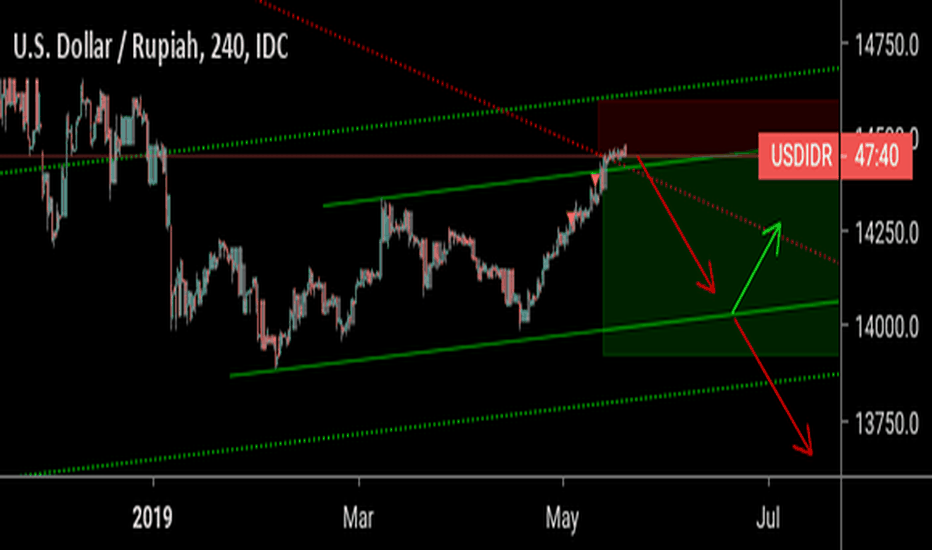
USDIDR coming weeks ahead to 148xxBased on technical analysis, ABCD pattern may formed to lead the USDIDR to 148xx. Longby investing4livinPublished 112
USDIDR To the MoonAfter following the temporary uptrend and counter downtrend, Rupiah will still face heavy pressure on trade deficit, China-USA Trade War & Uncertainty in the nation's economic outlook specifically on the FDI policy.Longby ArnaldoGunawanPublished 1
Rupiah is in Hazardous RoadFX_IDC:USDIDR I predict Rupiah (USDIDR) might keep depreciating to more than Rp14,300/USD. If Rupiah Breakout Resistance (Rp14,300/USD), then the possibility of Rupiah strengthening to Rp13,600/USD or any level below Rp14,000/USD is vanished. Rupiah will be on the verge to keep weakening to its lowest level at Rp15,300/USD. Rupiah must move below Rp14,000/USD in the next 1-2 weeks to shrink any threats that make Rupiah might keep decreasing to Psychology level at Rp15,000/USD. Longby mmdchartsUpdated 1
USDIDR should rise to Rp14,900/USD, deeper depreciationUSDIDR could move to Rp14,900/USD after finishing consolidating around Rp14,300 - Rp14,400 for almost a month. By moving above Rp14,000, USDIDR is continuing "Uptrend" to at least Rp14,900 (above highest level at Jokowi's administration at Rp14,800). The depreciation this time might as well bring Rupiah to touch Rp15,000/USD.Shortby mmdchartsUpdated 4
USDIDR's weakness will last as Yuan in depreciation modeUSDIDR could and might touch Rp14,800, highest level during President Joko Widodo administration. There is a possibility Rupiah go beyond Rp14,800 and reach Rp15,000 but i predict it won't happen since Rp14,800 should be a strong psychology Resistance. However, Rupiah should move within a range of Rp14,300 - Rp14,600 for the rest of 2018. Rupiah should appreciate below Rp14,200 to open possibility of strengthening below Rp13,xxx again.Shortby mmdchartsUpdated 1
MARKET DECIDED TO GO UP FINDING THE NEXT DECISION POINT AREAMARKET DECIDED TO GO UP TO FINDING THE NEXT DECISION POINT AREALongby erdyyudantoPublished 3
USDIDR Points Towards Continuation of WeaknessThe USDIDR also trends with its peers in Singapore and Thailand for continued downward movement. Although weakness in the past week is showing weaker signals in RSI and the bull bear crowd sentiment indicator, nearly all exponential moving averages suggest further continuation of the trend. In spite of this, price action is fast approaching a 2018 trend line which could reappear as long-term support and a reversal, although this is not likely to come to fruition for a number of trading days unless volatility really picks up. If you would like to see more charts check out www.tradingview.com or if you want more analysis go to www.linkedin.comShortby WhiskeyTangoFoxtrot3Published 3
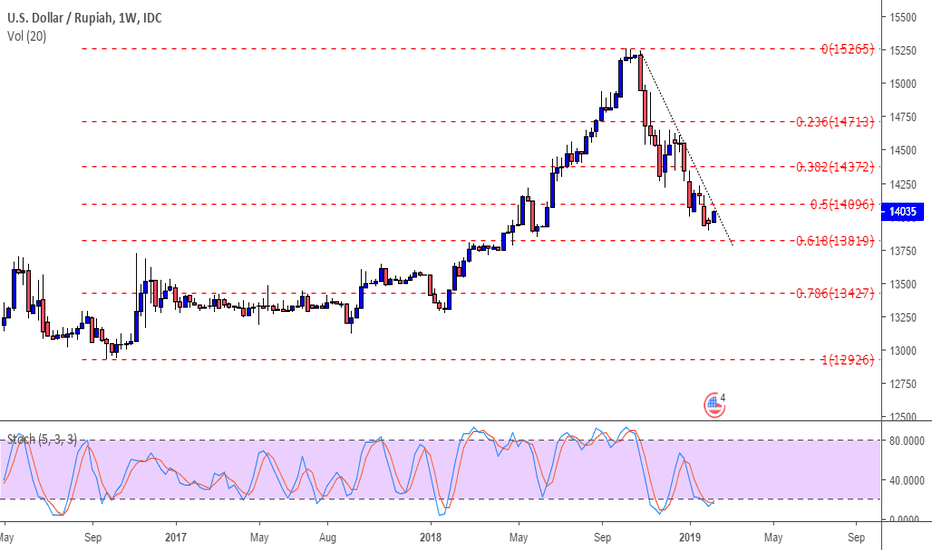
USDIDR retracement supportUSDIDR weekly support fibonacci retracement 61.8% at area 13.827. most likely price will rebound from this area at tested closest resistance14096.by LindaLeePublished 1
My analysis of Indonesian RupiahIndonesian Rupiah is doing well since late 2018, but base on my technical analysis there are a chance for Rupiah lose its strength near the resistance 13,846 and getting weaker in the next couple weeks. You can enter to buy USDIDR after breakout in fibo 0.618.Longby reza.ade.fUpdated 1
#USDIDR. Trend is your friendAfter many days of correction. USD looks like want to show her power for continuation. Don't forget! trend is your friend. RSI Oversold, & Bullish divergence just showedby UnknownUnicorn2708348Published 0
USD / IDR time for a correction - because everything correctsThis is 100% technical analysis and 0% fundamental analyis. I would like to see for myself if TA can stand on its own. By my count there is some strong bearish divergence shown on the RSI. Three higher highs have translated to lower highs on the RSI, indicating slowing momentum. When that slowing momentum is also coincident with what seems to be (I only spent 5 mins on it) wave 5 of 5. Since this is the first time I have looked up the currency pair on a technical chart it would be unlikely that I did so "at the top" but right now it is a plausible scenaro. Saying that I would normally expect wave 5 to at least reach the top of the channel, and of course, normally top the wave 3 high as well. However, it seems a real posibility that it will fall short. The IDR has been weakening for years and a correction may be warranted - especially if the USD loses strength. What will happen now is the start of a small correction (to start with to the lower trend line) but keep an eye on signs that the correction may be steeper or deeper. If the lower trend-line is broken with momentum and volume I would stay in the short trade. Because wave 5 (if it turns out to be the wave 5 top) is truncated (lower) it would indicate there is significant downward pressure and the correction could be swift. My other scenario is a lot more bullish; that this is just sub-wave 1 of the larger degree 5th wave up. This would mean all time highs for IDR in a year or two. I am not "trading" IDR but keeping an eye on it. I don't trade FOREX - mainly commodities like bitcoin, silver, gold, and crude. This is published for my own education. Comments welcome. Let's see how it turns out.Shortby flyinkiwi10Updated 222
USDIDR AnalysisUSDIDR Sharp movement since 2013, No sign of reversal yet, possible to reach 15800Longby ivangunawan56Published 2