USDINR - Reposting 1st May Chart for Study purposeDate: 26-05-2025
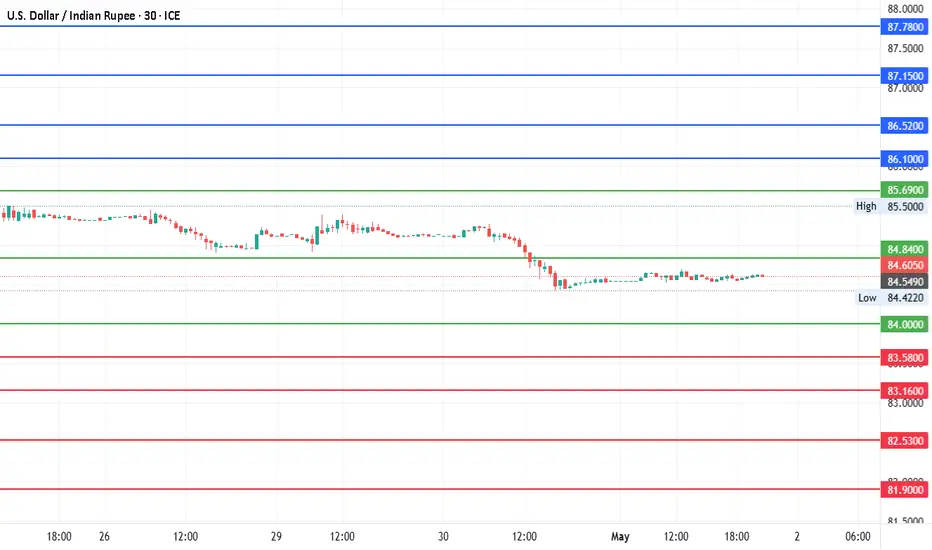
#USDINR - Reposting 1st May Chart for Study purpose and to see how the levels are behaving between the resistance and support. We should also note that the movement was between downside target 1 and upside target 1 (86.10) with precision.
The old levels remain the same and the levels are given below.
Upside: 86.10, 86.52, 87.15 and 87.78
Downside: 83.58, 83.16, 82.53 and 81.90
The green lines mark the range with resistance and support.
Let me know your thoughts and observations if any.
USDINR trade ideas

USDINR - Ready for 2.5 points moveCurrent Price: 84.6050
Upside: 86.10, 86.52, 87.15 and 87.78
Downside: 83.58, 83.16, 82.53 and 81.90
Green lines represent the support and resistance levels.
USD / INR - 2025 & 2026 will decide the path3M candle (Q1 2025) printed a bearish signal with a top at $88.
Structure looks weak for now, a break below this candle could confirm a bearish shift.
DXY is cooling off due to a dovish Fed outlook, easing inflation, and broader macro rotation into risk assets. If the 100–102 zone breaks, expect extended downside which could support INR, gold, crypto, and other non-USD assets.
First Support - $63.64

USDINR looks good at this levelsA close above 86.35 can go upto 88.35 levels in short term about a week or so with a stoploss of 84.90 levels.
Chart showing some strength #usdinr

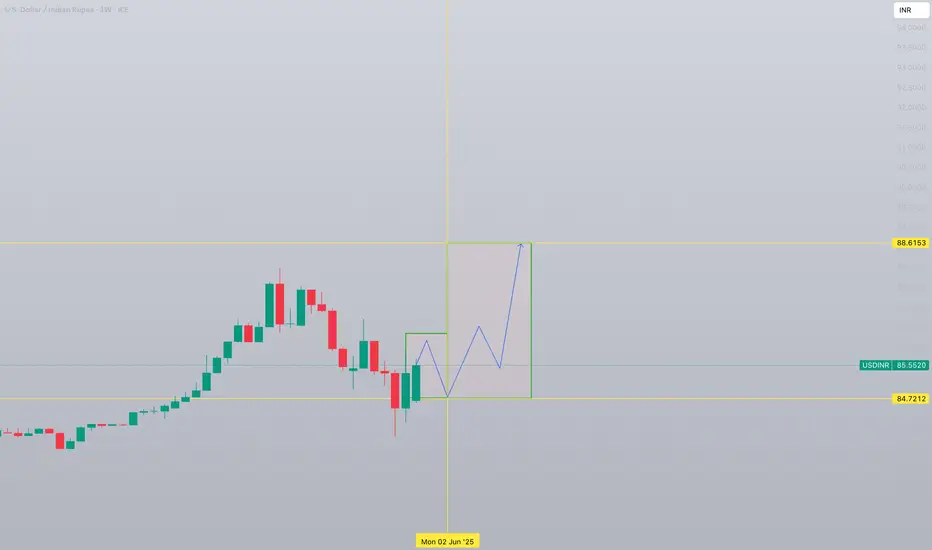
USD/INR 1W forecast until August 2025US Dollar has shown bottom and formed a reversal formation. Current growth will not last long and will find its top at 86.1487 with possible slight overshoot in the second half of May 2025.
This will be followed by second bottoming at 84.7212 in the beginning of June 2025.
Double bottom formation will complete inverted Head&Shoulders and start bullish trend:
- major breakout in the end of June 2025
- with consecutive retest of 85.43 in July 2025
Starting from this level/moment USD will rise fast upto 88.6
INR has made a major top against USDFall of INR against the USD began in early 1970s, or perhaps late 1960s--we don't know for sure for lack of trading data. Since then, it has depreciated against the USD in crystal-clear 5 legs, or waves according to Elliott Wave Theory (EWT). To validate EWT, there occurred a gigantic gap of 9.23% in July 1991 where third wave is supposed to be--a hallmark of third waves. Furthermore, there's even a divergence between Price and Elliott Wave Oscillator (5/35 MACD) on the Monthly chart--typical of fifth waves.
So, what's next then? Considering the time frame of the entire price move till date, I would say that a bear wave of Supercycle degree has just ended and we are looking at a 10-15 year advance in Indian Rupee against the US Dollar . In support of my forecast, INR has just posted a beautiful, unambiguous 5-wave advance in the shape of an expanding diagonal--hallmark of first waves--from 87.972 to 83.7625.
If I'm right, price should retreat a bit toward the classic 61.8% level at 86.3396, and then fall hard--and I mean very hard, with a gap--toward the levels below 80, followed by another pause and a small retreat, and another fall, thereby completing a set of 5 distinct waves . Should price follow the path of my forecast to that point, we would have a definite confirmation on hand that a Supercycle bear wave has indeed ended.
The final target of this Supercycle bull wave of INR vs. USD? It's too early and too far ahead to hazard a guess, but as per EWT principles, it should be somewhere close to 44. Yes. 1$ = ₹44. I hope I live to see that day. It's going to take a while, till 2040 perhaps, but we'll get there alright.

USDINR + LuxAlgo Sequencer + GAN SQ 9 + CANDLES The LuxAlgo Sequencer is a indicator that is able to highlight sequences of prices based on their relative position to past prices.
The red counts reaching to no 9 with a small red arrow pointing down is marked with a line which is the Bearish Preparation Phase . It indicates chances of the prices reversal . It is possible that the price could still have moved up yet in this chart it did not . The long shadow that recorded the peak had also provided some clue of prices reversing.
The Bearish Lead-Up line is the line where the bears come in control and the prices are expected to decline .
In the same sequence we observe that the green counts have the reading of number 9 with green arrow pointing up . It may be a early indication of dollar gaining some strength. One needs to note that the counts are probablilistic.
The GANN square of 9 provide a strong support line at 85.60 and a moderate resistance at 87.10 .
The small green candle is the day in progress and so the closing price will provide the estimate of the direction in which the pair moves next.

USDINR dropped below the 50 EMA, the first Time Since Oct,2024 😊 USDINR for the first time since October 2024, price has dropped below the 50 EMA , signaling potential weakness.😊
Watching price action closely! 📉

Indian market cannot go bullish until RUPEE becomes strong !a lot of analysts saying Dollar is going to week vs rupees but seeing technical chart, dollar is traded above 50 EMA and never come to touch since October. currently Dollar completed Symmetrical Pattern showing any upcoming momentum may happen, either bullish or bearish is just could say after seeing breakout/breakdown this pattern. To gain strength in Rupee it is required to give USDINR 50EMA breakdown or bearish crossover. Till then the rupee will remain weak and Indian stock market also.

USD is facing a Trendline resistance Vs INRUSD is facing a trendline resistance Vs Indian Rupee. Support zone currently for USD is near 87.06 followed by 86.82. Below this level we have the Mother line support for USD. This mother line support is at 86.55. If that is broken by the slide in USD 86.36 or 86.13 levels. Final support for USD will be at 85.65 before it hits Father line at 85.02. Resistances for USD are at 87.41, 87.55 and 87.76 before it can hit all recent high of 87.97. Shadow of the candle right now for USD is negative. Huge volatility in USD on either sides can be expected as Trump Tariff announcements continue for few months.
Disclaimer: The above information is provided for educational purpose, analysis and paper trading only. Please don't treat this as a buy or sell recommendation for the stock or index. The Techno-Funda analysis is based on data that is more than 3 months old. Supports and Resistances are determined by historic past peaks and Valley in the chart. Many other indicators and patterns like EMA, RSI, MACD, Volumes, Fibonacci, parallel channel etc. use historic data which is 3 months or older cyclical points. There is no guarantee they will work in future as markets are highly volatile and swings in prices are also due to macro and micro factors based on actions taken by the company as well as region and global events. Equity investment is subject to risks. I or my clients or family members might have positions in the stocks that we mention in our educational posts. We will not be responsible for any Profit or loss that may occur due to any financial decision taken based on any data provided in this message. Do consult your investment advisor before taking any financial decisions. Stop losses should be an important part of any investment in equity.

$INRUSDback to where we had the bullish engulfing breakout with the rbi pumping in $2 billy
hold here pls same thesis as before with the dollar index have some relief with a tag of the 200 ema on the daily this pull back was expected
now we see if we sweep and reclaim white thick line or go from here .
obviously invalid with acceptance below white thick line by the end of week would like it above
.1153 IF not above yellow line and a reclaim of the 200 on H4

$INRUSDlooks like its time to come back to life
further to my dollar index post earlier
assuming top is in for it for the next 4 years at least this should make its way to the yellow line above
.012
let see bearish retest or it reclaims is
rsi cross below as well

USDINR Best sell signal you can find.The USDINR pair has been rising parabolically since the late September 2024 bottom. This rise has however most likely come to an end as the 1W RSI hit the top of its 16-year Resistance Zone.
This Zone has been holding since the October 2008 High and as you can see, it has offered 7 excellent sell signals. Most of those times, the rejection hit at least the 1W MA50 (blue trend-line), so if you are looking for a long-term short trade, you can consider this.
-------------------------------------------------------------------------------
** Please LIKE 👍, FOLLOW ✅, SHARE 🙌 and COMMENT ✍ if you enjoy this idea! Also share your ideas and charts in the comments section below! This is best way to keep it relevant, support us, keep the content here free and allow the idea to reach as many people as possible. **
-------------------------------------------------------------------------------
💸💸💸💸💸💸
👇 👇 👇 👇 👇 👇


USD/INR looking for a BreakoutFrom the chart, there is huge possibility of INR depreciating against US dollar. Bullish flag pattern have huge potential to go upside.

Dollar Vs INR: Dollar clearly Overbought as of now. Dollar Vs Rupee:
Dollar is at 87. Major breakout from the zone but one interesting point to note is the RSI. Relative Strength Index is above 90. Near 91 in fact. These are unsustainably overbought levels. We will see a proper deep correction there sooner than later. Once the Dollar starts to correct, Nifty will not remain bearish.
Anyone who understand RSI will tell you that Dollar is at unsustainable levels. India is the least effected compared to other currencies of emerging markets as well as developed nations. It is in the zone where sustaining itself that high will soon be impossible. That's why in the earlier message. I have written 1 to 4 weeks more pain for Indian markets.
Much also depends on policy announcements of Trump as he takes power. Back Channel diplomacy to avert further damage to India Inc., Might have already started...keeping my fingers crossed. Unreal times ahead. Long Term Vision For India looks unharmed. The dust will start settling in the next few weeks. We can expect dust to settle fully by end of this quarter. After which Bull run can recommence in my opinion.
Disclaimer: The above information is provided for educational purpose, analysis and paper trading only. Please don't treat this as a buy or sell recommendation for the stock or index. We do not guarantee any success in highly volatile market or otherwise. Stock market investment is subject to market risks which include global and regional risks. I or my clients might have positions in the stocks that we mention in our posts. We will not be responsible for any Profit or loss that may occur due to any financial decision taken based on any data provided in this message. Do consult your investment advisor before taking any financial decisions. Stop losses should be an important part of any investment in equity.

INRUSD - Indian Rupee Collapse UPDATEMy initial post on INRUSD was back on Sept 2022 more than 2 years ago.
My update is more of the same going forward. INR will continue to collapse despite its nominal economic growth.
When the economy is very small relative to its population, the growth rate doesn't matter as if a major economy like the US has similar growth. It's like comparing apples to oranges. But I certainly understand how people can be misled. That's why I am trying to explain it to you here today.

$INRUSDbeen a downward spiral for a while now expect this to do a final spike down assuming Dixie goes for 109 since i still feel its overextended
not trading this just interested to see how it plays out
If you have been following my DXY posts its at a key spot right now where it either teleports up and squeezes shorts or we send it to hades
was tempted to shave off some of my silver postion but shall hold for now and see what the new year brings us

1980-2002 USD dominance over INR mirrors 2024-20441980-2002: USD's HUGE DOMINANCE over INR 💵📈
2024 shows a similar setup. USD poised for a strong rally against INR.
Targets marked on the chart!

USDINR The 2-year Rising Wedge is holding.The USDINR pair continues to respect the Rising Wedge that we mentioned more than 2 months ago (July 24, see chart below), giving us both excellent buy and sell signals:
This 2-year Rising Wedge pattern is approaching its top (Higher Highs trend-line) once more so we're preparing for a sell signal again. The confirmation to sell within this pattern is given when the 1W RSI breaks above its MA line (yellow trend-line).
Our Target is 83.7500.
-------------------------------------------------------------------------------
** Please LIKE 👍, FOLLOW ✅, SHARE 🙌 and COMMENT ✍ if you enjoy this idea! Also share your ideas and charts in the comments section below! This is best way to keep it relevant, support us, keep the content here free and allow the idea to reach as many people as possible. **
-------------------------------------------------------------------------------
💸💸💸💸💸💸
👇 👇 👇 👇 👇 👇

Rising wedge breakdown in USD/INRAfter a long rising wedge formation in USD/INR in weekly chart, can see a good breakdown of the wedge, this implies a change in trend, the USD will depreciate and INR will appreciate.

Year long wedge- Chart patterns dont tell the whole storyIndian Rupee is on year long wedge formation
But its not strictly a technical pattern because INR is in dirty float meaning Central Bank manages its levels. Therefore the chart does not reflect the market participants view
Can't trade this kinda managed chart patterns

USDINR Bullish break-out signalThe USDINR pair broke this week above Resistance 1 (83.700), the long lasting level since the week of March 18 and following a strong rebound on the 1W MA50 (blue trend-line), the break-out should technically lead higher.
The long-term pattern remains a Rising Wedge and we expect at least a symmetrical +1.29% Bullish Leg to price the Higher High, similar to the March High. Our Target is 84.000.
-------------------------------------------------------------------------------
** Please LIKE 👍, FOLLOW ✅, SHARE 🙌 and COMMENT ✍ if you enjoy this idea! Also share your ideas and charts in the comments section below! This is best way to keep it relevant, support us, keep the content here free and allow the idea to reach as many people as possible. **
-------------------------------------------------------------------------------
💸💸💸💸💸💸
👇 👇 👇 👇 👇 👇
