Some basic chart patternIt is important to follow the chart pattern, it might give you the best entry and exit without the use of many indicators with higher chances of winning trades.
Look at the pattern I have drawn from the 1st of October 2021 to now, I hope this might help you in your analysis.
Thanks
Ravi Shankar
USDINR trade ideas

USDINR - 18Nov2021USDINR - 18Nov2021
On the H4 timeframe, prices faced bearish pressure from the descending trendline and dropped. Due to daily timeframe close below 50MA, prices are expected to drop lower to 1st Support at 74.1335.
This is for personal record purposes only, not financial advise or solicitation of trade.

USDINR - 17Nov2021USDINR - 17Nov2021
On the H4 timeframe, prices are facing bearish pressure from the descending trendline. Due to daily timeframe close below 50MA, prices are expected to drop lower to 1st Support at 74.1335.
This is for personal record purposes only, not financial advise or solicitation of trade.

USDINR - 16Nov2021USDINR - 16Nov2021
On the H4 timeframe, prices are facing bearish pressure from the descending trendline in which we could expect it to drop to1st Support at 74.1335.
This is for personal record purposes only, not financial advise or solicitation of trade.

USDINR - 15Nov2021USDINR - 15Nov2021
On the daily time frame, USDINR failed to continue its bullish momentum after a failed breakout 2 weeks ago. Last week price action also closed below 50MA indicating potential further downside.
On the H4 timeframe, prices have played out in the previous H&S perfectly. Now it is facing bearish pressure from the descending trendline in which we could expect it to drop to1st Support at 74.1335.
This is for personal record purposes only, not financial advise or solicitation of trade.

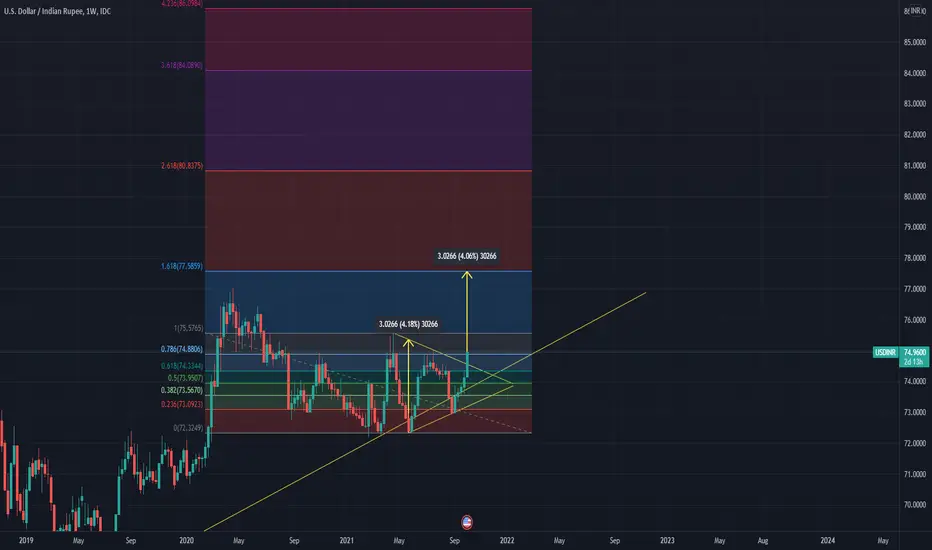
Exit from a triangleHi everyone! As I noticed earlier, it was necessary to wait for an exit from a triangle. And so now an exit from a triangle took place up. Therefore using length of the widest part of a triangle and also Fibonacci's stretching. We receive the purpose about 77.50.
Purchase at the current price.
TP = 77.50
Information provided is only educational and should not be used to take action in the market.
USDINR - 29Oct2021USDINR - 29Oct2021
On the H4 timeframe, price is still playing out h&s neckline in which it could face further bearish pressure to 1st Support at 74.5860.
This is for personal record purposes only, not financial advise or solicitation of trade.

USDINR - 28Oct2021USDINR - 28Oct2021
On the H4 timeframe, price is still below the h&s neckline in which it could face further bearish pressure to 1st Support at 74.6950. If price closes above the neckline, h&s will be invalidated.
This is for personal record purposes only, not financial advise or solicitation of trade.

USDINR - 27Oct2021USDINR - 27Oct2021
On the H4 timeframe, price faced bearish pressure from the resistance yesterday. H&S still in play, we could expect it to continue downside to 1st Support at 74.6950.
This is for personal record purposes only, not financial advise or solicitation of trade.

USDINR - 26Oct2021USDINR - 26Oct2021
On the H4 timeframe, price continued to bounce higher with limited upside. If price close above 1st Resistance at 75.1800 today, h&s will be invalidated.
For now, we could expect it to pull back to 1st Support at 74.695
This is for personal record purposes only, not financial advise or solicitation of trade.

USDINR - 25Oct2021USDINR - 25Oct2021
On the daily timeframe, USDINR finally bounced from 20EMA and 1st Support at 70.6950. It is now at previous breakdown area at 74.940.
On the H4 timeframe, price bounced back to the resistance level. It has now rebounded to neckline of h&s , price target around 74.075. For today, we could expect it to face bearish pressure and dropped back to 1st Support.
This is for personal record purposes only, not financial advise or solicitation of trade.

USDINR - 22Oct2021USDINR - 22Oct2021
On the H4 timeframe, price broke down from h&s , price target around 74.075.
For today, we could expect it to bounce back to 1st Resistance at 74.99 before dropping to 1st Support at 74.6950.
This is for personal record purposes only, not financial advise or solicitation of trade.

USDINR - 21Oct2021USDINR - 21Oct2021
On the H4 timeframe, price broke down from triangle pattern, price target at 74.075.
For today, we could expect it to bounce back to 1st Resistance at 74.99 before dropping to 1st Support at 74.6950.
This is for personal record purposes only, not financial advise or solicitation of trade.

USDINR - 20Oct2021USDINR - 20Oct2021
On the H4 timeframe, prices are consolidating sideways inside a triangle pattern. Need to wait out for which direction it will break out before determining the direction.
This is for personal record purposes only, not financial advise or solicitation of trade.

USDINR - 19Oct2021USDINR - 19Oct2021
On the H4 timeframe, prices faced bearish pressure just below 1st Resistance and dropped. With the DXY weakness, we can expect it to pullback to 1st Support at 74.695.
This is for personal record purposes only, not financial advise or solicitation of trade.

USDINR - 18Oct2021USDINR - 18Oct2021
On weekly timeframe, price broke out of descending trendline and swung towards 1st Resistance before pullback below 23.6% Fib retracement support but was not able to confirm above. We could expect a short-term bounce before a deeper pullback this week.
On the H4 timeframe, prices held support. We could expect a short-term bounce to 1st Resistance.
This is for personal record purposes only, not financial advise or solicitation of trade.


USDINR - 15Oct2021USDINR - 15Oct2021
Today is India Mahastra holiday.
On H4, price dropped to strong 1st support. We could expect a short-term bounce at this level.
This is for personal record purposes only, not financial advise or solicitation of trade.

USDINR - 14Oct2021USDINR - 14Oct2021
On H4, price dropped to support. We could expect further pullback on the USDINR to 1st Support today.
This is for personal record purposes only, not financial advise or solicitation of trade.

USDINR - 13Oct2021USDINR - 13Oct2021
On H4, USDINR swung towards strong 1st Resistance at 75.600. We could expect it to pullback to at least strong 2nd Support at 74.98.
Stochastic is also at resistance where previous drops occurred.
This is for personal record purposes only, not financial advise or solicitation of trade.

USDINR - 12Oct2021USDINR - 12Oct2021
On H4, USDINR continued to climb higher, however it should have limited upside. There is strong resistance at 75.60. Stochastic is also at resistance where previous drops occurred.
This is for personal record purposes only, not financial advise or solicitation of trade.

USDINR - 11Oct2021USDINR - 11Oct2021
On H4, USDINR bounced and closed above the major resistance of 75.12 at the last hour. This could be a bull trap as both H4 and H1 Stochastic and RSI indicating negative bearish divergence.
We could expect it to pull back to 1st Support before going much higher in the future.
This is for personal record purposes only, not financial advise or solicitation of trade.

USDINR - 08Oct2021USDINR - 08Oct2021
USDINR pulled back nicely yesterday, expecting to retest major 1st Resistance at 75.00. Will need to monitor closely whether price can close above.
Most likely will face bearish pressure today and break above 1st Resistance next week.
This is for personal record purposes only, not financial advise or solicitation of trade.
