USDINR trade ideas

USDINRLike the NIFTY 50 index, we are bullish on this pair, USDINR.
1. LL, HH formation
2. price actions above 21EMA
3. breakout of channel line, allowing buyers to buy on dips, nice.

USDINRValue of US dollar to rise...it could be corrective a-b-c or impulse wave 5 on downside, but in both the cases, bias would be up.


USDINR : Long term Elliott Wave ForecastAccording to my Elliott Wave count of USDINR, if I am correct ( being skeptical as EW count can be subjective, although all rules have been followed ) we are in minor wave A - of the Intermediate wave (3) - of the Primary wave 3 - of the Cycle wave V.
A Bulling engulfing formed on a Weekly chart suggests we have completed minor wave A , which is also a Fibonacci retracement up to 50% and the next target should be minor wave B for range Rs. 66 - Rs 66.24. (assuming it will be a Zig-Zag correction)
There after target for minor wave C target should be Rs 59 - 58.2944
I'll post more detail EW counts for the same.


Long on USD INR Expected rise in price after 7days period. The support near 64.550 region, making a pole pattern. Expected rise up to 65.22
for short term
Long term growth expected up to 66.45

LONG RUNWe will get a pull back from support zone and after that we will take a flight to the Take Profit zone. Trade Carefully :)


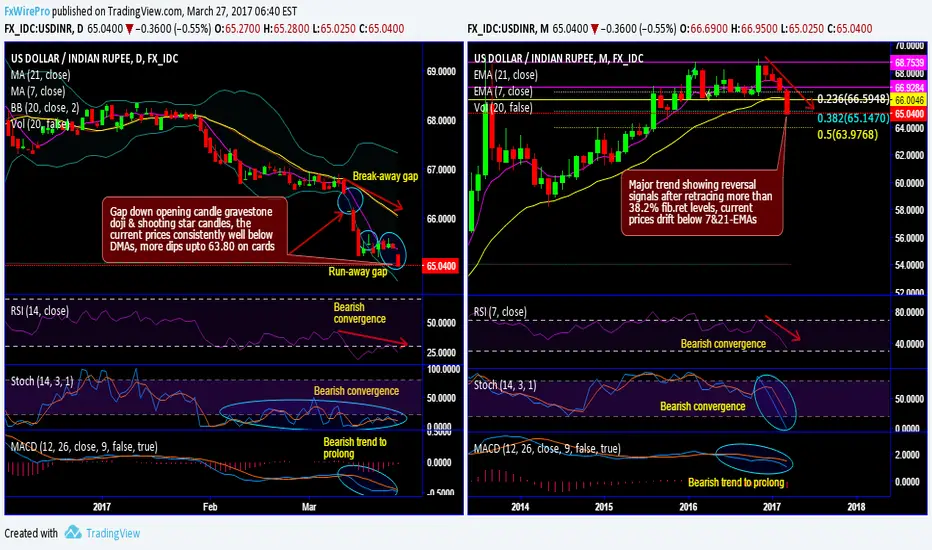
Is it trend reversal for USD/INR? Forms run-away gap Is it trend reversal for USD/INR? Forms runaway gap to break major supports:
The breakdown in USDINR continues with a renewed trending bias.
The break of the 67/66.55 support zone (Jan breakout/July TL) highlights the importance of Fibonacci retracement violations confirming a deeper corrective phase.
After break-away, run away gap at 65.2700 levels (refer daily charts): Gap down opening candle gravestone doji & shooting star candles, the current prices consistently well below DMAs, more dips upto 63.80 on cards.
The pair has edged lower at 65.0350 during European session sensing more weakness ahead and ended with a stern bearish candle with a big real body.
ON a broader perspective, the break out below 65.1470 (38.2% Fibonacci retracement levels) has indicated that more pullback is likely and bears are likely to resume their primary downtrend.
The current prices on this timeframe have drifted below 7&21-EMAs.
Most importantly, both leading and lagging oscillators are signaling more selling pressures with their bearish convergence to the ongoing price dips. Thereby, it seems that major trend of this pair turning into reversal phase.
Option Trade Tips:
USDINR vol-adjusted carry has jumped back to pre-tapering levels.
USDINR vol-adjusted carry has jumped back to pre-tapering levels.
So, dubious bulls on hedging grounds, earn carry through 1M USD put spreads.
Enter USDINR put spreads that offer pre-taper tantrum levels of vol-adjusted carry.
Earn carry through 2M USD put spreads.
USDINR longUSDINR 2 hour SPOT (and not Future) chart. If you look at longer term charts, the downmove in USDINR was corrective. It now looks like an ED type of pattern (Purple lines) with multiple divergences on MACD/Fisher. A test of 66.56 to 66.58 would complete the pattern.

SHORT USDINR, Free fall of @USDHappy to see INR covering some ground.
Will this free fall of @USD, will it test Yearly support line of 2016 of 66.5?

USDINR PoisedImmediate resistance: 68.15
Extreme resistance: 69.13
Immediate Support: 67.33
Extreme Support: 67.00

USDINR LongLast week USD showed weakness against other major currencies except INR (#USDOLLAR - Dollar Index).
Strange to see Indian currency not gaining against USD in-spite of good economy data.
Setup even indicates further depreciation in INR. Watch for breakout!

USDINR in 4hr trend channelhere 68.37/40 seems a key resistance, and can provide a stop for short trade towards 68/67.95


USD/INRUSD/INR PAIR seems to be in final stages of its amazing bull run...hope the pair will make a top in months to come and start a protracted long correction...Not advising shorts at present...let the complete run finish and then the pair can be shorted.


USDINR in Symmetrical Triangle- A break from immediate support arnd 66.33-35 and 66.25 (purple bottom line in triangle), can make Rupee bullish.
- And Immediate resistance of 66.92-98, can elevate USD towards 67.07/67.22/67.45 (which will incidentally be a 3rd top).
Presently has been in this Narrow range of 66.66/66.35 to 66.90/67.07 for almost a month


@USDINR testing upper bound of wage @USDINR testing upper bound of wage.
SHORT USDINR if resistance keeps it holding within the wage till Tuesday.

Educational 06: Gartley PatternIt is the second most important trading pattern in Harmonic Pattern series , called Gartley Pattern which is also frequently observed in markets. This post a second post of educational series related to Harmonic Patterns ,
In this post, I cover the following things regarding the pattern
1. Pattern Traits
2. Step by Step formation of the Pattern
3. Bullish Gartley Pattern measurements, labelling and targets
4. Bearish Gartley Pattern measurements, labelling and targets
5. Look of the pattern
Further to come in this Harmonic Pattern series , where I shall be discussing about the below patterns:
1. AB=CD Pattern (Completed) ----> Link below
2. Gartley Pattern (Present)
3. Cypher Pattern >>>>> Next
4. Bat Pattern (Coming up)
5. Butterfly Pattern (Coming up)
The best part of the above mentioned patterns that they can be used in all markets and at any time frame. It means you can use the patterns in stock markets, Forex , Commodities and at any time frame like hourly, daily, weekly etc. Therefore, they are important tools when analyzing the charts.
Purpose: To provide information to traders community that can help individual trader to learn more and take inform decisions while trading in order to generate consistent positive results.
Practice the above said chart pattern and share it below with us.
Thanks for the support,
Best Regards,
Neetesh Jain
