Range bound in 4H time frameDaily time frame took a support at the weekly support(Ascending triangle pattern).
4H timeframe the market is in range bound. The range bound has broke out, aggressive traders can consider to enter the marker, conservative traders may wait for the re-test and consider the swing.
USDINR trade ideas

POSITIVE MOOD FROM MOON LANDING SAVED INDIAN RUPEE, FOR NOWWe love sentimental trade ideas. There is nothing better trade than those stemming purely from sentiments. We shared timely long USDINR pair and we have attached the link below.
The positive sentiments from Moon landing drove INR higher yet on macro level, this changes NOTHING .
Congratulations to India and all Indians!
-Signalwyse Team

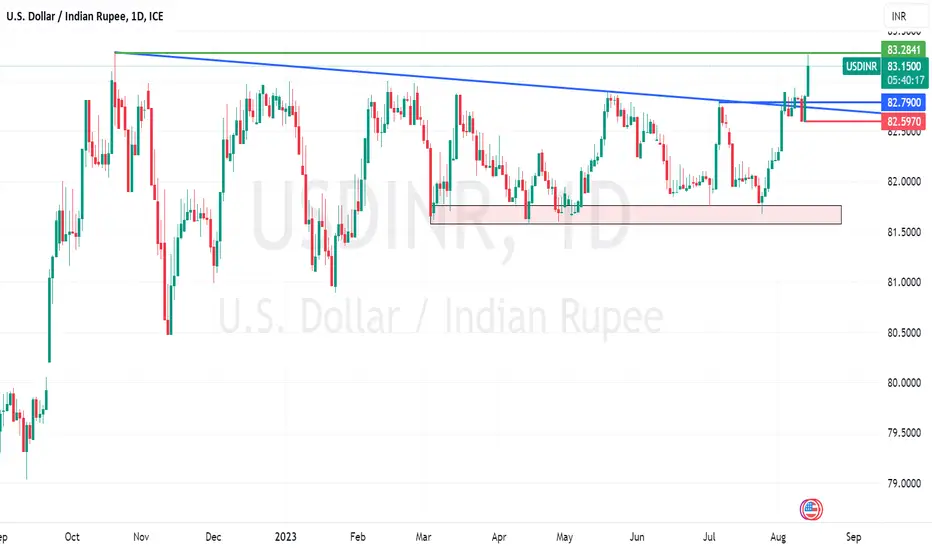
What's the next move ?The CMP(current market price) is at weekly resistance zone.
Below scenarios can happen:
1. Bear :: If a daily candle closes below 82.5920, advisable not to enter the market as the triangle is about to converge leading to triangle breakout & also the Risk: Reward ratio would be small.
2. Bull :: If a weekly closes above 83.2850, this is a ascending triangle breakout. The target for the weekly breakout will be 86.7317. This target will take time to reach.
Best advisable to add 1 or 2 lots in far out of the expiry(like 3 or 6 months far expiry after the breakout)

USDINR to drop to 75 levelsThis looks like a failed pennant breakout for USD. Very likely to see sharp reversals, next support is at Rs. 75 levels.

Bull swingDaily is in Bull trend, but at 4H time frame the market is in range bound.
If a 4H candle closes above 83.1575, then bull will be in control.
The risk : reward ratio is 1:2.68 to 1:3.58.

USDINR Indian Rupee Long TradeSome traders will buy straight up the pullback
back into the demand/support/break-out retest
area while others will wait for a potential Stop hunt
liquidity search of those traders and buy after that
happens. I always like the idea of waiting for confirmation
on smaller timeframes (1hr/4hr)....
What are you looking for?

USD breaks out against the Indian RupeeTypically the upside breakout of an ascending triangle will travel 1X to 2X in distance equal to the height of the triangle at its widest point. This would imply an advance toward 86 and possibly toward 88. $USD/INR. The best way to play this is with Singapore futures IMO


Double top neckline breakout In weekly the market is in Ascending triangle pattern. where the current market price is at weekly resistance.
In daily time frame there is change in trend(from bull to bear) formed by double top neckline breakout, so the market is expected to fall further till the weekly ascending trend line(support).
After the DT neckline breakout now the market is in retest, a good level to sell where minimum risk : reward ratio is 1:2.5

$USDINR Breakout Daily ChartFX_IDC:USDINR Breakout Daily Chart watch closely for a test of the horizontal line. The USD/INR exchange rate is important to the U.S. stock market because it affects the cost of investing in Indian stocks for U.S. investors. When the USD/INR exchange rate is high, it means that it costs more U.S. dollars to buy a given amount of Indian rupees. This makes Indian stocks more expensive for U.S. investors, which can lead to a decline in demand for these stocks. Conversely, when the USD/INR exchange rate is low, it means that it costs less U.S. dollars to buy a given amount of Indian rupees. This makes Indian stocks cheaper for U.S. investors, which can lead to an increase in demand for these stocks.
In addition to the cost of investing, the USD/INR exchange rate can also affect the profitability of U.S. companies that do business in India. When the USD/INR exchange rate is high, it means that U.S. companies that export goods and services to India earn more rupees per dollar. This can boost their profits. Conversely, when the USD/INR exchange rate is low, it means that U.S. companies that export goods and services to India earn fewer rupees per dollar. This can hurt their profits.
Overall, the USD/INR exchange rate is an important factor that can affect the U.S. stock market in a number of ways. It is important for U.S. investors to monitor this exchange rate and factor it into their investment decisions.
Here are some specific examples of how the USD/INR exchange rate can affect the U.S. stock market:
If the USD/INR exchange rate rises sharply, it could lead to a decline in demand for Indian stocks by U.S. investors. This could cause the prices of Indian stocks to fall.
If the USD/INR exchange rate falls sharply, it could lead to an increase in demand for Indian stocks by U.S. investors. This could cause the prices of Indian stocks to rise.
If the USD/INR exchange rate remains high for an extended period of time, it could hurt the profitability of U.S. companies that do business in India. This could lead to lower stock prices for these companies.
If the USD/INR exchange rate remains low for an extended period of time, it could boost the profitability of U.S. companies that do business in India. This could lead to higher stock prices for these companies.

USDINR breaks higher after Indian inflation jumpIndian appeared to have been having success in driving down inflation of late, with CPI falling back from over 7% to 4.8% in the past year. However, the 7.4% retail inflation rate announced today provides a dramatic shift to the landscape, marking the highest rate in 15-years. That has been largely attributed to food prices, which is so heavily weighted that it accounts for nearly half of the overall CPI figure. With that in mind, the whopping 11.51% food inflation rate seen in June managed to drive a similar surge in the headline figure.
For markets, this has seen the rupee weaken, with USDINR rising up towards resistance at 83.28. Coming off the back of a prolonged period of consolidation, it looks likely that we are set for a potential upside breakout. With that in mind, a move through 83.28 resistance would signal a possible impending surge for the pair. To the downside a move below 83.60 would be required to negate that bullish view.
USDINR LongAfter a very good upward rally, for the past few months the USDINR pair is consolidating in a very tight range. If seen on a higher timeframe it forms a bullish flag&pole. Today it has given the breakout and it is a very good opportunity to go long in the script. The target levels and the SL are marked for your reference.

USDINR - Last HopesUSDINR - Real painful time
Time Frame - WEEKLY
USDINR - already its runnign above channel frame however still hopes for weekly closing along with last major Resistance Zone 83.64
Closing weekly above 83.64 than Ready for next journey towards 85 87 89++++
Disclaimer - view Just for educational purposes.

INDIAN RUPEE VS US DOLLAR The Indian rupee has been battling and facing turmoil against the dollar since more than two decades now.Despite the changing monetary rules and policies, the Indian currency has been facing a downfall when compared to the dollars. The current rupee value against US dollar changes every day, due to various reasons that affect Indian rupee.
Global economic slowdown
Crude oil price
FII inflow in Markets gone down / Rise in interest rates in US
Trade deficit

Indian Rupee Will Make New Lows USDINR pair has our attention.
Its peers are already losing enough value. Currencies like RUB, CNH, BRL, ZAR have started feeling the pressure of the mighty US Dollar.
We expect USDINR to make new highs.
Target is above 85.
-Signalwyse Team

USDINR is on verge of break out. USDINR has been trading in the 83-80 area since October 2022. The USDINR has been consolidating for nine months and is on the verge of breaking over the 83 barrier. If it breaks over 83 per USD, the pair might go to 86 within 6 months. When the rupee reaches 86 per USD, the Indian central bank may interfere. The ultimate target for Primary Degree Wave 3 may be 90 per USD in the next couple of years, as illustrated in the graph.

usdinrif usdinr crosses 83 level then heavy sell off will be seen in equity market, if it comes down and remains in range then the market will consolidate/mild bullish, if goes below 81 then a new rally will be seen.

USD/INR has anyone noticed the ascending triangle?seems like a bullish ascending triangle in play but i think can still go either way depending on US inflation and macro-economic factors incl future fed decisions. Thoughts? #INR

USD/INRFX_IDC:USDINR price is currently overbought on RSI and Bollinger Bands along with at a major resistance area. I believe price will fall to the bottom of the triangle. It is breaks the resistance zone, I will be looking for a retest before it continues to rise.

A Bullish Ascending Rectangle Pattern In USDINR!The Rectangular Pattern in Wave IV suggests that the USDINR may rocket higher towards 86 before the end of the year. Because of the barrier rectangle pattern, the pattern is quite bullish.

Caution Note to Investors: USDINR Rise Ahead Recent market trends suggest the possibility of a potential rise in USD INR in the near future, accompanied by significant market fluctuations. It is important to note that the USD INR has been in a consolidation phase since October 2022, forming a flag pattern, which could indicate a prolonged movement ahead.
While there might be opportunities for going long in the market with limited risk and potential for profit-taking, investors should exercise caution. Market fluctuations can be unpredictable and could result in unexpected outcomes. It is advisable to carefully assess your investment decisions and consider waiting for pullbacks before considering a second entry.
Furthermore, it's important to recognize that market movements can be influenced by various factors, and speculating on their connection to upcoming elections is uncertain. Therefore, it's essential for investors to stay informed, seek expert advice, and diversify their portfolios to mitigate potential risks associated with the dynamic market conditions.

Ascending triangle pattern | Accumulation zoneHi traders,
Ascending triangle pattern in Weekly timeframe.
The current market is at Weekly support, if a 4H candle closes above 82.1400 can expect a bulls in the market.
The risk : reward ratio is 1:3 which is a good trade.
Fed meeting is on 26 July 2023, and expected to raise the interest rates by 0.25.

Hunting before FED interest ratesThe ascending triangle pattern in a weekly timeframe is still active, last 2 days(24 & 25 July 2023) was a SL hunting.
The FED news will impact the INR, making USDINR to be bullish.
