USDJPY Long IDEAGoing long of a 1hr support area. aiming for fir resistance zone / FVG. happy trading this is not financial advice
happy trading
33
USDJPY.1000.DUB trade ideas

Short! I opened two short positions yesterday. I have a few short positions that I opened last week, but I feel comfortable adding more now.
Entry - blue horizonal line in the chart.
Stop loss - red horizontal line in the chart.
Target 1, 2, 3 - black horizontal lines in the chart.
If it hit target one, I will move a stop loss to the entry position.Target 1 is the previous month low so I anticipate some correction. Once it resumes the downward movement, I plan to add position.
4H RSI provides reliable indication for pull back or trend reversal. So I will keep an eye on it.
If you are interested in knowing my reasoning for my bearish bias, please check out the linked articles I published last week.

USD/JPY(20250411)Today's AnalysisMarket news:
The annual rate of the US CPI in March was 2.4%, a six-month low, lower than the market expectation of 2.6%. The market almost fully priced in the Fed's interest rate cut in June. Trump said inflation has fallen.
Technical analysis:
Today's long-short boundary:
145.38
Support and resistance levels:
149.05
147.68
146.79
143.97
143.08
141.71
Trading strategy:
If the price breaks through 145.38, consider buying, the first target price is 146.79
If the price breaks through 143.97, consider selling, the first target price is 143.08

USDJPY: intraday tradingusdjpy high timeframe is also at the bottom of the channel so it can make a move as follows Scenario 1 seems more likely and is not investment advice

USDJPY H4 I Bearish ContinuationBased on the H4 chart analysis, the price could rise toward our sell entry at 144.33, which is a pullback resistance.
Our take profit will be at 1141.36, aligning with the 161.8% FIbonacci extension
The stop loss will be placed at 146.47, a pullback resistance.
High Risk Investment Warning
Trading Forex/CFDs on margin carries a high level of risk and may not be suitable for all investors. Leverage can work against you.
Stratos Markets Limited (tradu.com):
CFDs are complex instruments and come with a high risk of losing money rapidly due to leverage. 63% of retail investor accounts lose money when trading CFDs with this provider. You should consider whether you understand how CFDs work and whether you can afford to take the high risk of losing your money.
Stratos Europe Ltd (tradu.com):
CFDs are complex instruments and come with a high risk of losing money rapidly due to leverage. 63% of retail investor accounts lose money when trading CFDs with this provider. You should consider whether you understand how CFDs work and whether you can afford to take the high risk of losing your money.
Stratos Global LLC (tradu.com):
Losses can exceed deposits.
Please be advised that the information presented on TradingView is provided to Tradu (‘Company’, ‘we’) by a third-party provider (‘TFA Global Pte Ltd’). Please be reminded that you are solely responsible for the trading decisions on your account. There is a very high degree of risk involved in trading. Any information and/or content is intended entirely for research, educational and informational purposes only and does not constitute investment or consultation advice or investment strategy. The information is not tailored to the investment needs of any specific person and therefore does not involve a consideration of any of the investment objectives, financial situation or needs of any viewer that may receive it. Kindly also note that past performance is not a reliable indicator of future results. Actual results may differ materially from those anticipated in forward-looking or past performance statements. We assume no liability as to the accuracy or completeness of any of the information and/or content provided herein and the Company cannot be held responsible for any omission, mistake nor for any loss or damage including without limitation to any loss of profit which may arise from reliance on any information supplied by TFA Global Pte Ltd.
The speaker(s) is neither an employee, agent nor representative of Tradu and is therefore acting independently. The opinions given are their own, constitute general market commentary, and do not constitute the opinion or advice of Tradu or any form of personal or investment advice. Tradu neither endorses nor guarantees offerings of third-party speakers, nor is Tradu responsible for the content, veracity or opinions of third-party speakers, presenters or participants.

Might going up, but nothing comfirmed. My bias for LSThis is my bias for London session and friday overall.
USDJPY went down alot yesterday due today USA vs CHINA, dont think i have to explain anything.
If sir Trump doesnt do some magic tomorrow we might hit and upward trend and reverse this bearish movement.
2 lines, 1 for resistance and the other for support.
:-)

11-4-25 YEN Pivot LevelLevels are set
Price had swift breaks of yesterday's levels, but shows, it must react to them.

USDJPY BuyPrice swept the Asian low, tapped into a key Fibonacci retracement zone (0.618), and is now rejecting higher.
Liquidity grab ✅
Discounted entry ✅
Bullish momentum incoming...
Targeting the Asian high as the next liquidity pool. Let’s see if we get the move!

USDJPY- Bullish IdeaLook to buy USDJPY as it has just retraced back to previous support after forming a bullish divergence at 4H and slightly breaking the previous LH. RR is shown in the chart.


Latest US Tariff News Supports USD/JPY's Upward Momentum🔔🔔🔔 USD/JPY news:
➡️ US President Donald Trump said on Wednesday he would temporarily roll back the heavy tariffs he imposed on dozens of countries while continuing to ramp up pressure on China, sending US stocks soaring. US stocks rose on the news, with the benchmark S&P 500 index, open new tab, closing up 9.5%. Bond yields fell from earlier highs and the dollar recovered against safe-haven currencies.
Personal opinion:
➡️ USD/JPY will find strong support after the news. Currently, USD/JPY shows signs of a pullback as the RSI enters overbought territory, but that is only temporary. in the coming time, the upward momentum for this currency pair will still be maintained
➡️ Analysis based on important resistance - support levels and Fibonacci combined with EMA to come up with a suitable strategy
Plan:
🔆Price Zone Setup:
👉Buy USD/JPY 146.6 – 146.45
❌SL: 145.90 | ✅TP: 147.20 – 148.00 – 148.70
FM wishes you a successful trading day 💰💰💰

USDJPYComing from the higher time frame perspective, we have a clear down trend. On H4, price has bounced on FVG, having taken out #liquidity there. Now on M30, I can see a bearish trend confirmed, aligning with the H4 structure.
Waiting for price to tag me in

Possible bearish movement from price level 147.300Setup Description:
Price is approaching a major resistance zone between 147.200 – 147.530, which previously acted as a strong rejection area. Market structure shows signs of a lower high, indicating potential bearish continuation. No clear breakout above resistance, suggesting bulls are losing momentum.
Entry Reasoning:
Previous strong rejection from 147.530
Bearish market structure (lower high)
Potential for large risk-reward if price rejects this zone
Clean traffic down to next support zones

USD/JPY(20250410)Today's AnalysisToday's buying and selling boundaries:
146.66
Support and resistance levels:
150.90
149.32
148.29
145.03
144.01
142.42
Trading strategy:
If the price breaks through 148.29, consider buying, the first target price is 149.32
If the price breaks through 146.66, consider selling, the first target price is 145.03

USD/JPY) Bullish reversal analysis read the Caption EA GOLD point update
This chart is for USD/JPY on the 1-hour time frame,and it presents a bullish trade setup.Let's break down the idea
Key Observations ;
1.Current Price;
USD/JPY is trading Around 146.281.
2.Overall Bias
Bullish setup expecting a bounce from demand into a higher target zone.
3.EMA 200;
price is currently below the 200 EMA (147.942).which usually suggests a bearish trend _but this setup is aiming for a short-term Bullish retracement.

USDJPY H1 I Bullish Bounce Off Based on the H1 chart, the price is falling toward our buy entry level at 145.09, a pullback support that aligns with the 78.6% Fibo retracement.
Our take profit is set at 148.83, a pullback resistance.
The stop loss is set at 143.98, a swing low support.
High Risk Investment Warning
Trading Forex/CFDs on margin carries a high level of risk and may not be suitable for all investors. Leverage can work against you.
Stratos Markets Limited (tradu.com):
CFDs are complex instruments and come with a high risk of losing money rapidly due to leverage. 63% of retail investor accounts lose money when trading CFDs with this provider. You should consider whether you understand how CFDs work and whether you can afford to take the high risk of losing your money.
Stratos Europe Ltd (tradu.com):
CFDs are complex instruments and come with a high risk of losing money rapidly due to leverage. 63% of retail investor accounts lose money when trading CFDs with this provider. You should consider whether you understand how CFDs work and whether you can afford to take the high risk of losing your money.
Stratos Global LLC (tradu.com):
Losses can exceed deposits.
Please be advised that the information presented on TradingView is provided to Tradu (‘Company’, ‘we’) by a third-party provider (‘TFA Global Pte Ltd’). Please be reminded that you are solely responsible for the trading decisions on your account. There is a very high degree of risk involved in trading. Any information and/or content is intended entirely for research, educational and informational purposes only and does not constitute investment or consultation advice or investment strategy. The information is not tailored to the investment needs of any specific person and therefore does not involve a consideration of any of the investment objectives, financial situation or needs of any viewer that may receive it. Kindly also note that past performance is not a reliable indicator of future results. Actual results may differ materially from those anticipated in forward-looking or past performance statements. We assume no liability as to the accuracy or completeness of any of the information and/or content provided herein and the Company cannot be held responsible for any omission, mistake nor for any loss or damage including without limitation to any loss of profit which may arise from reliance on any information supplied by TFA Global Pte Ltd.
The speaker(s) is neither an employee, agent nor representative of Tradu and is therefore acting independently. The opinions given are their own, constitute general market commentary, and do not constitute the opinion or advice of Tradu or any form of personal or investment advice. Tradu neither endorses nor guarantees offerings of third-party speakers, nor is Tradu responsible for the content, veracity or opinions of third-party speakers, presenters or participants.

10-4-25 YEN Pivot LevelObserve again the function of pivot levels.
Use in conjunction with good money management plan

Another tariff u-turn: Oil overbought on news? President Trump announced a 90-day pause on reciprocal tariffs for countries that have not retaliated, sparking a sharp rally in U.S. markets. The Nasdaq 100 led gains with a 12.2% surge. The U.S. dollar also strengthened against safe-haven currencies such as the Japanese yen and Swiss franc.
Crude oil prices rebounded alongside equities, with oil futures rising more than 4% to trade above $62 per barrel.
However, the strength of the oil rally may be overstated. China, one of the world’s largest oil consumers, was among the first to retaliate against U.S. tariffs. Tensions between Washington and Beijing have worsened, prompting the U.S. to raise tariffs on Chinese goods to 125%.
Adding to the caution, analysts at Goldman Sachs revised down their 2026 average price forecasts for Brent and WTI, citing rising recession risks. The bank now expects Brent to average $58 per barrel and WTI to average $55.


next levels for USDJPY will determine future directions
next level for USDJPY will determine direction for next week. wither it will bounce from lower end of channel or will go to next level with historical strong support

USDJPY Bearish continuation below 148.10The USDJPY currency pair remains in a bearish trend, with the recent price action showing signs of an oversold bounce. While a temporary rebound is in play, the broader sentiment remains weak unless a decisive breakout occurs.
Key Levels to Watch:
Resistance Levels: 148.10 (critical level), 150.10, 150.90
Support Levels: 144.20, 143.00, 141.40
Bearish Scenario:
A rejection from the 148.10 resistance level could reaffirm the downside bias, leading to a continuation of the bearish move toward 142.20, with extended declines targeting 143.00 and 141.40 over the longer timeframe.
Bullish Scenario:
A breakout above 148.10 with a daily close above this level would challenge the bearish sentiment, opening the door for further gains toward 150.10, followed by 150.90.
Conclusion:
The market sentiment remains bearish, with 148.10 acting as a critical resistance zone. A rejection from this level could reinforce the downtrend, while a confirmed breakout would shift the outlook to bullish, favouring further upside. Traders should closely monitor price action at this key level for confirmation.
This communication is for informational purposes only and should not be viewed as any form of recommendation as to a particular course of action or as investment advice. It is not intended as an offer or solicitation for the purchase or sale of any financial instrument or as an official confirmation of any transaction. Opinions, estimates and assumptions expressed herein are made as of the date of this communication and are subject to change without notice. This communication has been prepared based upon information, including market prices, data and other information, believed to be reliable; however, Trade Nation does not warrant its completeness or accuracy. All market prices and market data contained in or attached to this communication are indicative and subject to change without notice.

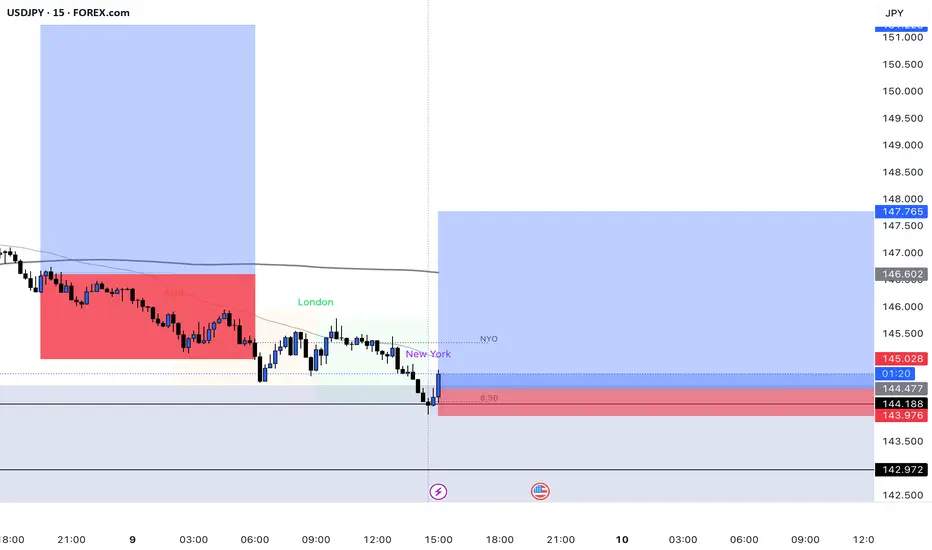
DXY Long Bias – Demand Zone Reaction Driving USD Strength
The U.S. Dollar Index (DXY) is showing early signs of a bullish reversal following a strong reaction off a key intraday demand zone.
📊 Trade Context (USDJPY)
• Entered long after liquidity sweep and demand zone confirmation during NY Open.
• Clear bullish intent with a break of structure on the 15min.
• Aligned with potential DXY recovery, supporting USD strength across the board.
🧠 Bias Justification
• NY session often sets the real direction – and here we see bullish pressure stepping in.
• DXY printing higher lows intraday.
• Correlation with USDJPY and other majors showing early bullish divergence.
🎯 Targets:
• USDJPY: 145.02 > 146.60
• DXY: Eyes on retesting previous resistance zones.
❌ Invalidation:
• Clean break below intraday demand or 143.97 on USDJPY.
📅 April 9, 2025 – NY Session Setup
Let’s see if the dollar bulls take control.
⸻
Let me know if you want it tailored more for social media, or with hashtags like #DXY #USDJPY #Forex #SmartMoneyConcepts etc.
CHECK USDJPY ANALYSIS SIGNAL UPDATE > GO AND READ THE CAPTAINTrade Idea: Long (Buy) Setup
Entry Zone: Around 144.300 (highlighted in blue)
Stop Loss (SL): 143.600
Take Profit Levels:
Take Profit 1: 145.000
Take Profit 2: 145.500
Last Target (Final TP): 146.000
FALLOW RISK MANAGEMENT ✅
