USD/JPY(20250409)Today's AnalysisMarket news:
The U.S. Customs and Border Protection Agency reiterated that the specific tax rates for each country will be announced at 12:01 a.m. on April 9.
Technical analysis:
Today's buying and selling boundaries:
146.77
Support and resistance levels
148.90
148.10
147.59
145.95
145.43
144.63
Trading strategy:
If the price breaks through 145.95, consider buying, the first target price is 146.77
If the price breaks through 145.43, consider selling, the first target price is 144.63
USDJPY.1000.DUB trade ideas

Yen Appreciates with Trade TurmoilThe Japanese yen rose above 146 per dollar on Wednesday, extending gains as Trump's looming tariffs drove safe-haven flows. The dollar weakened on recession fears tied to escalating trade tensions and potential Fed rate cuts. New U.S. tariffs include a 24% duty on Japanese goods and a 25% car import levy. Trump confirmed that Japan will send a delegation to renegotiate terms, while PM Ishiba urged a policy rethink. Domestically, Japan's current account surplus hit a record in February, supported by strong exports and reduced imports, boosting the yen further.
Key resistance is at 148.70, with further levels at 152.70 and 157.70. Support stands at 145.60, followed by 143.00 and 141.80.

USD/JPY H1 | Pullback resistance at 38.2% Fibonacci retracementUSD/JPY is rising towards a pullback resistance and could potentially reverse off this level to drop lower.
Sell entry is at 146.018 which is a pullback resistance that aligns with the 38.2% Fibonacci retracement.
Stop loss is at 146.98 which is a level that sits above the 61.8% Fibonacci retracement and an overlap resistance.
Take profit is at 144.54 which is a multi-swing-low support.
High Risk Investment Warning
Trading Forex/CFDs on margin carries a high level of risk and may not be suitable for all investors. Leverage can work against you.
Stratos Markets Limited (tradu.com):
CFDs are complex instruments and come with a high risk of losing money rapidly due to leverage. 63% of retail investor accounts lose money when trading CFDs with this provider. You should consider whether you understand how CFDs work and whether you can afford to take the high risk of losing your money.
Stratos Europe Ltd (tradu.com):
CFDs are complex instruments and come with a high risk of losing money rapidly due to leverage. 63% of retail investor accounts lose money when trading CFDs with this provider. You should consider whether you understand how CFDs work and whether you can afford to take the high risk of losing your money.
Stratos Global LLC (tradu.com):
Losses can exceed deposits.
Please be advised that the information presented on TradingView is provided to Tradu (‘Company’, ‘we’) by a third-party provider (‘TFA Global Pte Ltd’). Please be reminded that you are solely responsible for the trading decisions on your account. There is a very high degree of risk involved in trading. Any information and/or content is intended entirely for research, educational and informational purposes only and does not constitute investment or consultation advice or investment strategy. The information is not tailored to the investment needs of any specific person and therefore does not involve a consideration of any of the investment objectives, financial situation or needs of any viewer that may receive it. Kindly also note that past performance is not a reliable indicator of future results. Actual results may differ materially from those anticipated in forward-looking or past performance statements. We assume no liability as to the accuracy or completeness of any of the information and/or content provided herein and the Company cannot be held responsible for any omission, mistake nor for any loss or damage including without limitation to any loss of profit which may arise from reliance on any information supplied by TFA Global Pte Ltd.
The speaker(s) is neither an employee, agent nor representative of Tradu and is therefore acting independently. The opinions given are their own, constitute general market commentary, and do not constitute the opinion or advice of Tradu or any form of personal or investment advice. Tradu neither endorses nor guarantees offerings of third-party speakers, nor is Tradu responsible for the content, veracity or opinions of third-party speakers, presenters or participants.

USDJPY Analysis: Potential Reversals Based on Trading MathDear Trader,
Please find attached my analysis of $Subject, which uses mathematical calculations to identify potential reversal times and price levels. The analysis details projected south and north price targets (horizontal lines on the chart), along with estimated time frames for possible reversals (vertical lines on the chart, accurate to within +/- 1-2 candles).
Please note that all times indicated on the chart, including the vertical lines representing
potential reversal times, are based on the UTC+4 time zone.
To increase the probability of these analyses, I recommend monitoring the 5-minute and 15-minute charts for the following key reversal candlestick patterns:
Doji’s
Double Bottom/Top
Engulfing Bullish /Bearish
Hanging Man
Hammer/Inverted Hammer
Morning Star
Shooting Star
Triple Top/Bottom
For those interested in further developing their trading skills based on these types of analyses, consider exploring the mentoring program offered by Shunya Trade.
I welcome your feedback on this analysis, as it will inform and enhance my future work.
Regards,
Shunya Trade
⚠️ Disclaimer: This post is educational content and does not constitute investment advice, financial advice, or trading recommendations. The views expressed here are based on technical analysis and are shared solely for informational purposes. The stock market is subject to risks, including capital loss, and readers should exercise due diligence before investing. We do not take responsibility for decisions made based on this content. Consult a certified financial advisor for personalized guidance.
144522 144630
144481 144671
144386 144766
144196 144956
144006 145147
143817 145337
143627 145528
143438 145719
143248 145910
143059 146101
142304 146866
141550 147634
140799 148403
140049 149175
139302 149948
138556 150724
137813 151501
137071 152281

USDJPY Analysis: Reversal Estimations Based on Trading MathDear Trader,
Please find attached my analysis of $Subject, which uses mathematical calculations to identify potential reversal times and price levels. The analysis details projected south and north price targets (horizontal lines on the chart), along with estimated time frames for possible reversals (vertical lines on the chart, accurate to within +/- 1-2 candles). Please note that all times indicated on the chart, including the vertical lines representing potential reversal times, are based on the UTC+4 time zone.
To increase the probability of these analyses, I recommend monitoring the 5-minute and 15-minute charts for the following key reversal candlestick patterns:
Doji’s
Double Bottom/Top
Engulfing Bullish /Bearish
Hanging Man
Hammer/Inverted Hammer
Morning Star
Shooting Star
Triple Top/Bottom
For those interested in further developing their trading skills based on these types of analyses, consider exploring the mentoring program offered by Shunya Trade.
I welcome your feedback on this analysis, as it will inform and enhance my future work.
Regards,
Shunya Trade
Price levels
Price DH Price DL
144.52194 144.63007
144.48096 144.67107
144.38595 144.76618
144.19602 144.95648
144.00622 145.14691
143.81654 145.33746
143.62698 145.52814
143.43756 145.71894
143.24825 145.90987
143.05907 146.10093
142.30361 146.86639
141.55015 147.63385
140.79868 148.40332
140.04922 149.17478
139.30176 149.94824
138.55630 150.72370
137.81283 151.50117
137.07137 152.28063
⚠️ Disclaimer: This post is educational content and does not constitute investment advice, financial advice, or trading recommendations. The views expressed here are based on technical analysis and are shared solely for informational purposes. The stock market is subject to risks, including capital loss, and readers should exercise due diligence before investing. We do not take responsibility for decisions made based on this content. Consult a certified financial advisor for personalized guidance.

[_] ONENTRYONENTRY
USDJPY- ONENTRY ' 2Fib Strategy '
Timeframe: 30 Minutes
Session: London Pre-Market (00:00 - 06:30 +2GMT)
Step 1: Identify the Overnight Range
Mark the high and low of the price range between 00:00 - 06:30 (+2GMT).
Wait for a clear breakout with a candle closing above (for longs) or below (for shorts) this range.
Step 2: Apply Fibonacci Levels
After the breakout, use the Fibonacci retracement tool:
Anchor Point 1: Start at the close of the breakout candle.
Anchor Point 2: Drag to the start of the impulse move (first candle of the range).
Key level for entry: 0.5 and 0.35 retracement.
Step 3: Trade Execution
Entry: Enter on a pullback to 0.5 and 0.35 Fib level after the breakout.
Stop Loss :
Long trades: Below the low of the breakout candle wick
Short trades: Above the high of the breakout candle wick
Take Profit Targets:
TP1: 1.0 Fib (1:1 risk-reward).
TP2: 1.25 Fib extension.
TP3: 1.6 FIB extension
TP4: 2.3 Fib extension (runner position).
Step 4: Trade Management
Move SL to breakeven when price hits TP1.

USD/JPY Trend Today – JPY is Outperforming🔔🔔🔔 USD/JPY news:
➡️ Buying interest in the Japanese Yen (JPY) remains strong for the second consecutive day on Wednesday, as investors continue to seek safety in the traditional safe-haven currency amid growing concerns over a global recession driven by tariffs. Additionally, reports that U.S. President Donald Trump had agreed to meet with Japanese officials following a phone call with Prime Minister Shigeru Ishiba boosted optimism for a potential trade deal between the U.S. and Japan. This, along with expectations that the Bank of Japan (BoJ) may continue to raise interest rates due to rising domestic inflation, also lent support to the JPY.
Personal opinion:
➡️The JPY is performing better against the USD. DXY is having its second consecutive decline and shows no signs of stopping.
➡️Analysis based on important resistance - support and Fibonacci levels combined with EMA to come up with a suitable strategy
Plan:
🔆Price Zone Setup:
👉Sell USD/JPY 146.40- 146.60
❌SL: 147.10 | ✅TP: 145.80 – 145.10 – 144.50
👉Buy USD/JPY 144.45- 144.55
❌SL: 144.00 | ✅TP: 145.00 – 145.50 – 146.00
FM wishes you a successful trading day 💰💰💰

USDJPY Forecast: AI Strategy Signals Selling OpportunityBased on the EASY Trading AI strategy, I'm spotting a Sell signal for USDJPY. The recommended entry point stands clearly at 146.206, setting a target (Take Profit) at 145.40433333 and placing a safe Stop Loss at 147.55933333. The decision reflects current AI-driven technical patterns that indicate weakening bullish momentum, hinting at a short-term bearish correction. A solid opportunity to capitalize on anticipated downward movement. Be cautious, strictly follow risk management parameters.

USD/JPY Trend Update Today - Maintaining Uptrend🔔🔔🔔 USD/ JPY news:
➡️ The Japanese Yen (JPY) maintains its upward bias against a weaker U.S. Dollar (USD) during Asian trading on Tuesday, despite a lack of strong follow-through buying. While escalating concerns over the negative impact of intensification U.S. tariffs on Japan's economy persist, investors appear confident that the Bank of Japan (BoJ) will continue raising interest rates in 2025, amid signs of rising domestic inflation. Moreover, fears of global economic disruption stemming from U.S. President Donald Trump's tit-for-tat tariff policies have added to the safe-haven appeal of the JPY.
➡️ Still, a modest sentiment rebound in global risk has curbed aggressive bullish bets on the Yen. On the flip side, the USD came under renewed selling pressure, halting its two-day recovery from multi-month lows seen last week, as markets increasingly price in the possibility that the U.S. Economic downturn caused by tariffs could push the Federal Reserve to resume its rate-cutting cycle faster than expected. This stark contrast to the BoJ’s hawkish outlook suggests that the path of least resistance for the lower-yielding JPY remains to the upside.
Personal opinion:
➡️ DXY’s RSI is showing signs of falling after entering the overbought zone, causing USD/JPY to decline in the short term
➡️ The initial uptrend is still maintained, so watch for technical recovery zones to be able to buy at good prices.
➡️ Analysis based on important resistance - support and Fibonacci levels combined with EMA to come up with a suitable strategy.
Plan:
🔆Price Zone Setup:
👉Buy USD/JPY 146.20- 146.00
❌SL: 145.60 | ✅TP: 146.70 – 147.20 – 148.00
FM wishes you a successful trading day 💰💰💰

USDJPY = Win. Finally? I have shit winrate, but at least this trade is "logical", and has followed the trading plan lol.
TRADING SPECS:
BIAS = DOWNTREND
NARRATIVE = 4HR BEARISH PD ARRAY(S/R FLIP+FVG)
CONTEXT = RESPECTED PREMIUM ARRAY + A Wave
ENTRY = SELL STOP ORDER @ A WAVE LOW (RUN ON LIQUIDITY). Nearly got SL'd. OPTIMAL ENTRY WOULD HAVE BEEN THE BEARISH FVG AFTER THE "4HR PREMIUM ARRAY REBALANCE" INSIDE CONTEXT AREA. THERE WAS A SHARP TURN IN THERE SOMEWHERE BUT I DIDN'T WAIT FOR THAT.
RISK MANAGEMENT = N/A(?) JUST LET TRADE PLAY OUT. BUT SL WAS INSIDE THE ORDERFLOW LEG(?)
Here's how it went:
1. Assessed Day Bias - price was downtrending. checked orderflow and candle science for this shit
2. Assessed Current Price "Intention" - price only does two things: seek liquidity, and rebalance fair value.
When I plotted my Key Levels, price was at a point where it was just done seeking liquidity(support + poc was swept) and it was reversing.
I see an S/R Flip + FVG area. If price goes here, that means price has rebalanced fair value.. so, logic dictates that it will reverse again to SEEK LIQUIDITY.
When I came back to this chart again, price has already rebalanced fair value, has respected the S/R Flip + FVG, and has started reversing down.
3. Picked Out a Target - I picked out something realistic. Here is where indicators/tools come in.
Instead of using my confluence mix(POC+FVG+OTE pd array) as entry points,
"I just used it as a target since... price has already rebalanced fair value at the higher TF, and it's already going down, so it's probably going to seek liquidity on the other side. It's most probable target before price may or may not do something else is the FVG+POC+OTE AREA."
My choice of liquidity category was the Previous Day Session nPOC. Along with the FVG and OTE, it was a strong "magnet", especially considering that price has finished seeking buy side liquidity and therefore the price's next target are the liquidities below.
Wow, this makes so much sense to me now.
Price always intend to bounce from opposite liquidities, from higher timeframe to lower timeframe... so...
4. Waited for PA that will Deliver Towards Target - I think my entry here was sloppy, the weakest part of this trade. But it made sense, and it still worked anyway.
I just found a sting candle down(the A wave) after tapping the (S/R Flip+FVG).. I set a sell stop limit on the exact low of that candle.
LOGIC was, if price pushed down below that sting, especially with a strong fvg, it would validate the RESPECT of the (SR FLIP+FVG), and it would continue going down(an invalidation of a long continuation idea)... probably to, again, seek liquidity below.
Reason why I think my entry was sloppy, is because I did not validate the trade idea first. I didn't wait for that sting candle to get "run on(liquidity)" first. I think in order to validate it, I would have waited for the sting to become a run on liquidity area first, and then a second bearish fvg candle close to confirm downtrend. It would have been too late and the profit would have been too small at that point.
5. Put SL at the Orderflow Leg Swing High - If price was really not intending to continue going up, it wouldn't have gone here, which it didn't. I nearly got stopped out, like the other trades I had on sunday and monday.
-------------
Here's the pattern that I keep seeing though, when price makes a valid HIGH(like in this case, the SRFLIP+FVG rebalance), price will attempt to go here atleast twice with a WICK, but will still make lower highs. Usually, those second and third wicks will form as if it's going to take the liquidities at those wicks, but it will just take out the CANDLE BODY HIGHS... So take note of these next time.
When price sweeps a higher timeframe FVG/LIQUIDITY, mark out the candle body closes as TARGET LIQUIDITIES, not the wicks. If a downtrend is valid, it will only take out the body close liquidities. I will make a diagram to help make this make sense lmfao.
-------------
I feel like a mad scientist at this point... endlessly trying to see the actual logic in the market. Not the probabilities of patterns playing out, but the CAUSES and EFFECTS.
I think I'm close to finding the pattern within the pattern... or the message hidden in the patterns(Arcane reference, anyone?).
But I think the two things I have found thanks to Arjo is...
"Price only does two things: 1. Seeking Liquidity 2. Rebalancing Fair Value
and Higher TF = Rebalancing Fair Value <-> Lower TF = Seeking Liquidity"
and
"The Higher the Timeframe, The Stronger the Timeframe"
Like... the market isn't random. I think these two things are the core principles of trading.
Because with these two ideas, you don't need a strategy. You need to UNDERSTAND this. And the strategy can be adapted to whatever you see on the chart.
You open EURUSD, and you see that price is on a downtrend, and it has recently rebalanced the bearish fair value gap on the 4HR? You know what price will do next. It will continue going down to seek liquidity below. So, with that information, what will you look for? How will you enter? Where will you set your entry point, your stoploss, and where is your target?
You open USDCAD, and you see that price is on an uptrend, it has already rebalanced fair value below, has made a bullish choch+FVG, and has respected that choch+FVG on a lower timeframe. You know it will seek buy side liquidity next. So how will you enter? Where will you place your stoploss? Where's your exit?
-------
Now, if only I can translate this knowledge into actual consistency in trading, I can finally make money.
But I guess doing the journal is great. I'm consistently at the 25-30% winrate. So with this understanding.. Maybe I can slowly push that winrate up over time.
I think mechanically, the trade entries i had a year ago and now was the same(choch+POC+FVG+OTE), but now I have the understanding of why it may work or why it won't work, and when do I apply it so I increase the odds of winning. So that's something.
Before, I didn't know why it did or did not work. But now, I know.
I can use this info moving forward to increase my odds.
-------
OH WAIT YEAH, IF I KNOW WHAT THE MARKET DOES AND WHY IT DOES WHAT IT DOES, THEN I WILL BE ABLE TO REFINE MY ENTRIES, BECAUSE NOW I KNOW WHY AND HOW I'M MAKING MY MISTAKES. HELL YEAH.
-------
I'm just not sure about whether I can stick to one entry strategy now, or if I should, or I won't trade something that looks doable under my principles... because I've studied everything, and it makes sense now. lmfao.
-------
if people are reading this(up to this point lol that was a long ash read), then thank you. Reply with your thoughts if ever.
Alright thanks bye

ChartGeq Breakdown – [PAIR] [TIMEFRAME]📈 ChartGeq Breakdown –
This setup was taken based on full structure confirmation:
✅ 20 & 200 SMA aligned in the same direction
✅ Price action close to the 20 SMA
✅ Clean session-protected entry with clear market structure
No guessing. Just solid technical confirmation backed by momentum and timing.
Posted for educational purposes to help traders recognize quality entries and avoid emotional trades.
— Coach D.R | ChartGeq
We don’t guess. We confirm.

Usdjpy 8 Apr updateAs per last usdjpy post, price formed 5 waves down which signal end of a phase.
Price indeed move up and now formed a more bullish outlook.
Maybe mr market is trapping all those bears and going to hunt their stops, as traders thought shorting usdjpy is easy money for risk aversion(Tariffs war).
Anyway, the move up had given a few hundred pips of profit, closed most and running the rest up, "if it works...lol"

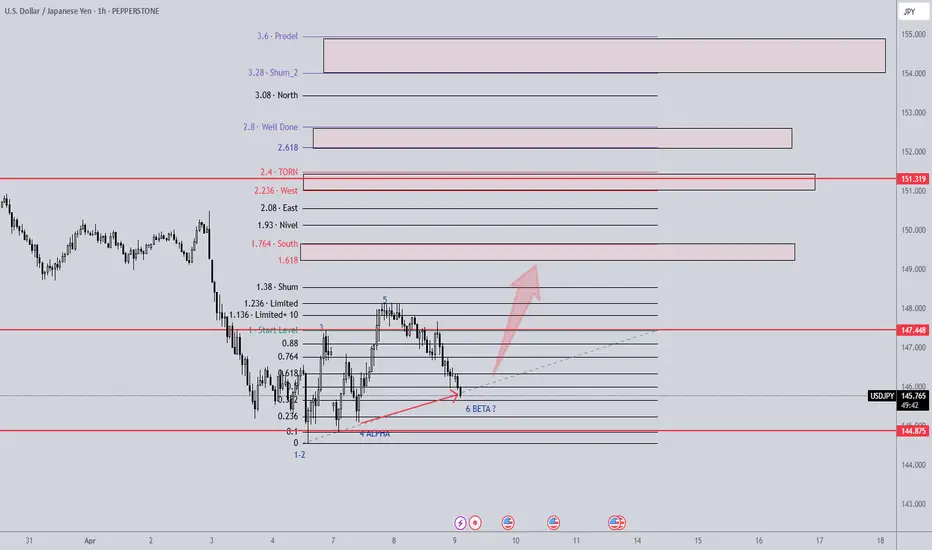
USDJPY PROYECTION 08.04.2025POTENTAL AND INITIAL CICLE IN USDJPY H1
A.A. Almazov technique
USDJPY PROYECTION 08.04.2025
Usdjpy Scenrio 09/04/2025English : According to our analysis, we anticipate a bullish scenario.
Morocan Darija : kanchofo d'apres l'analyse dyalna antsanaw Tloo3
ATENTION : I only share my ideas, not signals


USDJPY in Trend ReversalAfter making a Bullish Divergence on the 15 min chart, and taking the sell side liquidity I expect the trend to change and we are targeting the next two areas of liquidity on the up side.
Buy Limit
Entry Price 146.22
Stop Loss 145.78
Risk 1%
Lot Size 0.85
TP1 146.66
TP2 147.10

CHECK USDJPY ANALYSIS SIGNAL UPDATE > GO AND READ THE CAPTAINENTRY POINT
The blue rectangle highlights the potential entry zone, around the current market price near 146.200.
1. Take Profit 1 (TP1): Approximately at 146.500
2. Take Profit 2 (TP2): Higher level, just above TP1
3. Last Target: 147.000 – the final target for the trade
STOP LOSS
Clearly marked in red around 145.800, just below the entry zone to limit

USD/JPY) Bullish reversal analysis Read The ChaptianSMC Trading point update
This chart is for USD/JPY on the 1-hour timeframe, and it presents a bullish trade setup. Let’s break down the idea
---
Key Observations:
1. Current Price:
USD/JPY is trading around 146.281.
2. Overall Bias:
Bullish setup expecting a bounce from demand into a higher target zone.
3. EMA 200:
Price is currently below the 200 EMA (147.942), which usually suggests a bearish trend — but this setup is aiming for a short-term bullish retracement.
4. Demand Zone (Buy Area):
Marked in yellow between 145.822 and slightly above.
Labeled as "FVG orders" (Fair Value Gap), suggesting institutional interest or imbalance fill.
5. Trendline Support:
The price is approaching a rising trendline, adding confluence for a potential bounce.
6. Expected Move:
Price is expected to bounce from the demand zone, form a higher low, and then move up toward the target zone at 148.221.
Two upside targets are drawn:
First Move: ~1.12% (30.6 pips)
Full Target: ~1.76% (256.1 pips)
Mr SMC Trading point
7. RSI (Relative Strength Index):
RSI is around 37.66, nearing oversold territory, supporting a bullish reversal idea.
---
Trade Idea Summary:
Bias: Bullish
Entry Zone: Around 145.822 (fair value gap & trendline support)
Target Zone: 148.221
Stop Loss: Likely just below the demand zone or trendline
Confluence Factors:
Trendline support
RSI nearing oversold
Fair value gap zone
EMA 200 overhead (target acts as resistance)
---
Pelas support boost 🚀 analysis follow

USDJPY Breakdown?Hello traders, this is a complete multiple timeframe analysis of this pair. We see could find significant trading opportunities as per analysis upon price action confirmation we may take this trade. Smash the like button if you find value in this analysis and drop a comment if you have any questions or let me know which pair to cover in my next analysis.

USDJPY BUY📈 USDJPY: Potential Rebound Setup on M15/M5 🕒🔁
Looking at USDJPY on the 15-minute and 5-minute charts, there's a promising rebound setup forming that could align with the ongoing bullish move.
📍 Target: A possible price rebalancing toward the 150 zone.
🔸 Let’s not forget, I already have a running position on this pair, so I’m keeping a close eye on this short-term action.
💬 What do you think? Possible rebound or just a pause before more downside? 👀

USDJPY Bearish IdeaSell limit on USDJPY set!!
Reason?
1. Uptrend finished, and downtrend about to continue.
2. Supply zone with imbalance not yet mitigated.
3. H4 and H4 same direction.
4. Price reacted to area of SBR (it can continue downtrend from here).
I will be targetted 2RR from this trade. Let's go.

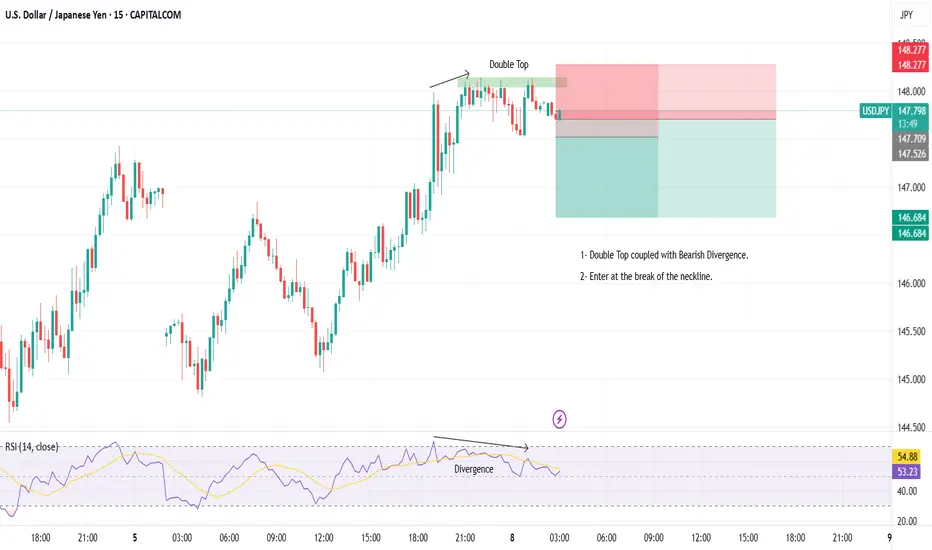
08-04-2025 _ Short Term Bearish Idea _ USDJPY M151- Double Top coupled with Bearish Divergence.
2- Enter at the break of the neckline.