USDJPY hourly trend analysis for April 04, 2025USDJPY is bearish with a short signal confirmation with stop loss at 146.29. Further downtrend will take the support level at 144.435.
USDJPY.1000.DUB trade ideas

USDJPY ready for another Long ? at weekly support area USDJPY is near the weekly uptrend support area look for the Price reversal in this area of 143 and 144.

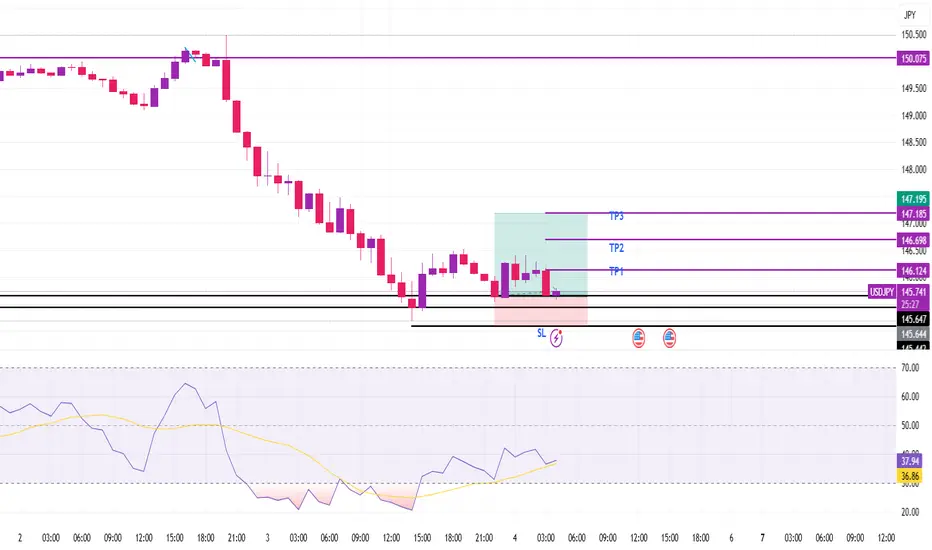
USDJPY Buying SetupUSDJPY is currently sitting in a key support zone, signaling a potential bullish momentum build-up. This bias is supported by the formation of a strong bullish candle at the level, suggesting buyers are stepping in.
Importantly, price has respected structure—no lower low (LL) was formed. Instead, we’ve got a clean higher low (HL), which aligns perfectly with a bullish continuation scenario.
Take-profits (TPs) and stop-loss (SL) levels are chosen with precision, keeping recent market structure and volatility in mind. As always, proper risk management is crucial for capital protection.
Regards
Sherry
Falling towards Fibo confluence?USD/JPY is falling towards the pivot which is a pullback support and could bounce tot he 1st resistance.
Pivot: 143.94
1st Support: 142.19
1st Resistance: 147.13
Risk Warning:
Trading Forex and CFDs carries a high level of risk to your capital and you should only trade with money you can afford to lose. Trading Forex and CFDs may not be suitable for all investors, so please ensure that you fully understand the risks involved and seek independent advice if necessary.
Disclaimer:
The above opinions given constitute general market commentary, and do not constitute the opinion or advice of IC Markets or any form of personal or investment advice.
Any opinions, news, research, analyses, prices, other information, or links to third-party sites contained on this website are provided on an "as-is" basis, are intended only to be informative, is not an advice nor a recommendation, nor research, or a record of our trading prices, or an offer of, or solicitation for a transaction in any financial instrument and thus should not be treated as such. The information provided does not involve any specific investment objectives, financial situation and needs of any specific person who may receive it. Please be aware, that past performance is not a reliable indicator of future performance and/or results. Past Performance or Forward-looking scenarios based upon the reasonable beliefs of the third-party provider are not a guarantee of future performance. Actual results may differ materially from those anticipated in forward-looking or past performance statements. IC Markets makes no representation or warranty and assumes no liability as to the accuracy or completeness of the information provided, nor any loss arising from any investment based on a recommendation, forecast or any information supplied by any third-party.


Short All weekly momentum indicators IMACD, RSI and Stochastic) are all bearish, so I have been looking for a short opportunity in 4H and daily charts.
$151.85 is the major resistance and support zone (black horizontal line in the chart).
On Feb 6, USD/JPY broke and closed below the area, but it failed to continue to the downside.
In the following few days, it retraced to Fib 0.5 area but started to move down. Today the price broke below Fib 0.236. I like the yesterday's strong red candle, cancelling all the buy pressure from the previous day.
I opened a short position this morning.
Entry at $152.83.
Stop Loss: $155.145
Target 1: $149.52 (move stop loss to the entry level once it hits this level)
Target 2: $147.395


Is it time for a relief for the Yen?After a severe beating by the USD especially the tumultous rise inflation, Japans currency is gonna look for some relief as Tariifs will clearly lead to an economic slowdown of U.S economy, as more cheap stuff from China and the emerging market will clearly look to rise and that may weigh on consumer sentiment.
🟨 - Head abd Shoulders
🟥🔘 - Price/RSI Deviation

USDJPY Sell Opportunity Support Turns Resistance.
We expecting full time breakout.
Then PullBack with bearish engulfing candle stick confirmation as parts of confluences before anticipating a SELL.
Remember we must be patience to wait for our setups to Playout as analysed ✍️

USDJPY Reversal: Bearish Momentum Builds Below Key ResistanceUSDJPY pair is showing signs of a bearish reversal after rejecting a key resistance zone near 151.241. The price has failed to sustain bullish momentum and has formed a potential double-top/wedge structure, indicating a shift in trend.
Key Resistance: 151.241 - 152.097 (Strong supply zone)
Bearish Confirmation: Break below 149.592 confirms downside continuation.
Key Downside Targets: 148.195, 146.990, and 145.855 as major support zones.
If sellers maintain pressure, a deeper pullback toward the 145.855 - 145.824 region could be expected. However, a break above 152.097 would invalidate the bearish setup and could push the price toward 154.090.

PY/USD Analysis: Rising Wedge Bearish Reversal & Short SetupThis chart represents the JPY/USD (Japanese Yen vs. US Dollar) on a daily timeframe (1D), published on April 3, 2025, via TradingView. The price action and technical indicators suggest a bearish outlook based on the formation of a Rising Wedge Pattern, a classic reversal structure signaling potential price depreciation.
1. Chart Structure & Identified Patterns
A. Rising Wedge Formation (Bearish Reversal Pattern)
The price has been moving in an uptrend, forming higher highs (HH) and higher lows (HL).
The two converging black trendlines indicate a rising wedge, a pattern that typically precedes a downside breakout.
A rising wedge is considered a bearish signal, especially when formed after a strong rally.
B. Support and Resistance Levels
Resistance Zone (Highlighted in Beige, Upper Range)
This level represents a historically significant supply area where selling pressure is expected.
Price action shows multiple rejections at this level, indicating the presence of strong resistance.
The red downward arrow further confirms that this level is acting as a cap on price movement.
Support Zone (Highlighted in Beige, Lower Range)
This area previously served as a strong demand level, where buyers stepped in, reversing the price.
The green upward arrow suggests that it played a critical role in the prior bullish move.
C. Key Price Levels
All-Time High (ATH) Marked at ~0.007155
This represents the historical peak price, which serves as a potential long-term resistance.
Stop-Loss Placement (~0.006959)
This is placed above the resistance level to manage risk in case of a false breakout.
Target Level (~0.006178)
Based on the wedge height, this level is calculated as the measured move after a breakdown.
2. Price Action & Market Sentiment
A. Recent Bullish Move
The market has been in a strong uptrend since hitting the support zone.
This move was characterized by higher lows and higher highs, reinforcing bullish momentum.
However, momentum appears to be weakening as the price struggles to break through the resistance.
B. Confirmation of a Bearish Reversal
The price has touched the upper resistance zone multiple times but failed to break through.
The trendline breakdown (expected move) suggests sellers are stepping in.
A lower high formation is seen as an early warning of a reversal.
3. Trade Setup: Short Position Strategy
This setup aligns with the principles of technical analysis, utilizing the Rising Wedge as a bearish reversal pattern.
A. Entry Strategy
Sell Entry Trigger: Enter a short trade upon a confirmed breakdown below the lower trendline.
Retest Confirmation: Ideally, wait for a pullback to the broken trendline before shorting to avoid false signals.
B. Risk Management
Stop-Loss Placement: Above the resistance zone at 0.006959, to protect against an invalidation.
Take-Profit Target: Set at 0.006178, calculated based on the wedge’s height projection.
C. Reward-to-Risk Ratio (RRR)
RRR = 2:1 or higher
The target level offers a risk-reward ratio that justifies the trade setup.
4. Summary & Final Outlook
Bearish Signals:
✅ Rising Wedge Pattern – A strong reversal indicator.
✅ Lower Highs and Weak Momentum – Suggests selling pressure.
✅ Failure to Break Resistance – Indicates bullish exhaustion.
✅ Projected Target Based on Wedge – Price expected to reach 0.006178.
Neutral Considerations:
If price does not break the lower trendline, the pattern is not validated.
If a false breakdown occurs, prices may briefly recover before falling.
Bullish Invalidation:
If the price breaks above 0.006959 and sustains above resistance, the bearish setup is invalidated.
Final Verdict:
📉 Bearish Bias – The market setup favors a downside move upon a confirmed breakdown.
🎯 Target: 0.006178 (Key support level).
⚠️ Risk: If the price does not break lower, consolidation may occur before a clearer move.

USD/JPY - ShortWeekly (Bias Validation)
- Price between EMAs → ❌ Ranging
- Major Swing Point High: 158.880 Low: 146.543
D1 (Daily): Trend Bias
- Price below 200EMA & 50EMA on D1 → ✅ Bearish Bias
- Major Swing Point High: 154.804 Low: 146.543
- ✅ Break of Structure (BoS) + Volume Imbalance
- Price below Weekly VWAP → ✅ Bearish Bias
H4 (4-Hour): Trend Bias
- Price below 200EMA & 50EMA on D1 → ✅ Bearish Bias
- Major Swing Point High: 151.214 Low: 149.684
- ✅ Break of Structure (BoS) + Volume Imbalance
- Price below Weekly VWAP → ✅ Bearish Bias
- High-Probability Entry Zones (H4 OTE)
- H4 OB (OTE)
H1 (1-Hour): Trend Bias
- Swing Point High: 150.953 Low: 149.684
- ✅ Break of Structure (BoS) + Volume Imbalance
- H4 OB → (OTE)
- H1 OB → (OTE)
🔲 Validate with VWAP:
✔ ✅ H1 VWAP must align with H4 OTE before entry
✔ ✅ If price rejects H1 VWAP + OB midpoint, strong trade setup
🔲 Entry Options:
✔ Option 1 (Limit Order Entry):
* Place a limit order at the OB midpoint inside OTE
* Set stop-loss below OB (for longs) / above OB (for shorts)
✔ Option 2 (EMA Confirmation Entry):
* ✅ Enter when 9EMA crosses 21EMA near OTE
* ✅ Must have Volume Imbalance Confirmation
🔲 Final Confirmation:
✔ ✅ High Volume on Structure Break → Confirms strong move
✔ ✅ Low Volume on Pullback → Smart money accumulation

USD/JPY (Short)Daily:
Price < 200EMA
Swing Period 10
Swing High: 158.880
Swing Low: 146.543
Volume Imbalance: 5 Candles
Daily Order Block: 155.223 / 153.916
H4:
Price < 200EMA
Swing Period: 7
Swing High: 152.315
Swing Low: 146.597
Volume Imbalance: 3 Candles
H4 Order Block: 152.762 / 151.242
H1:
Swing Period: 5
Swing High: 152.315
Swing Low: 146.597
Volume Imbalance: 3 Candles
H1 Order Block: 151.762 / 151.628
Model 1:
Entry Price: 151.692
Stop Loss: 152.447
TP1: 150.115 @ 1:2 / 50%
TP2: 149.363 @ 1:3 / 25%
SL: Breakeven
TP3: 146.552 @ 1:5 / 25%
Model 2:
Entry Price: 151.108 - 150.141
Entry Trigger: 9EMA X 21EMA
SL: Above recent swing high
TP1: 1:2
SL: Trailing 9EMA

USDJPY short on daily chartStop Loss = 152.065
Entry Order = 149.815
TP1 = 147.565
Two positions with the same stop loss and x1 target for the first position
The stop loss of the second position to breakeven when the first position hits the target1.
The second position has no target, only exit
Risk = 2% of account capital (1% each position)

USD/JPY... 4H pair...Here’s a structured analysis and actionable plan for the *USDJPY* trade idea based on the bearish flag breakdown and key technical levels:
---
### *Trade Setup Overview*
- *Pattern Identified*: Bearish Flag breakdown (continuation pattern) after a prior downtrend.
- *Key Resistance*: 100-period Moving Average (MA) acting as dynamic resistance.
- *Entry Trigger: Retest of the broken flag’s lower boundary near **149.300*.
- *Targets*:
- *TP1: 148.30* (100 pips, aligns with the flag’s measured move).
- *TP2: 146.60* (270 pips, targets a major swing low and psychological level).
- *Stop Loss: **150.00* (70 pips risk, above the flag’s upper boundary and recent swing high).
---
### *Critical Technical Factors*
1. *Bearish Flag Dynamics*:
- The flag’s "pole" (prior decline) suggests a measured move target of *~148.30* (TP1).
- A close below the flag confirms momentum; watch for follow-through selling.
2. *Confluence with Moving Averages*:
- The 100-MA resistance reinforces bearish pressure. A rejection here adds confidence to the downtrend.
- A break below the 200-MA (if applicable) would signal a deeper bearish shift.
3. *Key Support Levels*:
- *148.30*: Near-term target (previous swing low).
- *146.60*: Long-term support (2023 lows, 61.8% Fibonacci retracement of 2021-2023 rally).
---
### *Risk Management*
- *Risk-Reward Ratio*:
- TP1: *1:1.4* (70 pips risk vs. 100 pips reward).
- TP2: *1:3.8* (70 pips risk vs. 270 pips reward).
- *Adjust Stops*: Trail stops to breakeven if TP1 is hit to lock in gains.
---
### *Fundamental Catalysts to Monitor*
1. *Fed Policy*: Dovish signals (rate cuts) could accelerate USD weakness.
2. *BOJ Intervention*: Watch for verbal or direct action to defend JPY above 150.00.
3. *Risk Sentiment*: JPY strength may surge if equity markets sell off (safe-haven flows).
---
### *Execution Plan*
🔽 *Sell Entry*: 149.300 (wait for price to retest the broken flag boundary).
🎯 *TP1*: 148.30 (partial profit-taking).
🎯 *TP2*: 146.60 (requires sustained bearish momentum).
🚫 *Stop Loss*: 150.00 (avoids false breakdowns).
---
### *Will the USD Continue to Decline?*
- *Yes, but with caution: The bearish flag and MA resistance favor downside, but JPY’s inherent weakness (BOJ’s ultra-loose policy) may limit sustained USDJPY declines. Focus on **TP1 (148.30)* as a high-probability target, while TP2 depends on broader USD trends and macro drivers.
*Key Takeaway*: Trade aligns with short-term momentum, but remain agile given JPY’s sensitivity to central bank policies and risk sentiment.

dead lineDo not touch any stocks until it cross the line, and then you can take it. July will cancel all

Last level to break short. fundamentals MOMENTUMFX:USDJPY – The last critical level to break before we commit to a strong short position. If the price decisively breaks through this level, we could see a surge in selling pressure, likely triggering a solid downtrend. Watch for a clean break and retest of this level for confirmation. If this level holds and starts to reject, the bears might take full control, and we could see this pair drop significantly. Patience is key, but the setup looks promising for a strong move down if this level fails to hold. 🐻📉

USDJPY Sell opportunity USDJPY has been on an upward movement till Market shift occurred Which changed to a downward movement.
So,I looked for a zone where the failed zone which stopped the buy movement, shifted to downward , expecting the zone to be swept with liquidity before scouting for sell opportunities.And it was massively respected.

USDJPY Analysis: A Short Opportunity Ahead Based on EASY TradingThe EASY Trading AI strategy signals a selling opportunity on USDJPY at the entry point of 149.207. The trade target is set at 148.70633333, with a protective stop loss established at 150.09433333. The decision to sell aligns with the AI model indicating an overbought scenario near the current resistance levels. Technical indicators within EASY Trading AI strategy suggest weakening bullish momentum, increasing probabilities of a corrective downward move. Traders are advised to monitor closely and maintain risk management at recommended levels.

30-03-2025 _ Short Term Bearish Idea _ USDJPY H41- Bearish Divergence on RSI.
2- Rising Trendline Breakout.
3- Price has also broken below Support Zone
which had been Resistance in the past.
4- Therefore, we can expect a pullback followed
by further continuation to the downside.

USDJPY Is Going Up! Buy!
Please, check our technical outlook for USDJPY.
Time Frame: 1D
Current Trend: Bullish
Sentiment: Oversold (based on 7-period RSI)
Forecast: Bullish
The market is approaching a key horizontal level 146.824.
Considering the today's price action, probabilities will be high to see a movement to 149.538.
P.S
Please, note that an oversold/overbought condition can last for a long time, and therefore being oversold/overbought doesn't mean a price rally will come soon, or at all.
Disclosure: I am part of Trade Nation's Influencer program and receive a monthly fee for using their TradingView charts in my analysis.
Like and subscribe and comment my ideas if you enjoy them!


USDJPYHello Traders! 👋
What are your thoughts on USDJPY?
USDJPY is moving within a descending channel and has currently reached the top of the channel, just below a resistance zone.
We anticipate some consolidation in this area, followed by a potential drop toward the bottom of the channel.
For a safer sell entry, it’s better to wait for a break below the specified support level.
After the breakout, a pullback to the broken support could offer a good sell opportunity.
💡Will USD/JPY respect the channel and head lower, or break out to the upside? Share your view below! 👇
Don’t forget to like and share your thoughts in the comments! ❤️
